
Symbolic Regression Model for Predicting Compression Strength of Prismatic Masonry Columns Confined by FRP

Department of Civil and Construction Engineering, College of Engineering, Imam Abdulrahman Bin Faisal University, Dammam 31451, Saudi Arabia
*
Author to whom correspondence should be addressed.
Buildings 2023, 13(2), 509; https://doi.org/10.3390/buildings13020509
Submission received: 4 January 2023
/
Revised: 1 February 2023
/
Accepted: 10 February 2023
/
Published: 13 February 2023
(This article belongs to the Special Issue Research on Building Materials for Structural Characterization and Applications)
Abstract
:The use of Fiber Reinforced Polymer (FRP) materials for the external confinement of existing concrete or masonry members is now an established technical solution. Several studies in the scientific literature show how FRP wrapping can improve the mechanical properties of members. Though there are numerous methods for determining the compressive strength of FRP confined concrete, no generalized formulae are available because of the greater complexity and heterogeneity of FRP-confined masonry. There are two main objectives in this analytical study: (a) proposing an entirely new mathematical expression to estimate the compressive strength of FRP confined masonry columns using symbolic regression model approach which can outperform traditional regression models, and (b) evaluating existing formulas. Over 198 tests of FRP wrapped masonry were compiled in a database and used to train the model. Several formulations from the published literature and international guidelines have been compared against experimental data. It is observed that the proposed symbolic regression model shows excellent performance compared to the existing models. The model is easier, has no restriction and thereby it can be feasibly employed to foresee the behavior of FRP confined masonry elements. The coefficient of determination for the proposed symbolic regression model is determined as 0.91.
1. Introduction
Unconfined masonry has been used worldwide for hundreds of years and is still used today. This type of construction is susceptible to earthquakes, environmental degradation, and occupancy changes. Poor construction practices, inferior materials, and structural detailing defects reduce the strength. These factors seek an effective strengthening approach to improve masonry column capacity. Strengthening or upgrading existing structures is treated as more cost-effective than demolishing or rebuilding. For future generations to enjoy historic structures, they must be strengthened and retrofitted. Strengthening compression elements is crucial to preventing catastrophic damage to historic vertical load-bearing structures [1,2].
Fiber-reinforced polymer (FRP) materials might be used to reinforce and strengthen concrete columns due to their light weight and high strength [3]. FRP composites reduce dead weight and simplify application in restricted areas. Several studies have explored the possibility of confining concrete columns externally with FRP by associating the fibers perpendicular to the columns’ vertical axis in the direction of hoop stresses. Bashiri and Toufigh [4] tested and analyzed a CFRP strips to confine concrete panels to reduce the weight of Buckling-restrained braces. Rodríguez et al. [5] introduced strengthening heavily damaged beam-column assemblies confined by CFRP wrapping and SFRM casing. Some researchers studied FRP-wrapped concrete columns [6,7,8]. Thamboo et al. [9] strengthened masonry wallets with CFRP and tested under concentric and eccentric loads. Thamboo [3] compared experimental and analytical approaches to evaluate the performance of axially loaded masonry columns confined with composites. Wan et al. [10] tested the mechanical behavior of basalt-reinforced masonry columns under eccentric loading. Li et al. [11] studied axially loaded masonry columns confined textile reinforced concrete with short fiber. FRP confinement on masonry columns has been studied. [12,13] to evaluate masonry wrapped with FRP jackets. Faella et al. [14] proposed calibrated confinement models. Internally confined masonry with FRP bars injected in column holes with or without FRP wraps and discontinuous confinement by FRP strips have been introduced by Micelli et al. [15]. Discontinuous confinement by FRP strips were studied in [16,17,18]. Experimental results of FRP confinement were compared to analytical models to validate their accuracy [3,14,19,20,21,22].
The Artificial Neural Networks (ANN) is one of the most popular Artificial Intelligence (AI) techniques that are used a lot in civil and structural engineering to predict how structural elements such as beams and columns will behave based on experimental results considered as training, testing, and verification data [23,24]. The ANN-based model is a very effective approach to predict the properties of concrete [25,26]. Hasançebi and Dumlupınar [27] developed linear and nonlinear model upgrading of RC T-beam bridges using ANN networks. The Support Vector Regression (SVR), another popular technique of AI, has also been used in predicting the properties of materials [28]. Sun et al. [29] demonstrated the chemical, mechanical, and hydrothermal stimulation for waste glass-reinforced cement. However, very limited work has been conducted in the area of predicting behavior of confined masonry column under axial load using AI techniques such as ANN and SVR. A symbolic regression (SR) approach is a very recent concept of artificial intelligence that could be used to model the behavior of structural element. Such a machine learning system has been employed in several studies [30,31]. Rezaei et al. [32] studied seismic fragility assessment of RC box-girder bridges employing the SR approach. Symbolic regression in materials science was presented by Wang et al. [33] via dimension-synchronous-computation. Mansourdehghan et al. [34] conducted data-driven evaluation of RC shear walls utilizing visual damage. However, due to the material’s complexity and heterogeneity in comparison to concrete, there are a number of analytical expressions for determining the compressive strength of FRP-confined masonry.
Therefore, the current study deals with the analysis of FRP confinement of masonry columns in order to propose a new model for estimating compressive strength of FRP confined masonry using symbolic regression approach by adopting genetic programming which is an artificial intelligence technique to solve symbolic regression and produce a closed-form mathematical expression which is much simpler to inspect and implement, particularly for hand calculations. The artificial intelligence model was trained by largest database ever built in the literature with varying parameters and the performance of the proposed model was compared with the performance of twelve most important theoretical models available in the scientific literature. Furthermore, the comparisons of the models have been clearly shown that the proposed model has an excellent agreement with R2 equals to 0.91 which is superior compared to the existing models.
The manuscript is structured in a simple outline. The available analytical FRP confined masonry models and experimental database collected from scientific literature are presented in Section 2 and Section 3, respectively. Brief description about symbolic regression model is given in Section 4. The results and the findings, and comparison of proposed symbolic regression model with existing formulas in literature are explained in the following sections. In Section 7, reached conclusions are summarized.
2. Analytical FRP Confined Masonry Models
Few analytical models are currently available to compute the compressive strength of FRP-confined masonry. Such existing models rely on both the unconfined masonry strength, ; and the effective lateral confining pressure . Some of them are linear, while others are nonlinear. However, regardless of the complexity, they were mostly derived from a small number of experimental data. The Italian National Research Council (CNR) [35] reported common relationship considering the nominal density of the masonry element , stated in kg/m3, in the estimation of . In particular, the parameter approximately estimates the effect of porosity and voids of both the constituent materials as well as texture of masonry on the axial compressive strength.
The generalized expression to obtain the confined masonry’s compressive strength is shown in Equation (1).
The is compressive strength of masonry and is compressive strength of FRP confined masonry, denotes effective confining pressure, where is a non-dimensional coefficient unless a more detailed analysis is accomplished, may be derived as follows:
and are coefficients equal to 1.0 if no additional experimental data is obtainable. is the masonry mass-density and equivalent to the symbol ().
Equation (3) is a general formulation for calculating the effective confinement stress, where is the equivalent confinement stress produced by FRP composite on wrapped column. The effective confining pressure, is determined considering the cross-section shape and the FRP strengthen system.
The is the efficiency coefficient derived as a product of the horizontal and vertical efficiency coefficients, and , respectively, and denotes the coefficient incorporating composite topology and material. The lateral confining pressure can be calculated according to the rigid body equilibrium between pressure and force in the external wrap. The lateral pressure produced by FRP jackets on rectangular or square cross-sections can be estimated using Equation (4) for columns with continuous FRP wrapping. Using Equation (5) the lateral pressure can be calculated for columns with discontinuous FRP wrapping:
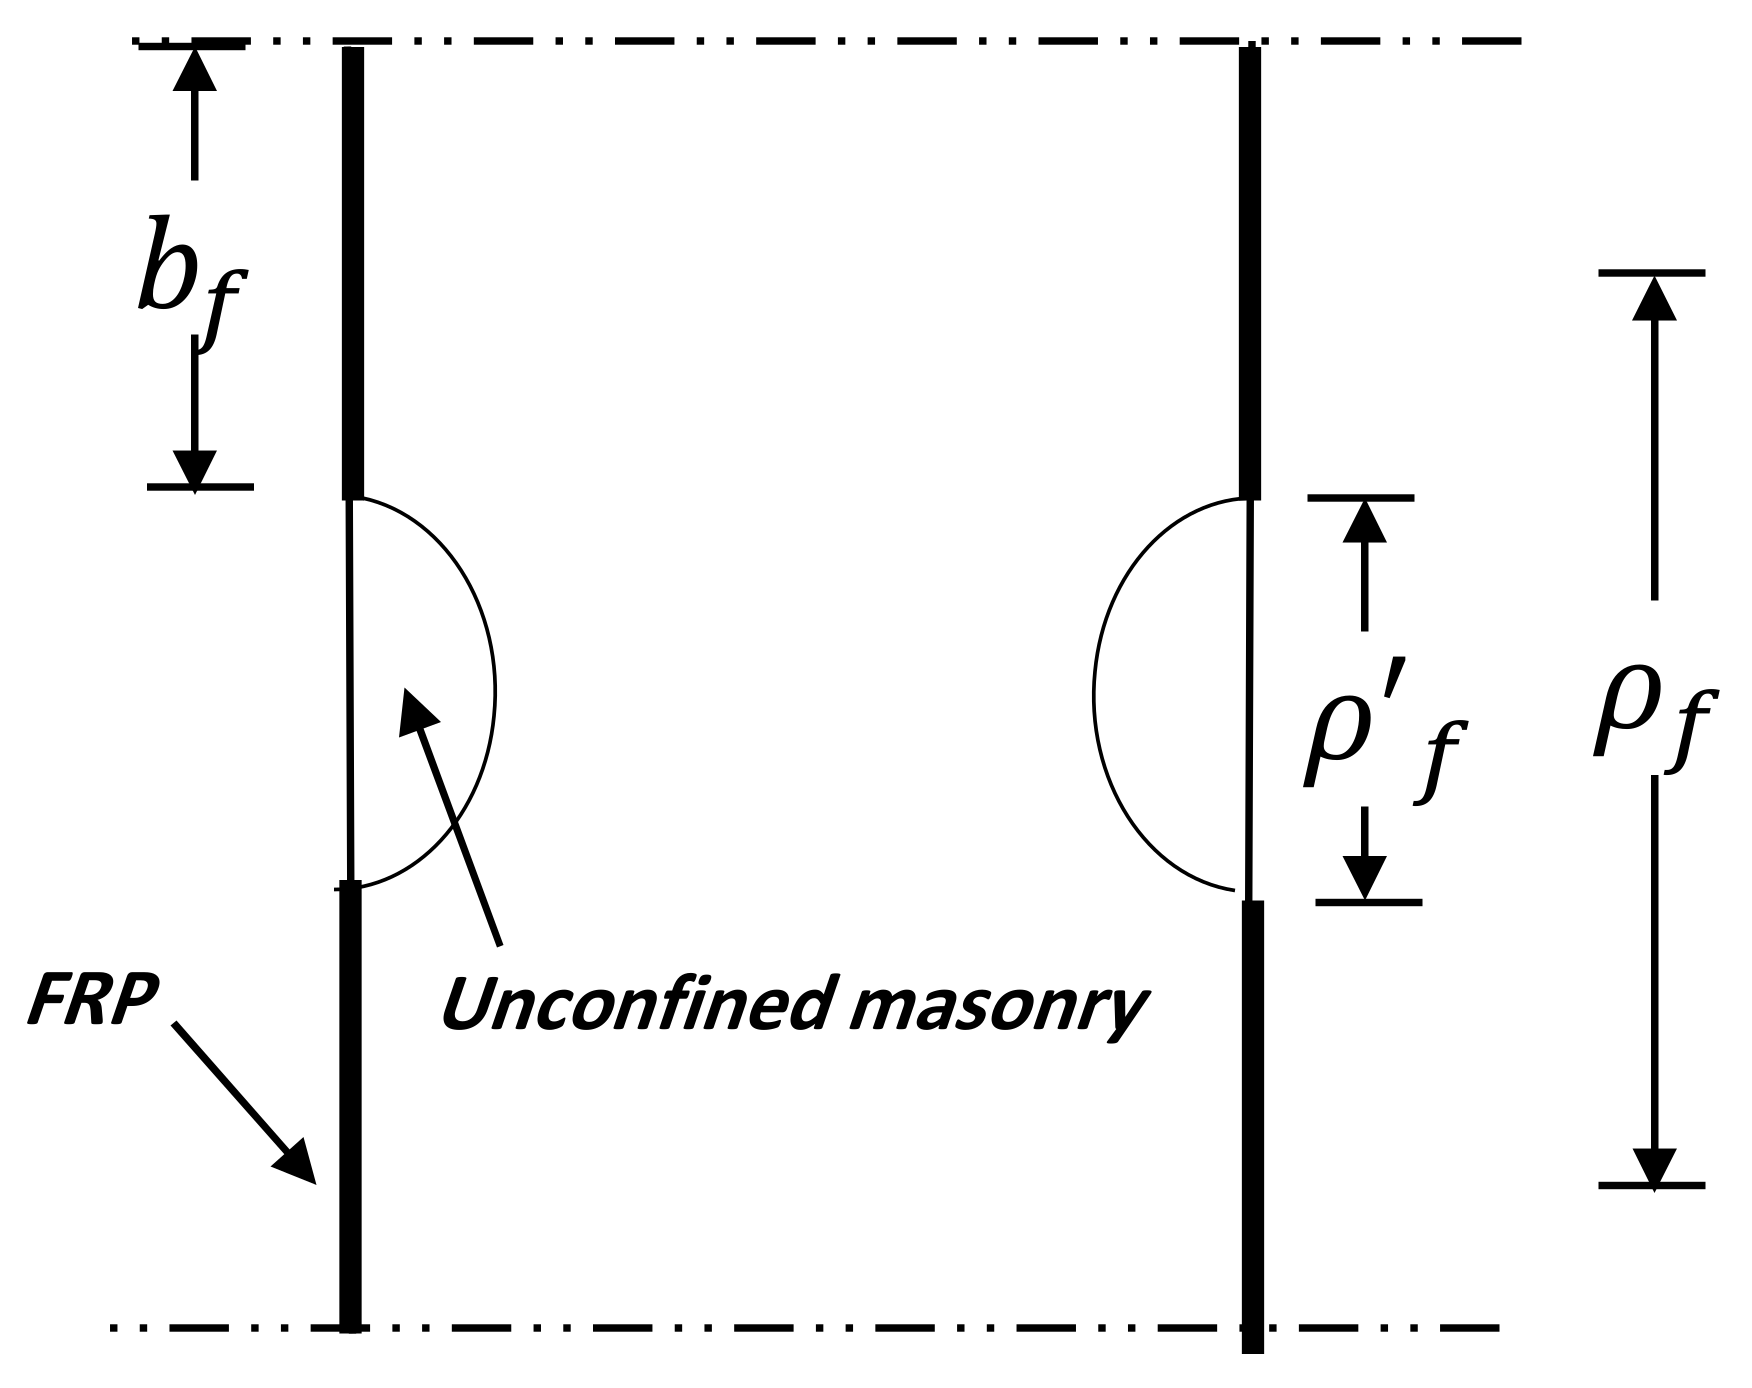
The and denote the tensile modulus of elasticity and thickness of the FRP jacket, respectively. The theoretical prediction is calculated using the nominal thickness of cured laminate. The cross-section dimensions are defined by the width and the thickness . is the width of FRP reinforcement, where is the center-to-center distance in the middle of two consecutive FRP U-wraps. The physical meaning of , , and are explained in Figure 1.
Because of a lacking sufficient information about the strain, the efficient factor is used to calculate the FRP strain’s reduced design value, and relate it with ultimate strain of FRP coupon testes. All discussed equations were reported by setting the strain efficiency factor to 1. This is needed in the expressions to calculate the lateral confining pressure .
The FRP strain’s reduced design value, , can be calculated by Equation (6).
where denotes the environmental conversion factor, and denote the ultimate characteristic strain and partial factors of FRP composite confinement system, respectively. The maximum permissible strain is 0.004 according to CNR-DT 200 R1 [35]. The environmental and safety coefficients and were assumed as 1.0. The maximum permissible strain was not imposed when calculating the value of to estimate the confining pressure in all theoretical prediction models.
The effectiveness of any composite’s confinement is determined by the shape of the column’s cross-section. Generally, the circular shape is the most effective cross-section for confining material. For rectangular cross sections, the confinement is partially effective along a portion of the section’s total periphery. As a result, the sharp edges of the section are rounded to a specified radius to increase the confinement’s effectiveness. The horizontal coefficient of efficiency, , is calculated by dividing the area of effectively confined masonry by the total area.
For rectangular sections reinforced continuously with FRP, due to the arch effect, the confined section of the masonry column comprises merely a segment of its total surface area. The extent of the confined area is dependent on the rounding radius used.
The efficiency coefficient of rectangular cross-section columns wrapped with external FRP materials is calculated as follows:
Here, and , is corner radius of the cross-section and denotes the area of masonry prism.
If the FRP strengthening system is non-continuous, the vertical coefficient of efficiency is calculated by Equation (6) and is equal to 1 for a continuous confinement.
It is worth mentioning that FRP-confined masonry columns failure is commonly caused by rupture of the outer jacket. Stress concentration at the cross-section corners is what causes prismatic columns to fail. Due to the arch effect, only a small portion of the masonry column’s surface area is well confined. The confined area’s size is determined by the rounding radius. To calculate confinement efficiency, it is commonly assumed that the column cross-section has parabolic branches. If the column is confined by a discontinuous confinement, achieved by wrapping spaced FRP sheets, then the column could fail before the rupture of FRP. The failure is the outcome of the crushing of a considerable quantity of masonry from the unwrapped areas. Establishing an appropriate spacing between the FRP strips is essential to ensure that the confinement efficiency.
Very few analytical models exist in literature to estimate the compressive strength of the FRP confined masonry. Twelve distinct approaches are considered to calculate the compressive strength: Krevaikas and Triantafillou [21], Corradi et al. [19], Di Ludovico et al. [20] for clay and tuff, Faella et al. [14] the simplest and accurate, CNR-DT 200 R1 [35], Rao and Pavan [36], Ramaglia et al. [22] for clay and tuff, and Napoli and Realfonzo [37] the simplest and accurate. Table 1 summarizes the analytical models described in the literature.
Models developed by Di Ludovico et al. [20] and Ramaglia et al. [22] are further differentiated in two model. The first one is calibrated for confined clay masonry and the second for confined tuff masonry. The models proposed by Faella et al. [14] and Napoli and Realfonzo [37] also stated two analytical models, one is defined as more accurate, while the second is defined as more straightforward. As mentioned, all models considered same framework except Krevaikas and Triantafillou [21] model which adopts a nonlinear relationship between the lateral confining pressure and the axial strength . However, Krevaikas and Triantafillou [21], Corradi et al. [19], Di Ludovico et al. [20] for clay Rao and Pavan [36], and Ramaglia et al. [22] for clay models have applicability for artificial masonry because models were mainly calibrated using a substantial number of experimental data pertaining to FRP-confined clay brick masonry columns. In contrast, Di Ludovico et al. [20] and Ramaglia et al. [22] for tuff is appropriate for natural stone masonry columns because it considered a few experimental results of FRP-confined tuff masonry. Lastly, the only analytical models of gaining strength applicable to both natural and artificial masonry are the models presented by Faella et al. [14] and Napoli and Realfonzo [37]. Additionally, merely these models estimate the effect of the mass density of masonry on the compressive strength.
3. Experimental Database
To ensure that the machine learning model has the best possible performance, a comprehensive database was used. This section includes a detailed description of the database, as well as an analysis of its input parameters.
3.1. Collected Database from Literature
Recently, Napoli and Realfonzo [37] reported a comprehensive database of axial compressive tests conducted on unconfined and FRP-confined square/rectangular masonry prisms. The experimental database contains 286 specimens, of which 88 were unconfined and 198 were variable confined with basalt, carbon, glass, or steel FRP layers.
Approximately 76% of columns in the database were prismatic and made of artificial clay brick, of which 54% were variably confined with FRP systems and 22% were unconfined. Twenty-four percent of the remaining prismatic masonry consisted of natural blocks, of which 15 percent were FRP confined, and 9 percent were unconfined. The majority of natural blocks consisted of tuff masonry, after that a considerable quantity of calcareous stone and a few sandstones.
The majority of masonry specimens were constructed with a uniform arrangement of bricks. Nine percent of columns were constructed as hollow columns or cavity-filled hollow columns with a mixture of mortar and stone wastes.
Napoli and Realfonzo [37] provided the essential data on 198 specimens subjected to axial compression tests and FRP confined. Details include the type and composition of the masonry, as well as arrangement of the masonry units and the mass density. When mass density is not specified in scientific literature, the typical range of is reported.
The information comprise and as width and depth of the cross section, respectively, is the column height; is the prismatic column corner radius; is the per cubic meter weight of the FRP sheet; , and are the mechanical properties of FRP wraps, elastic modulus, ultimate tensile strength, and ultimate strain, respectively. is the single layer thickness of the FRP sheet; is the number of FRP layers; , and are the width of the FRP strip, the clear spacing between two consecutive strips and the center-to-center distance, respectively, used for FRP discontinuous confinement; is the length of overlapping for the FRP strips; is the unconfined masonry compressive strength; and are corresponding coefficient of horizontal and vertical efficiency as per the guideline CNR-DT 200 R1 [35]; is the effective ultimate lateral confining pressure of FRP wrap normalized by unconfined masonry compressive strength; is the compressive strength of the FRP confined masonry; is FRP strain efficiency factor which is basically the ratio between the experimental ultimate hoop strain in the FRP wraps () and the ultimate strain from fiber coupon tensile tests (). The values of were calculated according to CNR-DT 200 R1 [35]. The ≤ 1 is the parameter relying on the shape of the section and the type of FRP wrapping (continuous or discontinuous), estimated through the coefficients and . These parameters as well as the effective lateral confining pressure are characterized by the correlations discussed in Section 2 for square/rectangular columns. More details about specimen preparation, conditioning of the tests and strength measurements can be found in Napoli and Realfonzo [37] and relative references.
3.2. Processed Database
Due to the importance of experimental uniaxial compression tests carried out on unconfined and FRP-confined square/rectangular masonry elements reported in the literature, this study uses existing studies to establish input parameters.
For successful a machine learning model, the database is reorganized, by removing and adding parameters and calculated values. In particular, the ratio of highest side over the shortest of cross-section () was introduced to consider the shape of confined cross-section. To consider the effect of the slenderness of columns, the ratio between cross-section thickness and height of the column () was calculated, where is always the longest side of the cross section. The layer thickness of the fiber sheet is recalculated by considering the number of FRP layers.
Researchers selected the following inputs based on literature and their judgment: masonry mass (), specimen size (, , , ), mechanical properties of the strengthening wraps (, , ), compressive strength of the unconfined masonry (), parameters related to the effective ultimate lateral confining pressure (, , ). The output parameter is the axial compressive strength of the masonry confined by FRP ().
Some data points have been removed or changed in the database. Eleven samples tested by Rao and Pavan [36] were removed because of missing essential data about mechanical properties of the FRP wraps. Four sample from Corradi et al. [19] were missing the value of . Zero corner radius is assumed. When the mass density of masonry is not reported in the literature papers, an average typical range of values is assumed. The final table of database contains 16 columns and 117 rows. Table 2 summarizes all the ranges of variation of the main parameters in the reorganized database.
According to Table 2, the side ratio of the cross-section, for all FRP systems varies between 1 (square columns) and 2 for prismatic specimens. The size of the columns as the ratio was never greater than 0.85. The sheets of fiber used to wrap columns were unidirectional. The mechanical properties of the fiber sheets differed within the expected range. The number of FRP layers varied between 1 and 5 at all times. The investigated compressive strength values of unconfined columns, were distributed over 2–14.33 MPa range. The compressive strength values of the confined columns, were dispersed maintaining the range as approximately 2.79 to 44.87 MPa.
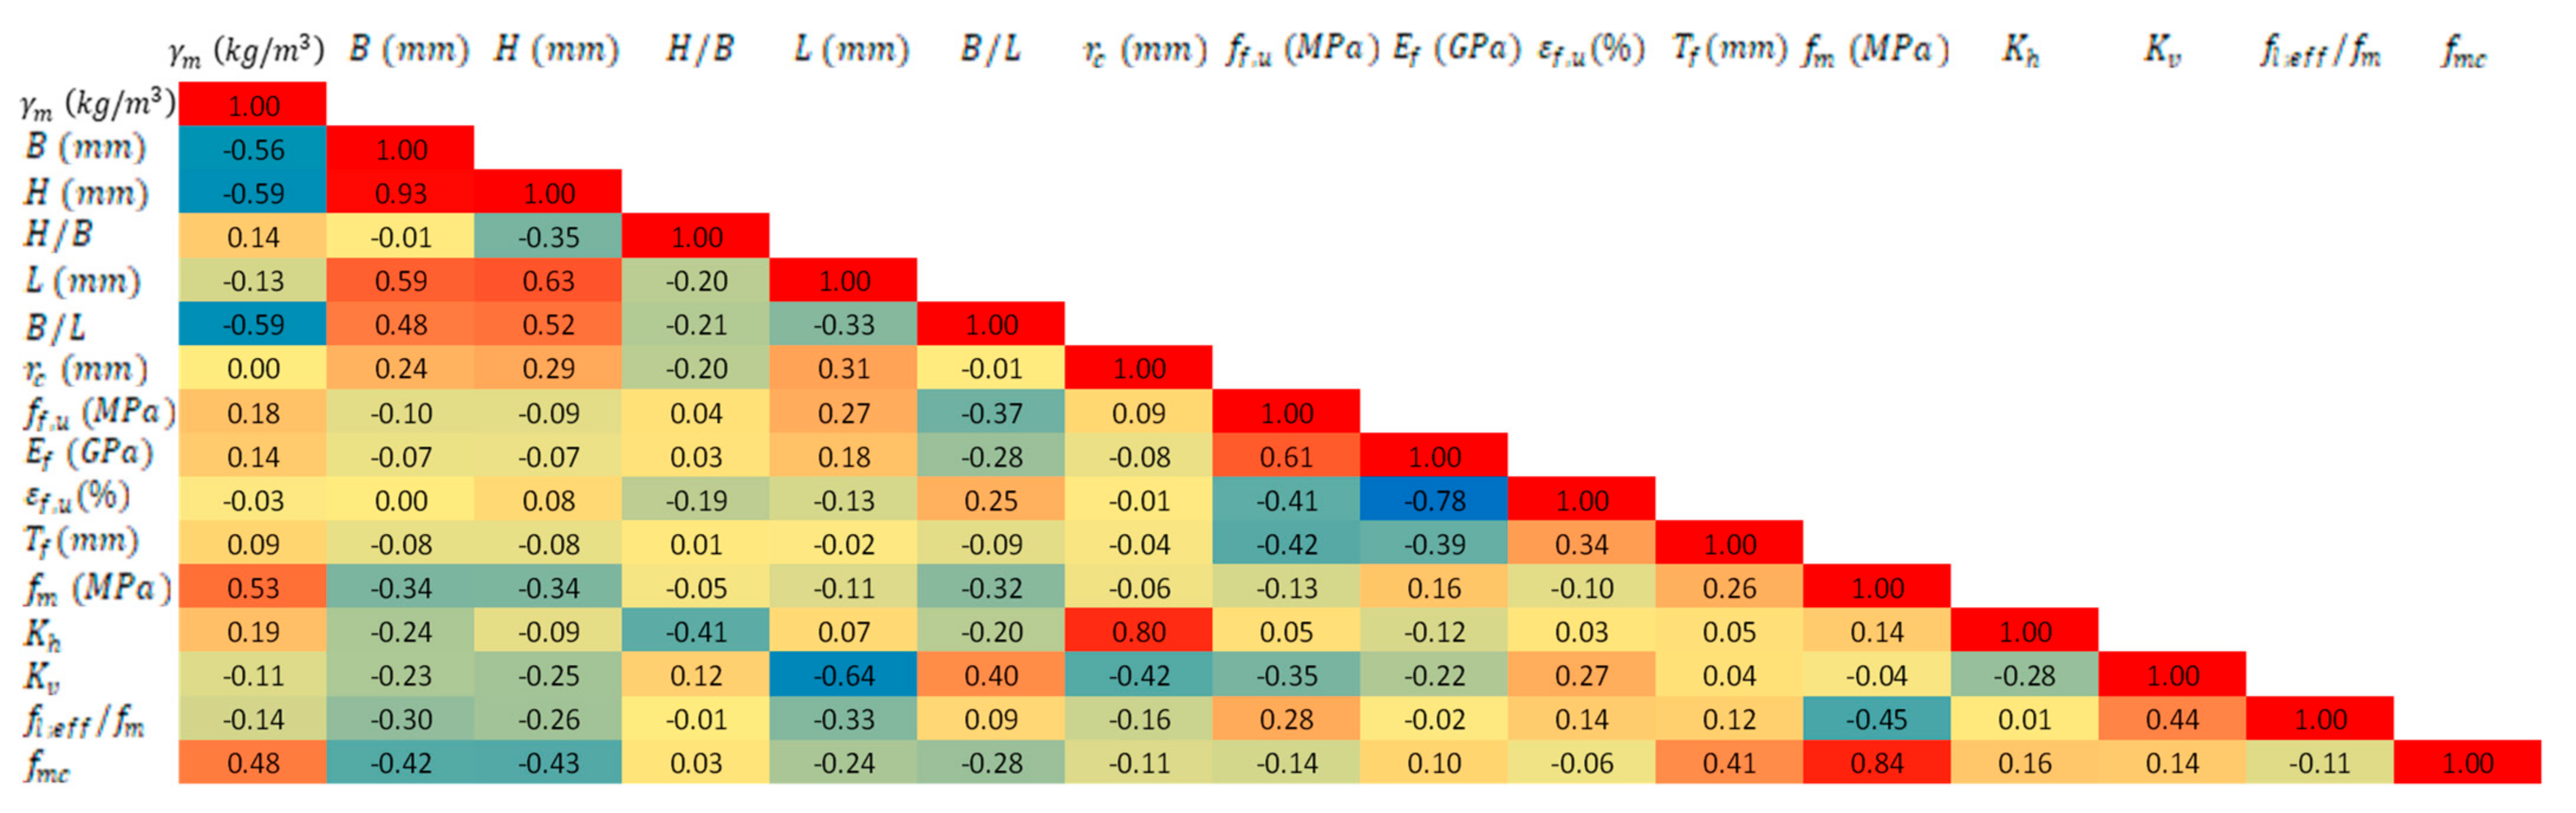
In order to extract more information regarding the mutual relationship between all input and output features in the dataset, the correlations between features are analyzed. This statistical measure is useful because it describes the relationship between two or more characteristics. In practice, the findings of this analysis will ultimately lead to the selection of the predictive model to be employed in order to maximize the accuracy of predictions. Among the methods available in the literature, Pearson’s method will be used to calculate the correlation coefficient:
with as the experimental values, the regression values, and is the average of the simulation values. Where and are two features while overhead bar and subscript signify the average value and the observation, respectively. The expression in Equation (9) guarantees that the coefficient is between −1 and 1. The value 0 indicates that there is no correlation between a specific pair of features, whereas a value of 1 indicates a perfect positive and −1 indicates negative correlation relationship. This indicates that an increase in one quantity causes an increase (if 1) or a decrease (if −1) in the other quantity. The relationship between a quantity and itself, where the correlation coefficient is always 1, is a clear instance of a perfect positive correlation. In contrast, the correlation becomes weaker as the value approaches 0. In Pearson correlation, if two characteristics are independent, the magnitude of the coefficient is close to zero.
Figure 2 shows color map correlation matrix of the dataset features with correlation coefficient. It is revealed that the correlation between unconfined masonry strength and unconfined masonry strength is reasonably strong with the coefficient of 0.84. This behavior is expected.
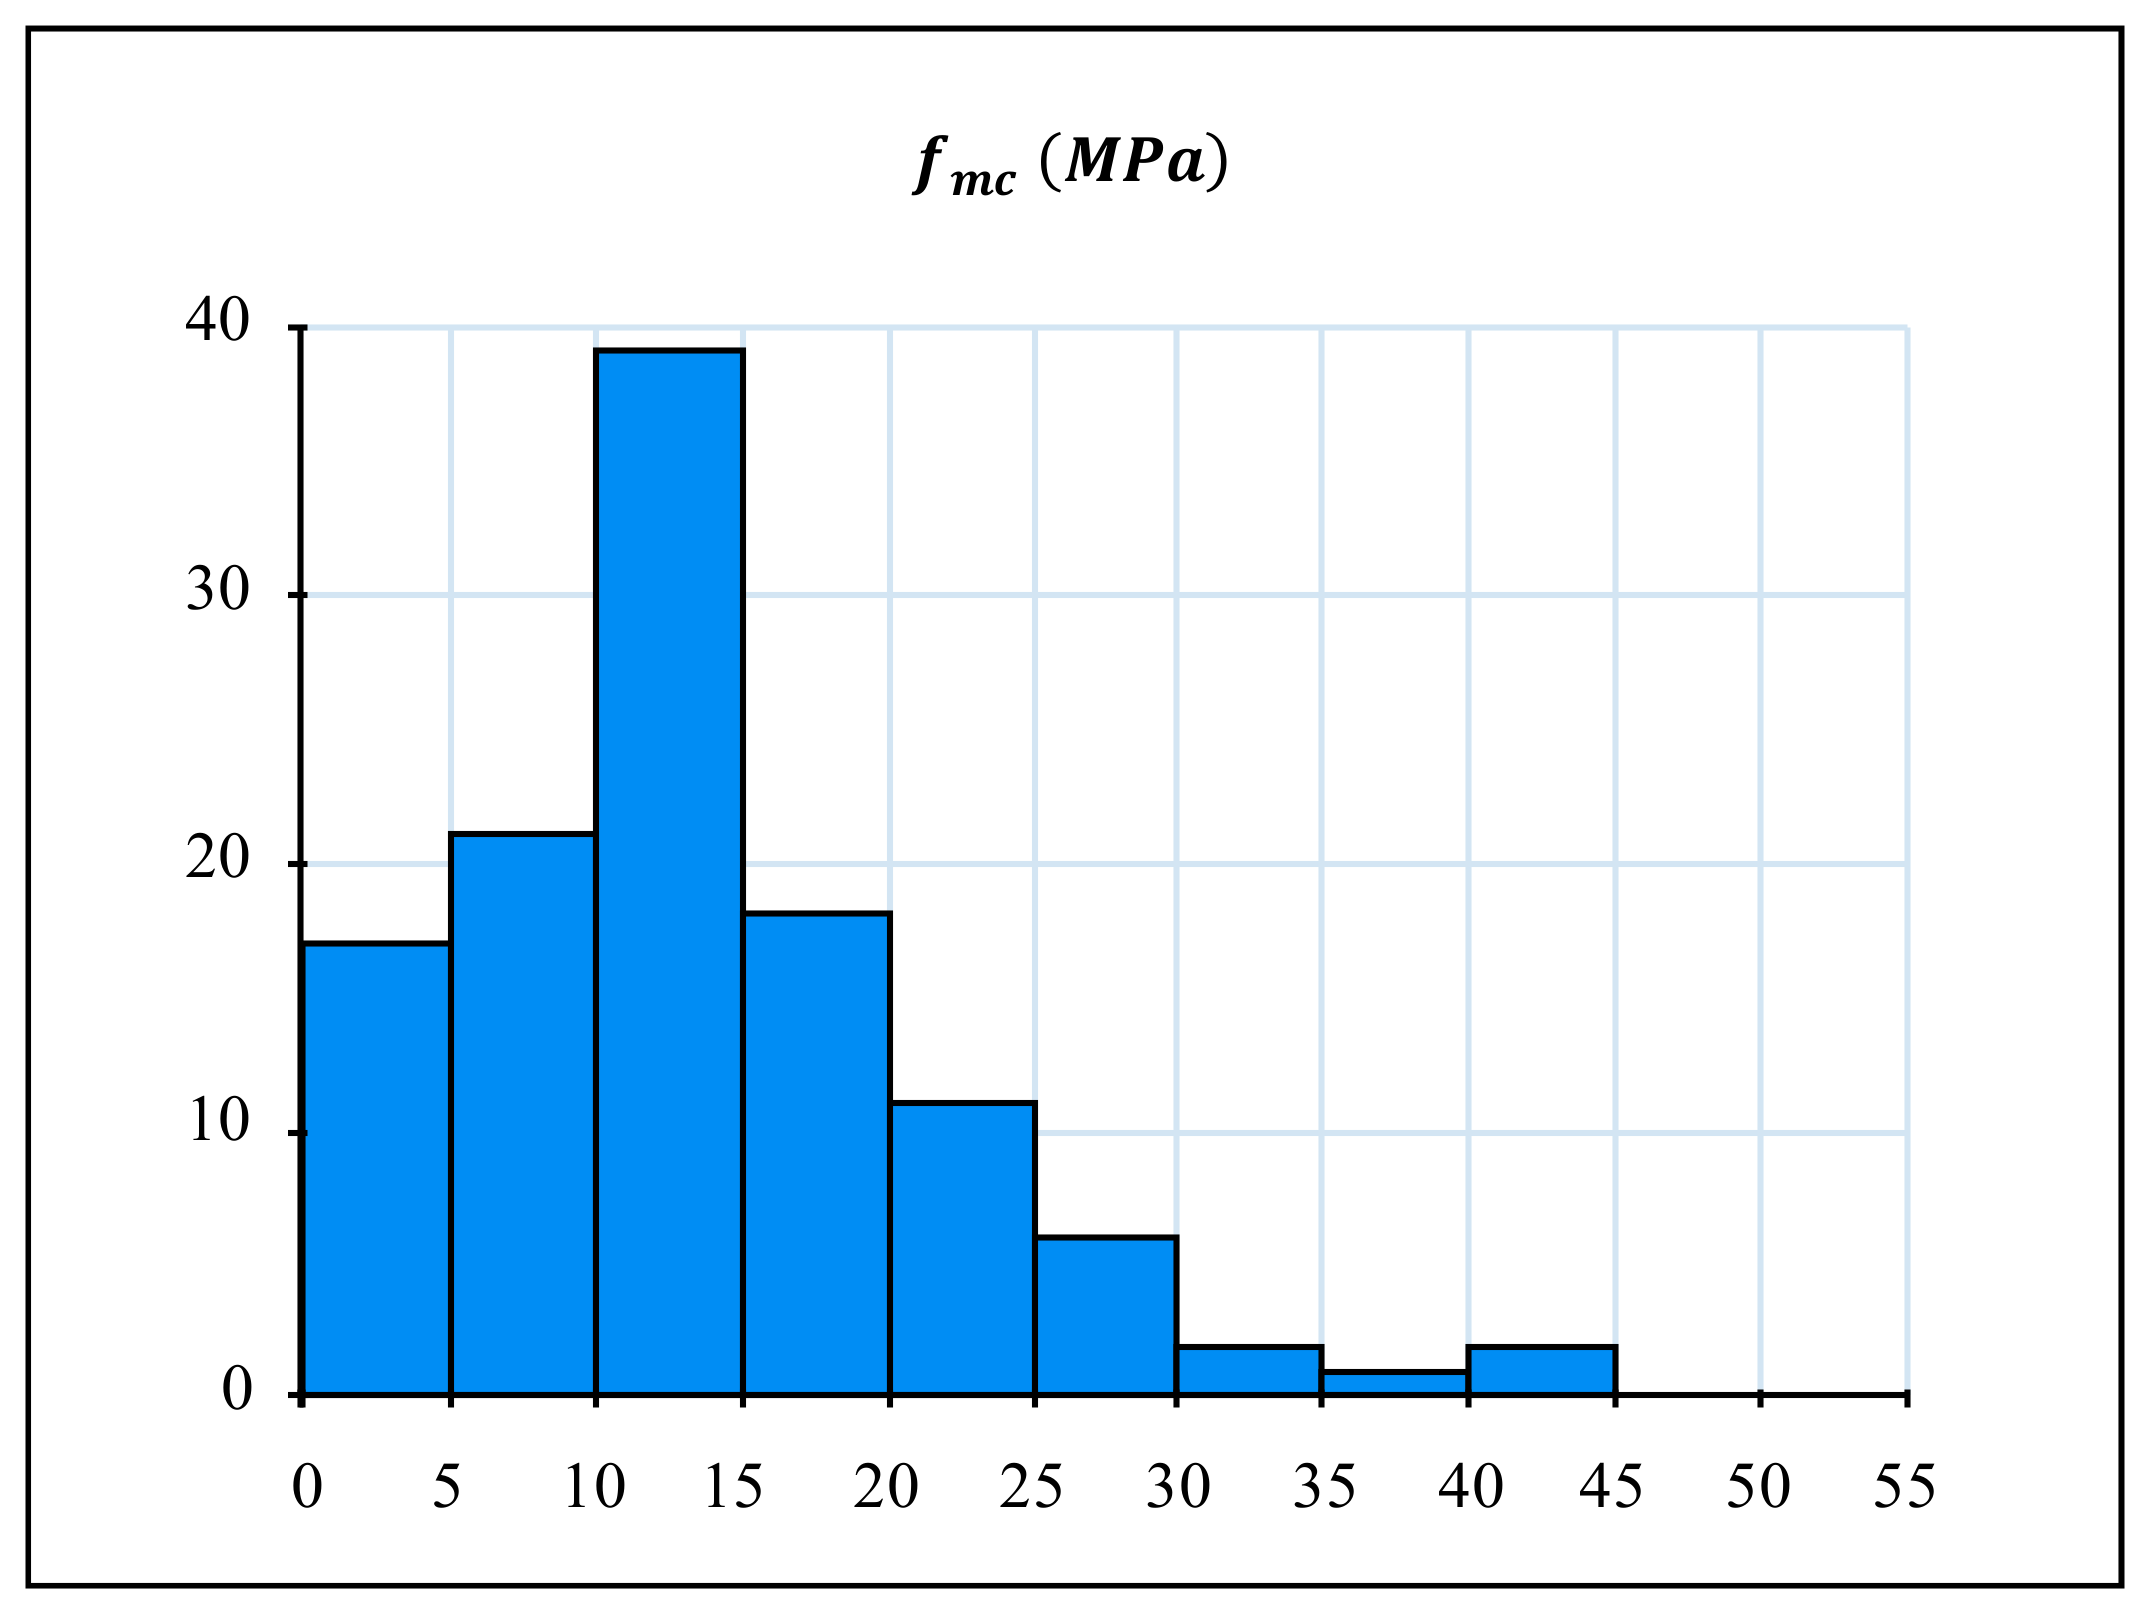
In the recognized database, Figure 3 illustrates the distribution of the targeted parameter which the confined compressive strength of masonry .
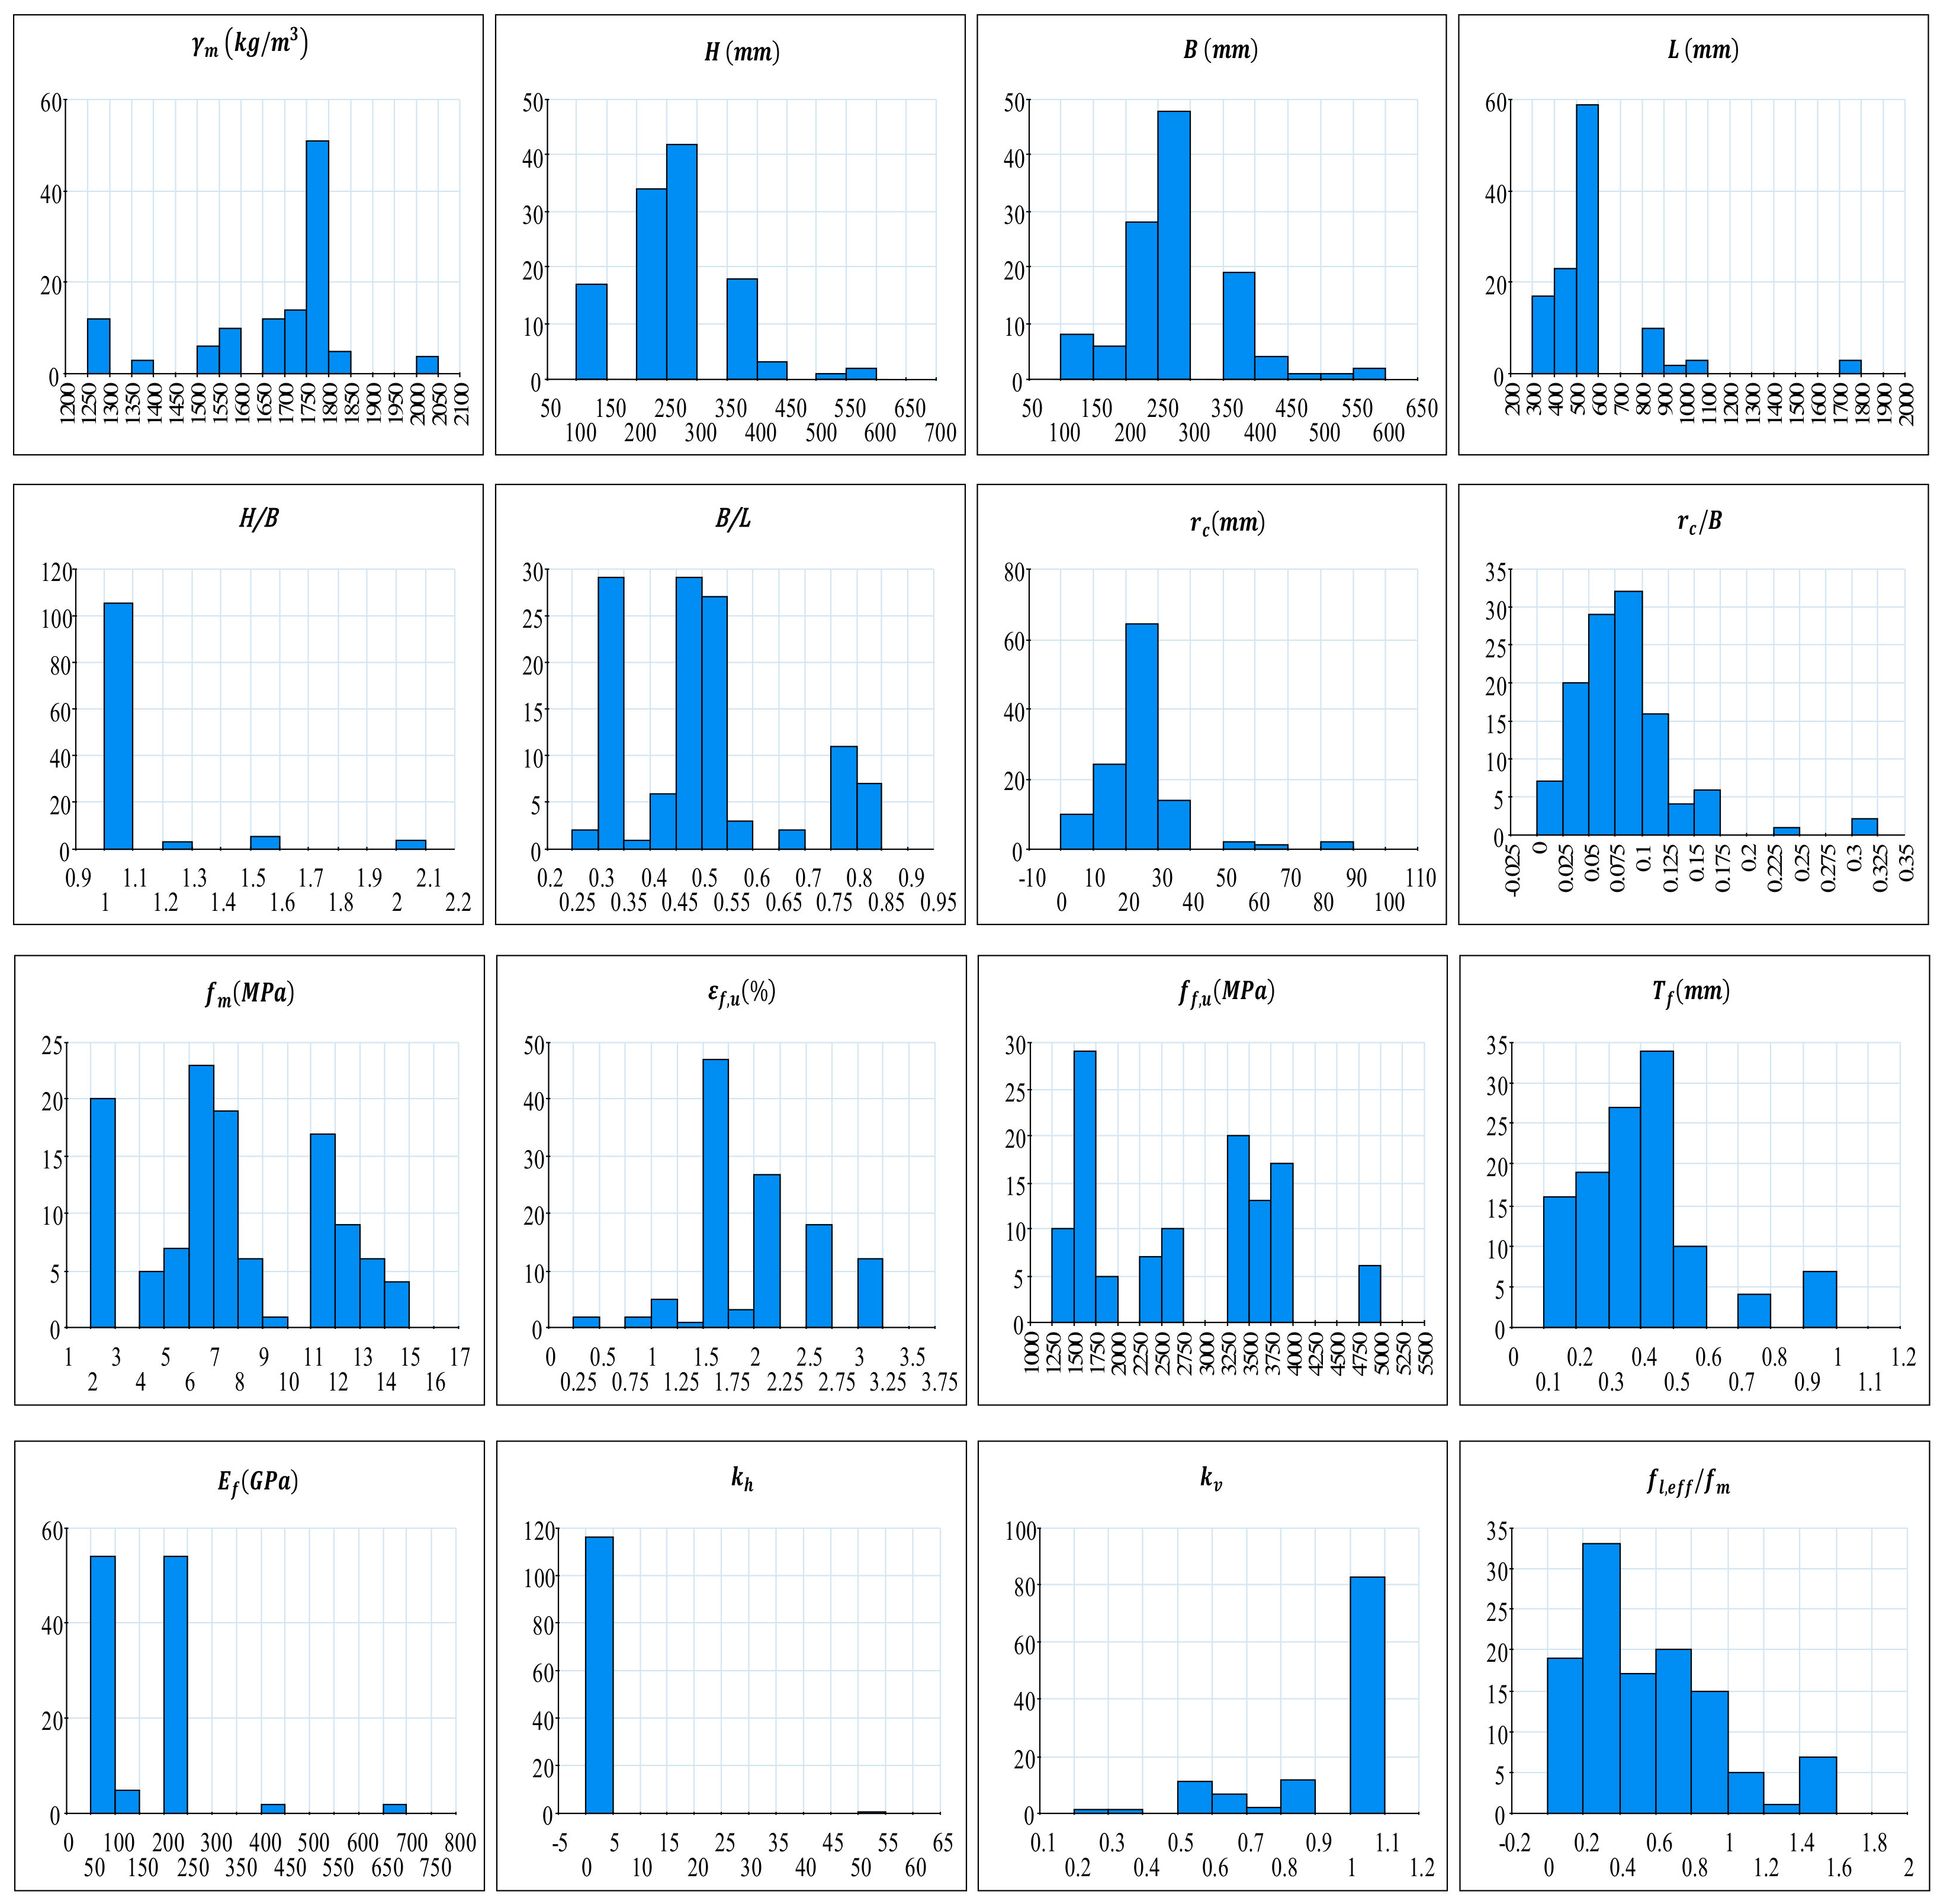
Figure 4 illustrates the distribution of the selected design parameters.
4. Symbolic Regression Model
Symbolic regression (SR) is a statistical approach that can detect multivariate, nonlinear relationships between variables in sets of data. It generates a closed-form equation that represents a functional mapping of correlations that enables the prediction of the value of a chosen target variable based on the values of other variables. SR is especially interesting since it uses mathematical functions and operations such as addition, subtraction, multiplication, division, logarithm, and exponential functions to build an equation that represents the correlation between the input and target variables. Symbolic Regression is distinguished from conventional regression techniques where in traditional regression, the structure of the equation should be defined and stay fixed during the regression. However, SR can detect a suitable equation structure and optimizes numerical constants simultaneously. In general, SR does not require prior knowledge of model structure or function [38]. The approach is comparatively simple for use by non-experts in computer-based methods. Additionally, the identified formula can be merely transferred and implemented in other software systems. John Koza [39] popularized the genetic programming (GP) which developed as an evolutionary algorithm that searches for programs that solve a given problem without explicitly programming as a symbolic regression. Darwin’s Theory of Evolution inspired the description of GP as an evolutionary method for automatic programming. Simulating natural selection, a population of individuals, in the case of symbolic regression as mathematical functions and operations, is selected. By continually picking individuals with high quality and recombining them to minimize the error in the optimized target. GP is a simplification of genetic algorithms [40] and, when executed, develops problem-solving procedures. GP, unlike genetic algorithms, permits variable-length programming such as symbolic expression trees.
SR, which is a simpler task for GP than full-fledged automatic programming, can identify only a single expression. Consequently, mathematical operators and functions are typically permitted for internal nodes in symbolic expression trees. The collection of final symbols includes some parameters of training dataset as well as constants. Consequently, when SR is performed using GP, the resulting program is a closed-form mathematical expression representing a statistical model.
GP uses the iterative process to evolve symbolic regression models. An initial population is formed by generating and evaluating a set of random expressions. Expressions with a greater capacity to accurately predict the target variable are deemed to be more suitable. Through executing the GP as cycle, new expressions are generated by frequently selecting and recombined old expressions undergoing random mutations. High ranking expressions have a superior likelihood of being selected and may be selected several times. The newly generated expressions are assessed and merged with the existing population to create a new population of expressions. Poorest fit expressions are eliminated in this step. The process typically ends when the stopping criterion is met which is usually reaching the ultimate number of generations. SR employing GP is compatible with sets of data containing millions of observations and dozens of variables.
In the present work, HeuristicLab [41], an open-source software that provides a module for SR and is employed in C# on top of the .NET Framework, is utilized in this study. Multiple advanced features, including tree structure constraints based on grammar rules, factor variables, and automatic differentiation for memetic gradient-based optimization of numeric parameters, are supported by the software.
For the experiments presented, the following parameters were set population size = 1000, mutation probability = 15%, maximum tree depth = 10, and maximum tree length = 25. The collection of function symbols is (addition, subtraction, multiplication, division). As terminal symbols, numeric constants and variables from the dataset were permitted. All input variables were considered in the reorganized database. As the target variable, the compressive strength of the FRP confined masonry () was chosen. A total of 50% of the data was utilized for training and the remaining data were utilized for testing. Each trial’s data was allocated to either the training set or the test set, ensuring that no test-trial data points were observed during training. The results were achieved after 5000 generations. Symbolic regression is a stochastic technique that yields unique results for each run, despite identical inputs and settings. Thus, multiple repetitions of training were performed with the same settings to select the optimal model.
5. Results and Discussion
Genetic programming-based symbolic regression typically has no model restrictions. However, the desired model should be as clear and precise as possible. Therefore, it is desirable to restrict the size and complexity of the model. The model’s tree length was limited to a maximum of 25. The functional set of mathematical operations consisted solely of mathematical basics (addition, subtraction, multiplication, division). In addition, fewer influencing variables and constants are desirable. The arguments of the function set were further restricted to only variables and constants.
Using the method outlined in Section 4, the symbolic regression algorithm derived a complex mathematical expression from the training and test matrix data. The procedure’s outcome is depicted in Section 5.1. The model is then manually simplified by iteratively fitting parameters and removing parts from the model that contribute little to the quality of the prediction using the procedure outlined in Section 5.2 to arrive at the final expression.
The optimization of model was according to the coefficient of determination (). The coefficient of determination is in the range of 0 and 1. The value = 0 indicates that the regression model does not fit the simulation data at all. In contrast, = 1 means the regression model is fitting the simulation data perfectly.
5.1. Complex Symbolic Regression Modelling
This section describes the results of black-box modeling using symbolic regression and genetic programming. Symbolic regression modeling was achieved by employing freely evolving trees that incorporate no prior physical knowledge. The only limitations here are the maximum length and depth of the tree, as previously described.
After 5000 iterations of symbolic regression modeling, the equations discovered in each iteration are quite random combinations of process variables and are rarely repeatable. There were no similarities between the results of each run. The following is a report on the best quality symbolic regression model discovered in 5000 runs based on the coefficient of determination value over training date.
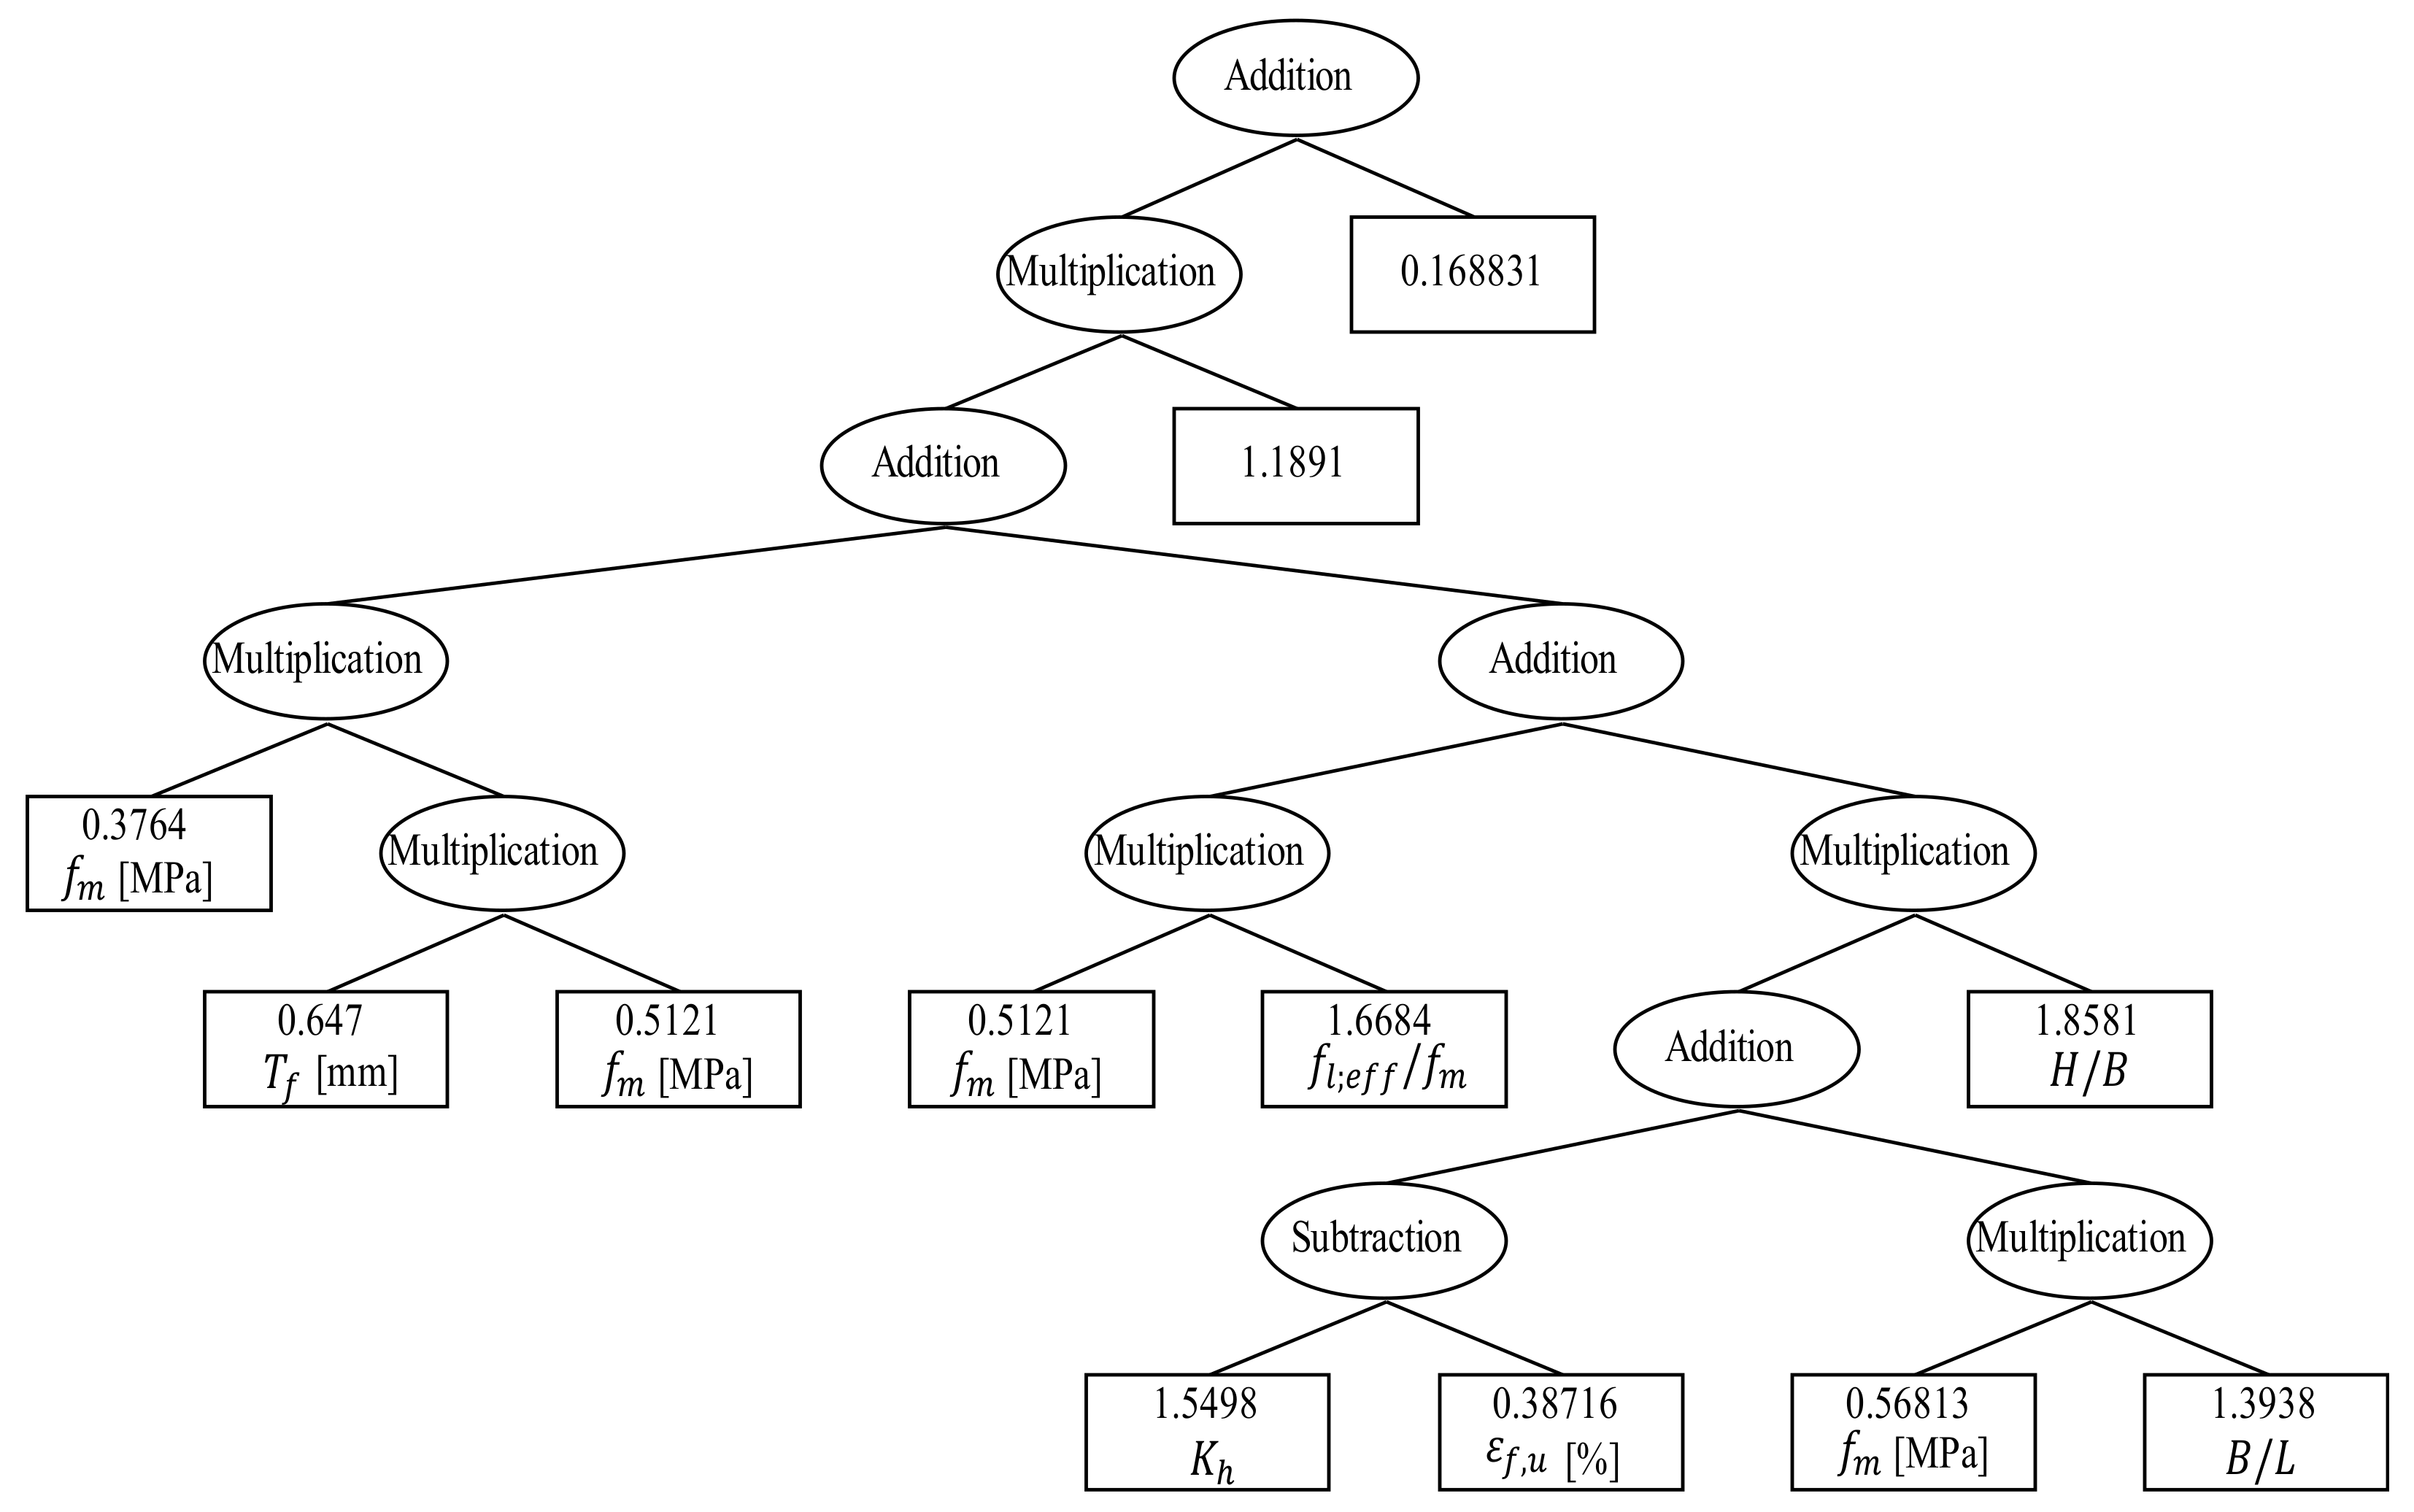
In Figure 5, the best prediction symbolic regression model tree is reported. The model is with 23 lengths and 8 depths. Only 7 input variables out of 15 were considered in best quality symbolic regression model. The variables and their impacts are reported in Table 3. Addition, subtraction, and multiplication are the only mathematical operations that were used.
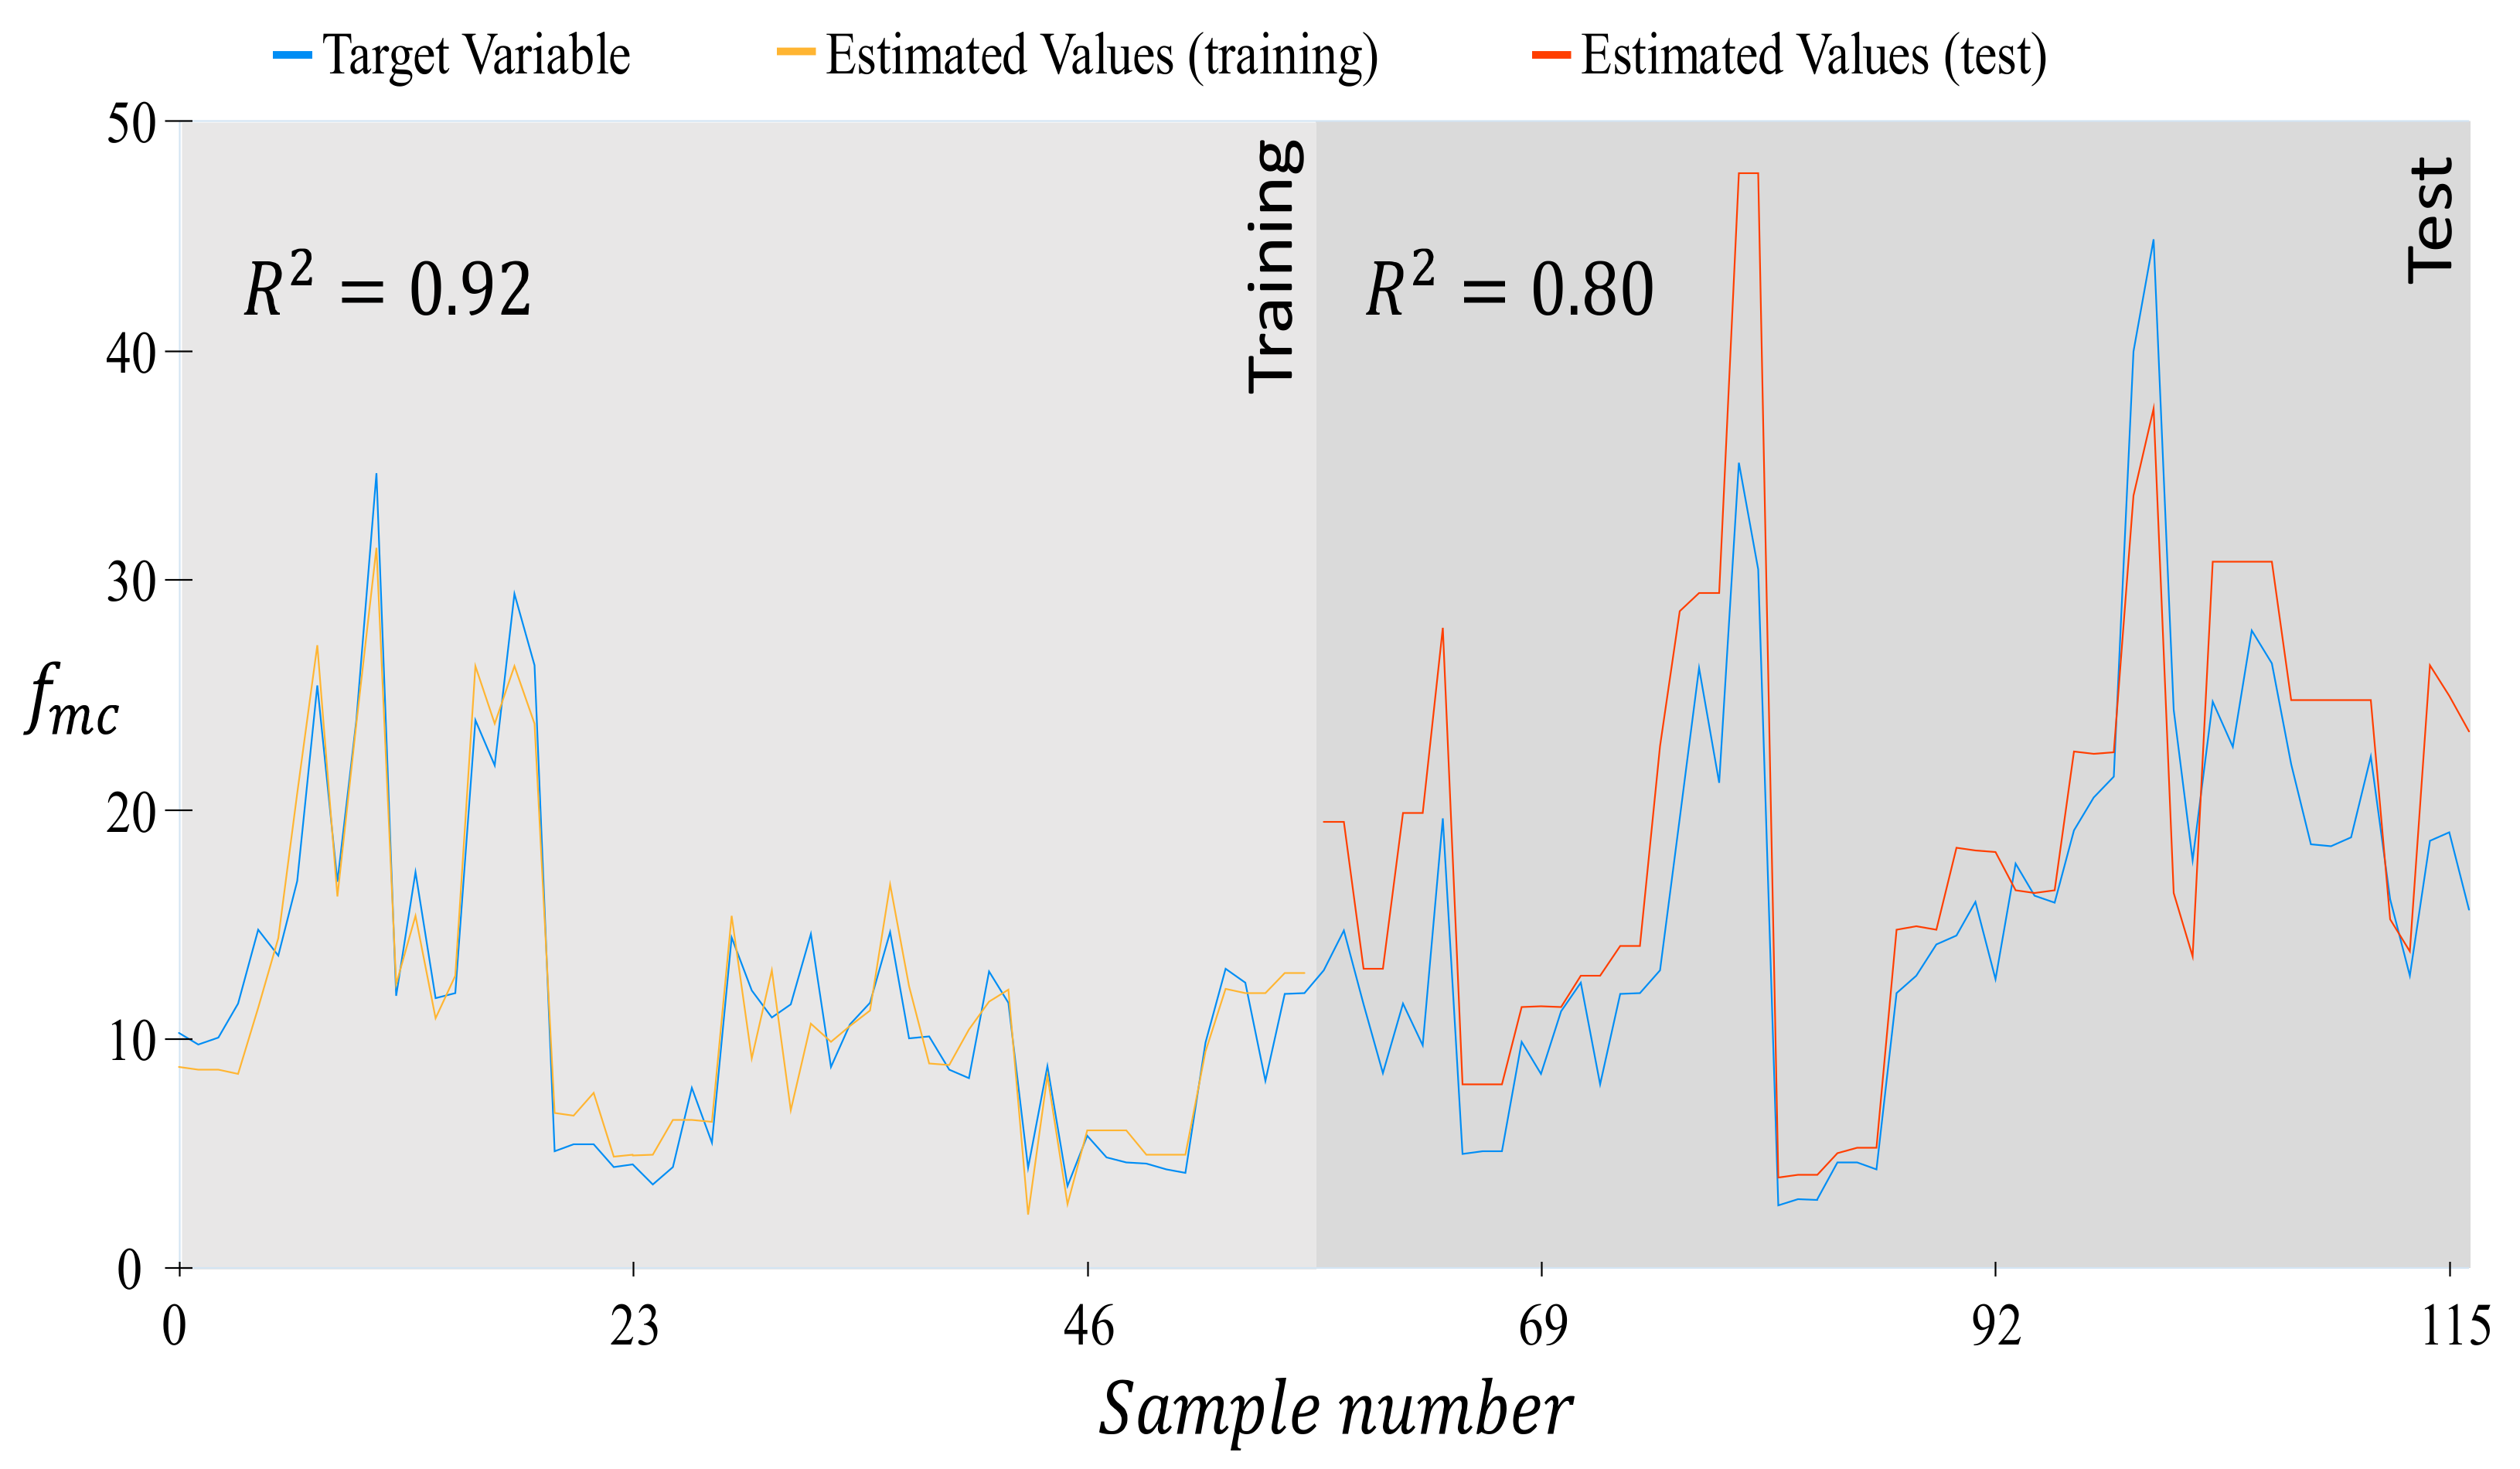
The prediction quality of the symbolic regression-based black-box model for estimating the compressive strength of FRP-confined masonry is depicted in Figure 6. In the left panel, the value of the prediction model on training data is plotted. The right panel illustrates the prediction value of the model on hidden test data. The high coefficient of determination for the model on training data is reasonable and the predictive capability of the model is quite satisfactory on test data.
Statistical indictors for both training and test data are presented in Table 4. An error analysis is carried out to evaluate the model quality. The coefficient of determination Equation (10), average relative error Equation (11), the mean absolute error Equation (12), mean squared error Equation (13), and root mean squared error Equation (14) are derived as follows:
Even though the model prediction quality in unseen data can be considered good, the training data showed better performance. MAE and MSE for training are 1.51 MPa and 3.48 MPa. Compared to test data, the error was 4.27 for MAE and 30.31 for MSE, correspondingly. It is observed that the error in training data is much lower RMSE than unseen test data.
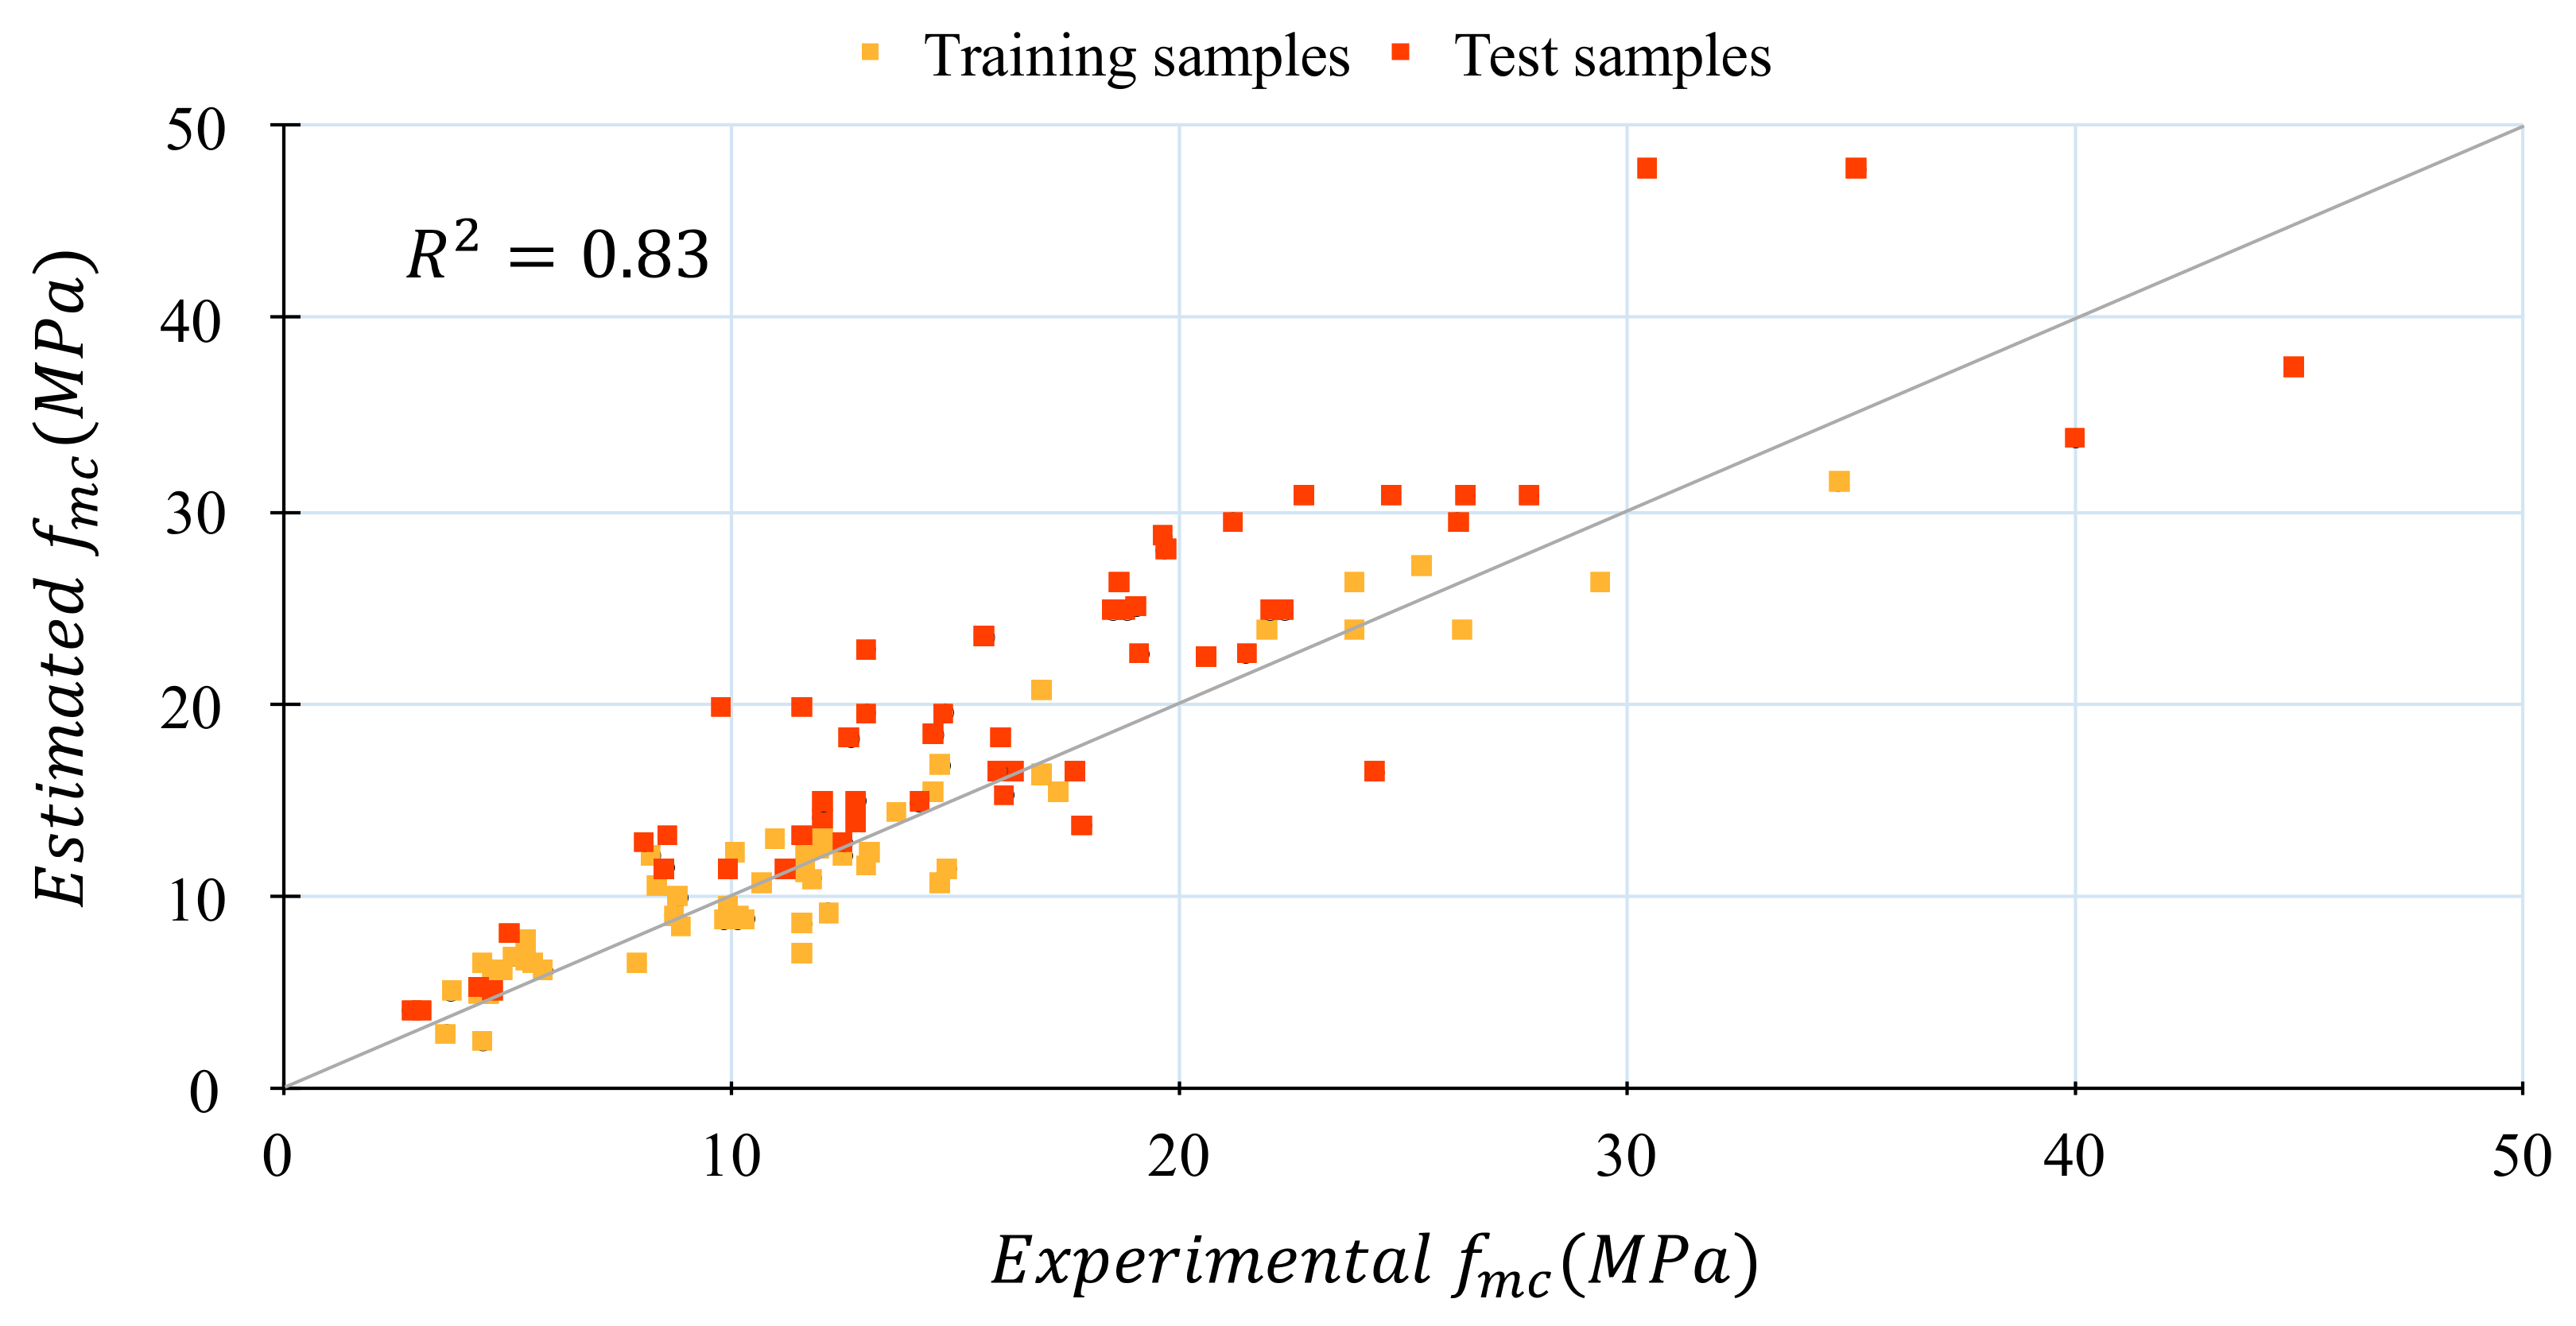
The coefficient of determination for the whole dataset is determined as 0.83 which implies that the symbolic regression model was performing well. Figure 7 illustrates the difference between the predicted results of the complex symbolic regression model and experimental data. It can be found that the results obtained from the complex symbolic regression model were well matched with experiments for both training and test data. Generally, the higher value of indicates a good performance of the model.
5.2. Simplified Model
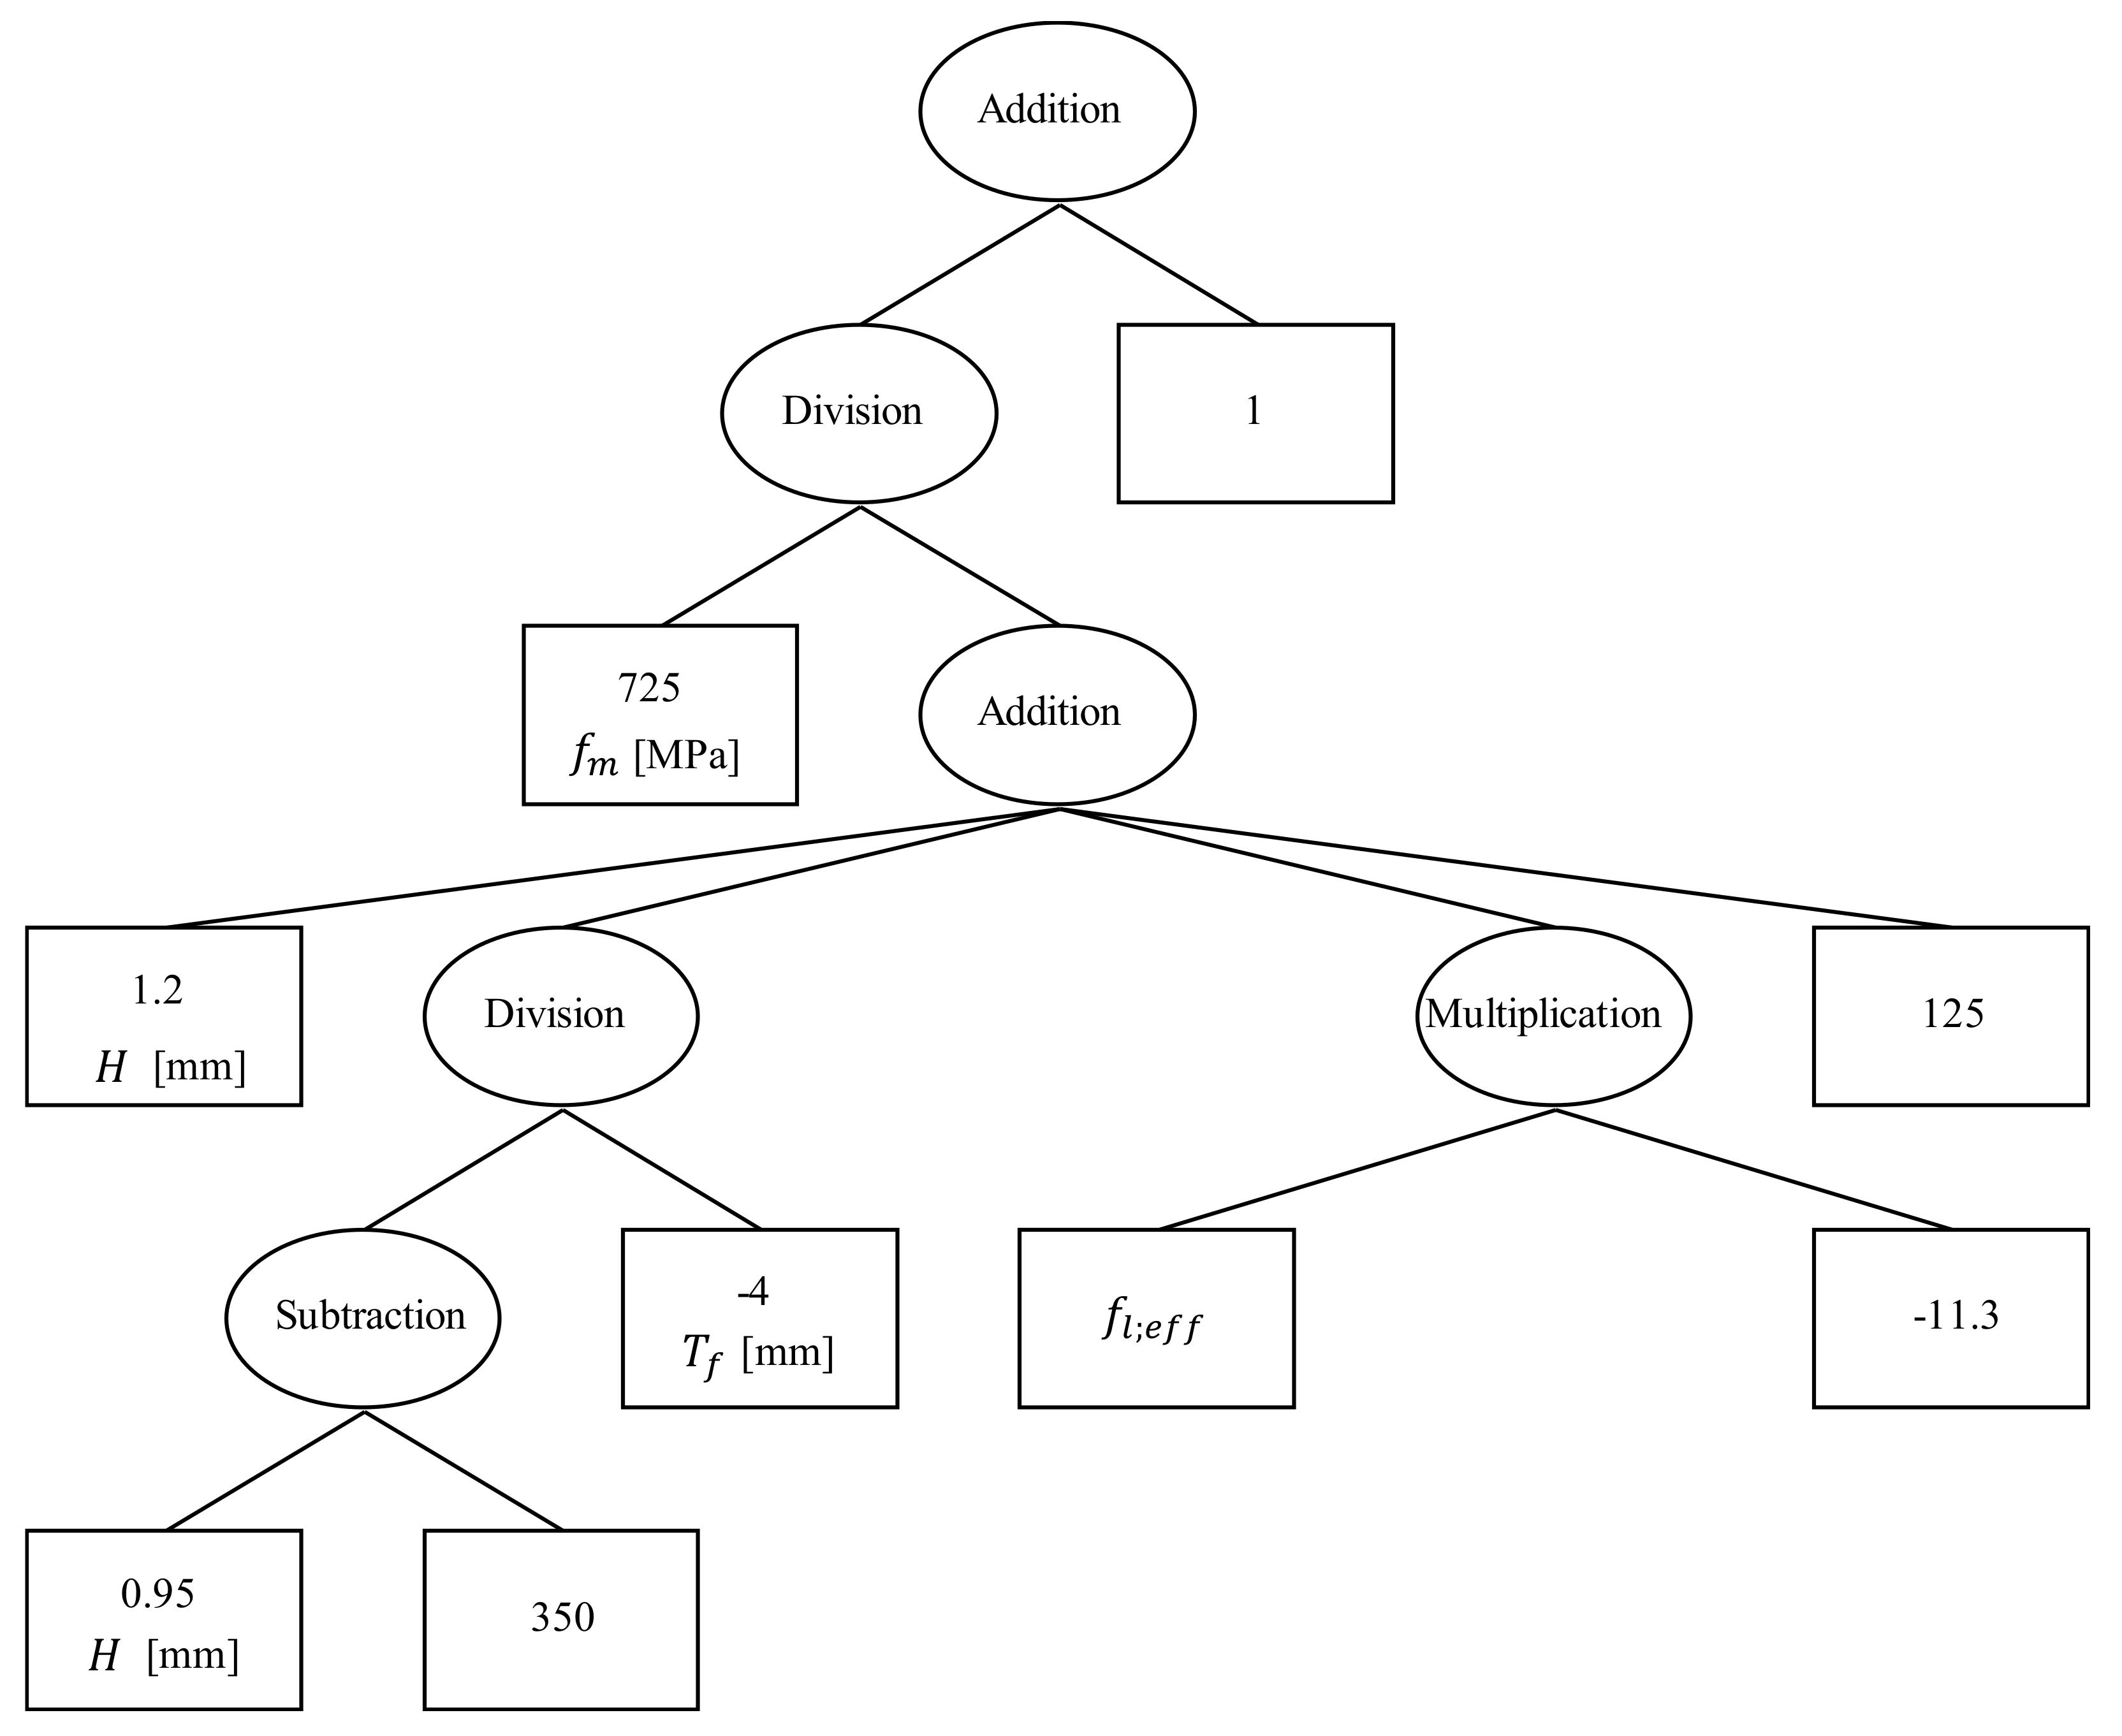
The algorithm for symbolic regression yields a model with low absolute and mean square errors, but it is quite complex. The model contains seven parameters which is summarized in Figure 5. MAE and RMSE for training are 1.51 MPa and 1.87 MPa. Therefore, additional training and manually simplifying the model resulted in a simplified version of the complex symbolic regression model reported in Section 5.1 and Figure 5, wherein whole data was used in training to fit the model’s parameters and manually simplifying the model by removing model components with a small impact on the estimation quality of the dataset. This procedure yielded straightforward mathematical expressions. Figure 8 illustrates the simplified symbolic regression model tree. The model has a length of 15 and a depth of 6. Only four of the fifteen input variables were considered in the simple mathematical expression. In terms of the number of inputs, it can be considered a reasonably simple symbolic expression, when compared to the complex symbolic regression model, which is very large and is primarily influenced by a greater number of inputs. The variables and their impacts are reported in Table 5.
Typically, tree-based genetic programming is utilized, and Figure 8 depicts the simplified symbolic regression solution as a symbolic expression tree. Symbolic regression based on genetic programming is well-suited to regression problems for two reasons: first, the underlying model structure is unknown, and second, the result is a mathematical expression that can be easily manipulated and implemented in screw-calculation programs:
As demonstrated by Equation (15), the mathematical expressions are quite straightforward, and empirical correction factors are always approximated accurately. As expected, changing some part of the symbolic expression tree would have effects of the performance of the model and its statistical indictors.
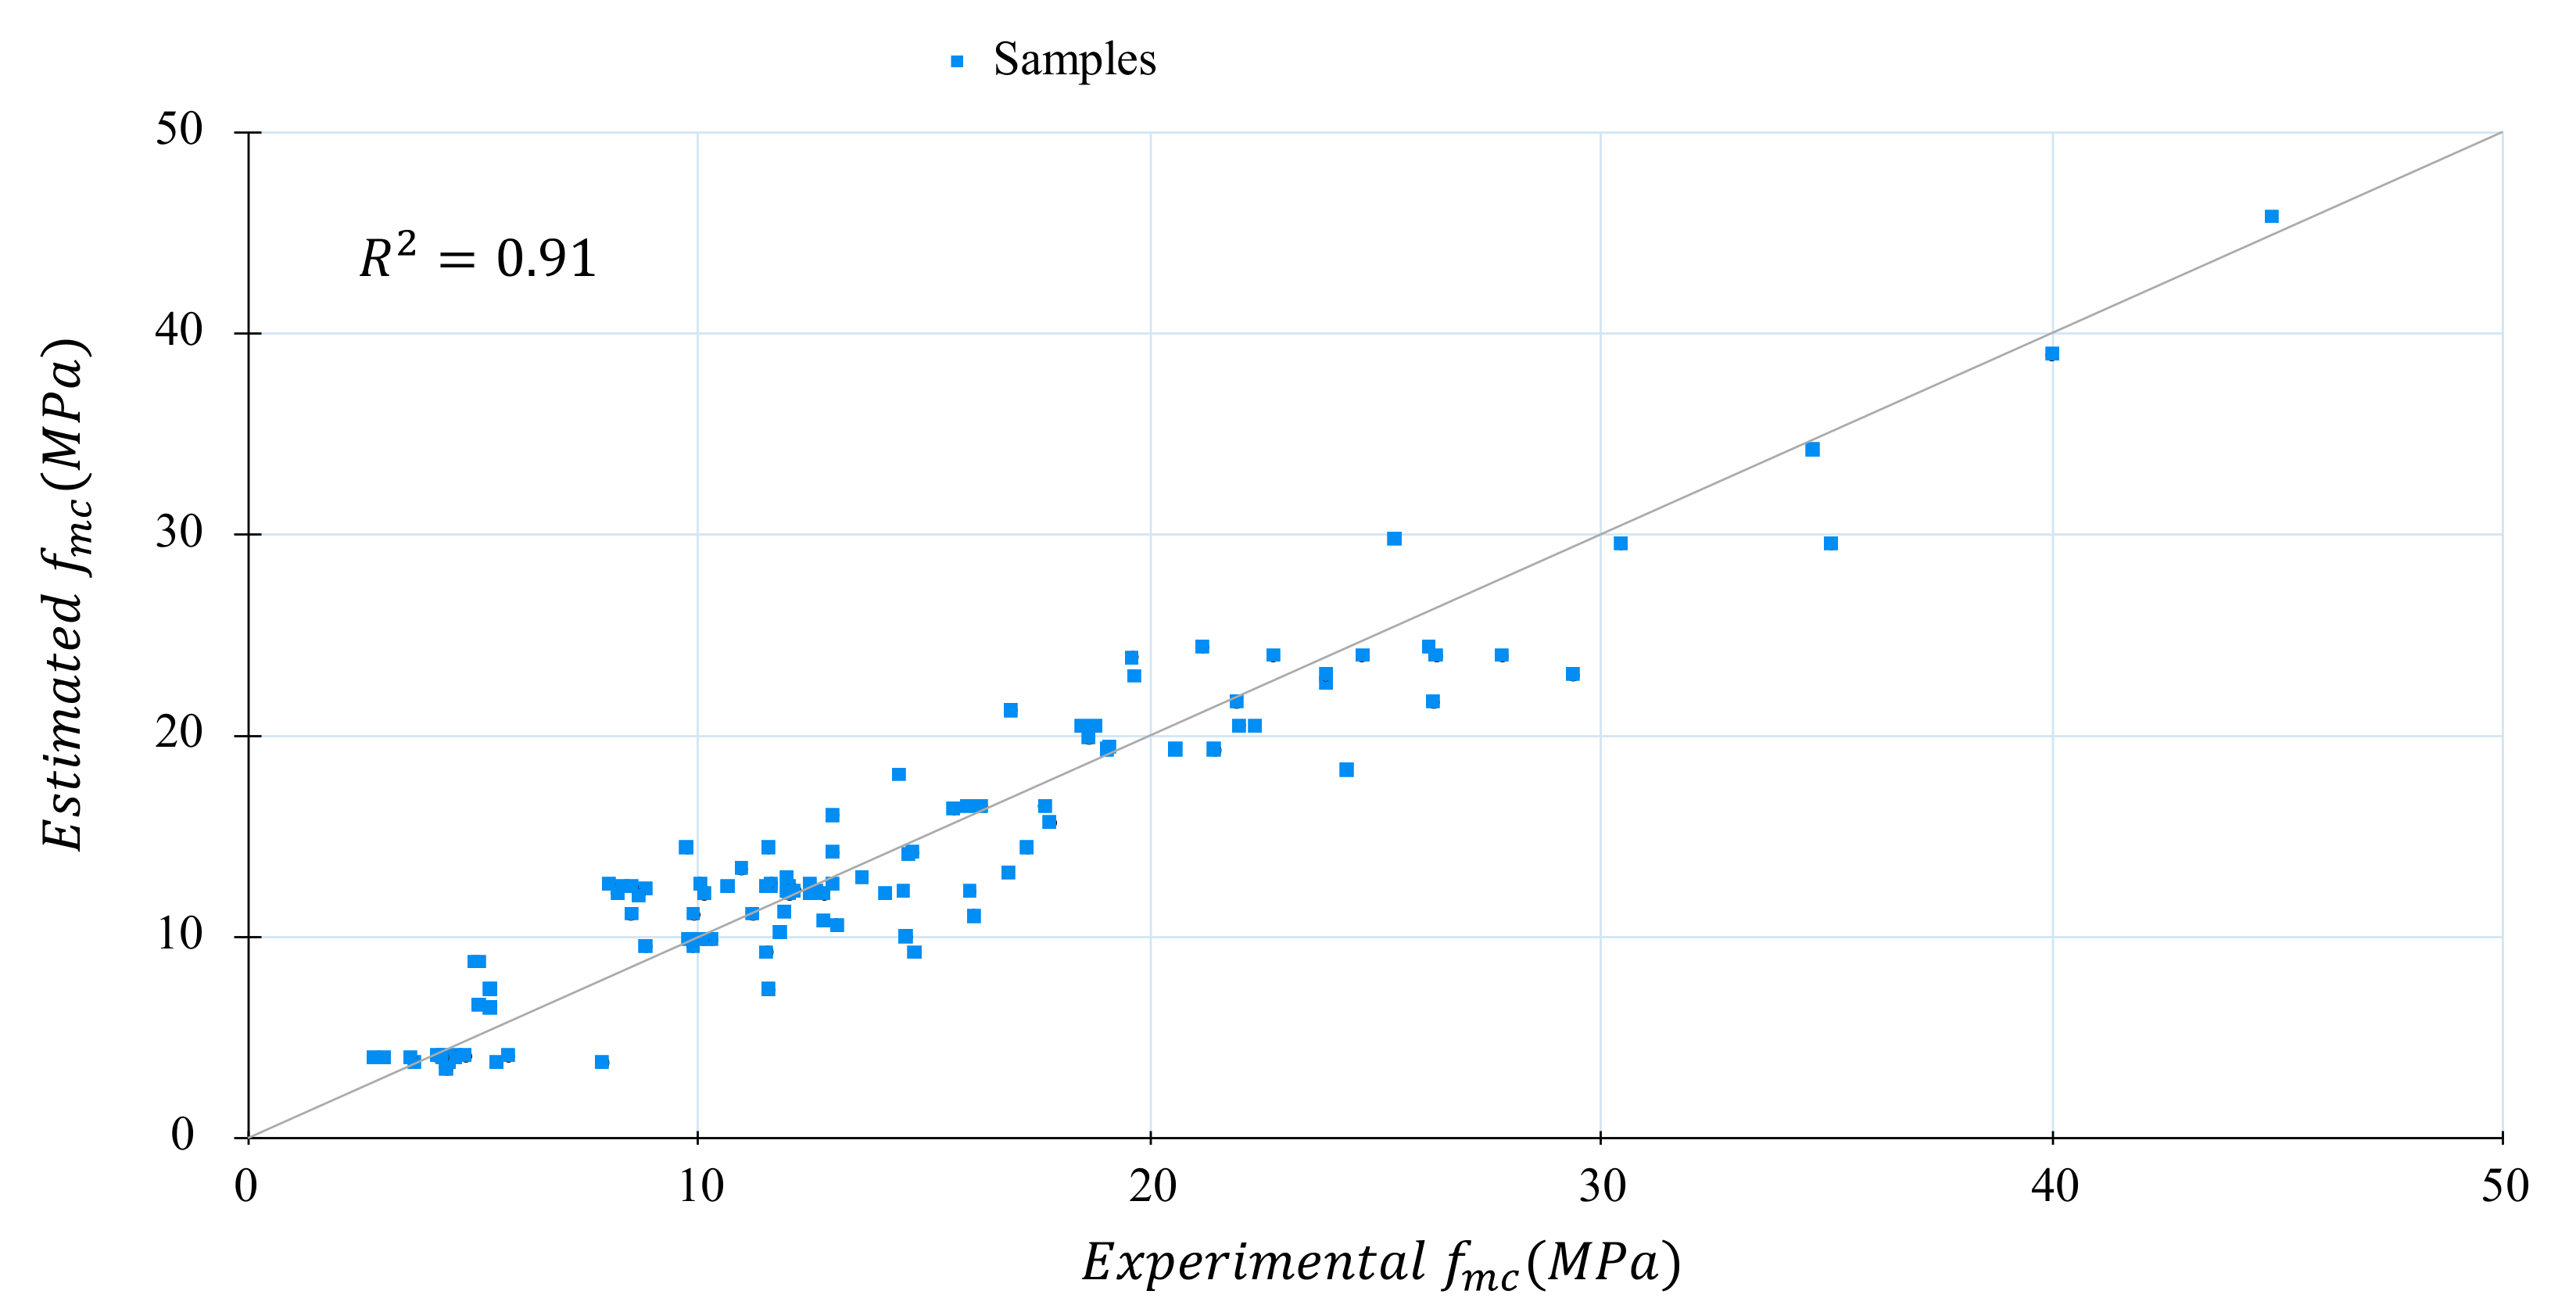
The performance of the simplified symbolic regression model, in which the coefficient of determination for the whole dataset is determined as 0.91 which implies that the symbolic regression model was performing well. Figure 9 shows the resemblance between the predicted results of the simplified symbolic regression model and experimental data. It can be found that the results obtained from the symbolic regression model were well matched with experiments.
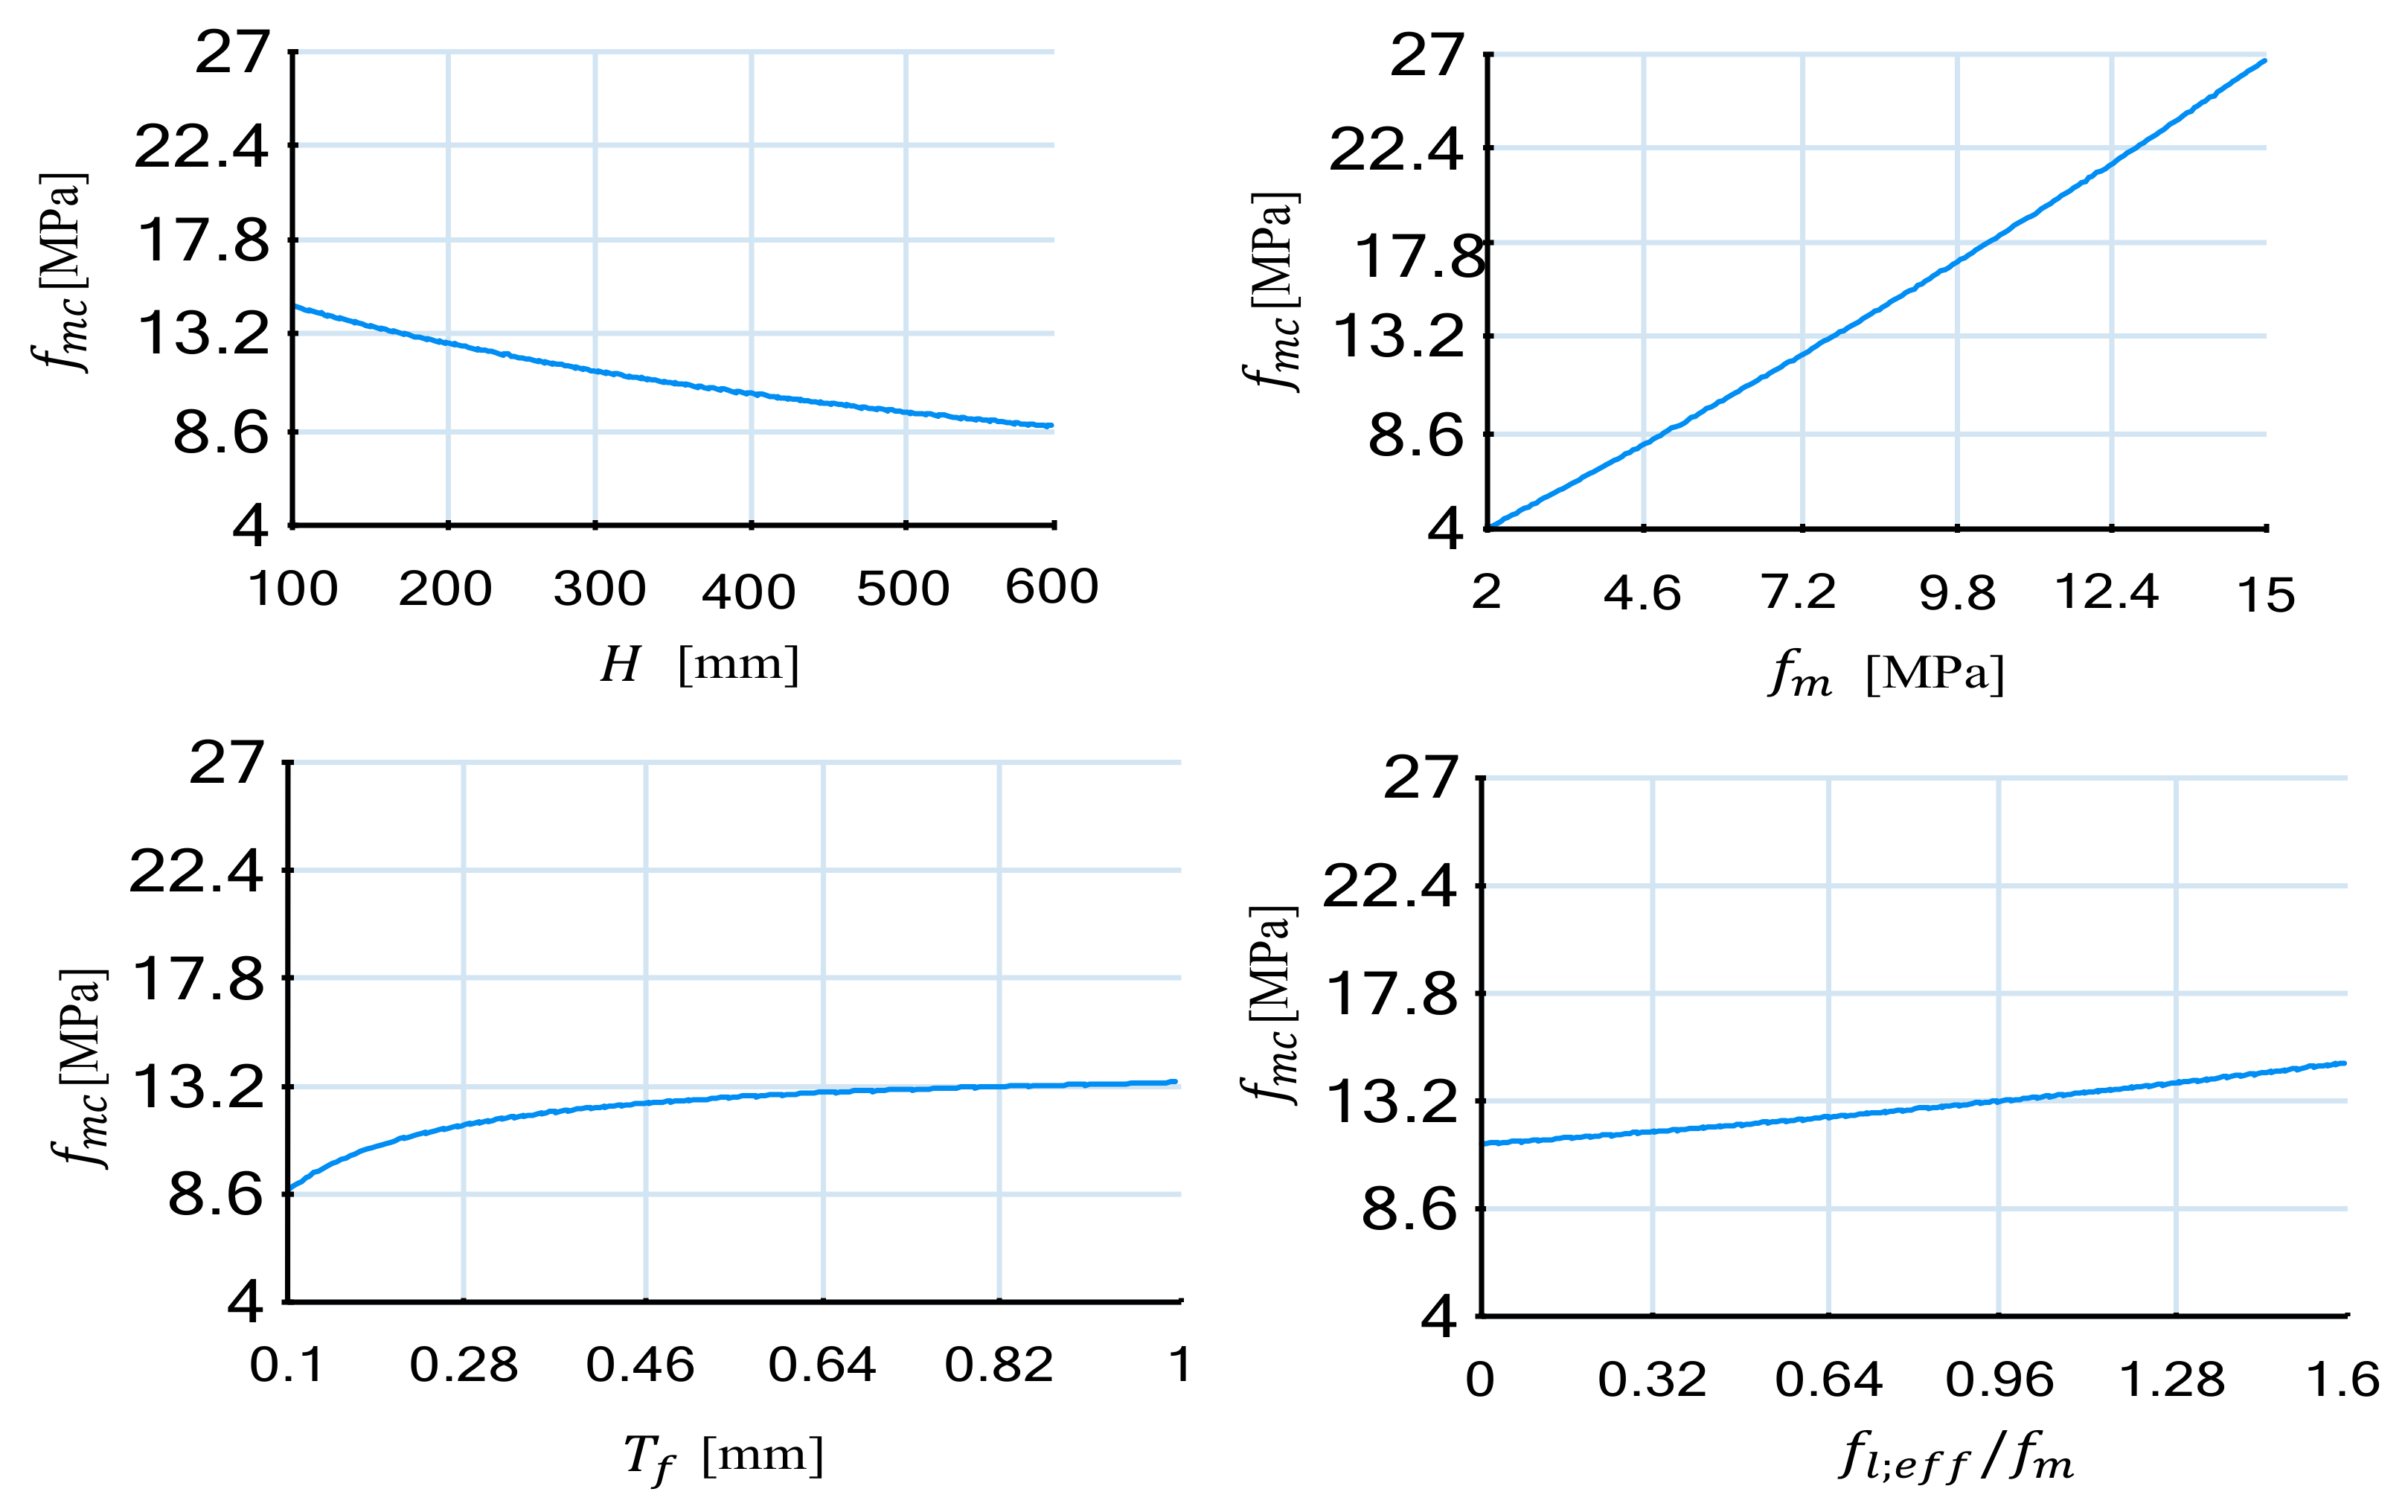
Figure 10 depicts four plots for the simplified model’s partial dependence on each of the four input parameters. The proposed model has a smooth response and nonlinear relationship with the compressive strength of masonry.
The simplified model from Equation (15) has a slightly higher prediction accuracy compared to the complex model (Figure 5) where the value of R2 is 0.91 against 0.83. In addition, the simplified model is much simpler to inspect and implement, particularly for hand calculations. Statistical indictors for the mathematical expression obtained by simplified symbolic expression are presented in Table 6 for the whole set of data.
The algorithm’s ability to select only the most influential input variables and ignore other input data is viewed as a positive trait. while keeping in mind that the input covers majority of column properties. Regarding the symbolic regression approach and the other computational methods which are capable of dealing with a wider range of application in different fields, the physical interpretation of the underlying process should be attainable. However, the expression usually possesses black-box model characteristics and should be interpolated carefully when applied to engineering problems where the physical meaning is exceptionally important. The quality of machine learning algorithms is connected to the amount of data to discover the connections within the dataset parameters. Furthermore, a high quality dataset should be representative and holds the required insights to make the truthful predictions. Inconsistency in collecting the dataset or defining the parameters will drastically affect the ability of artificial intelligent model to generalize the prediction and given honest scientific finding.
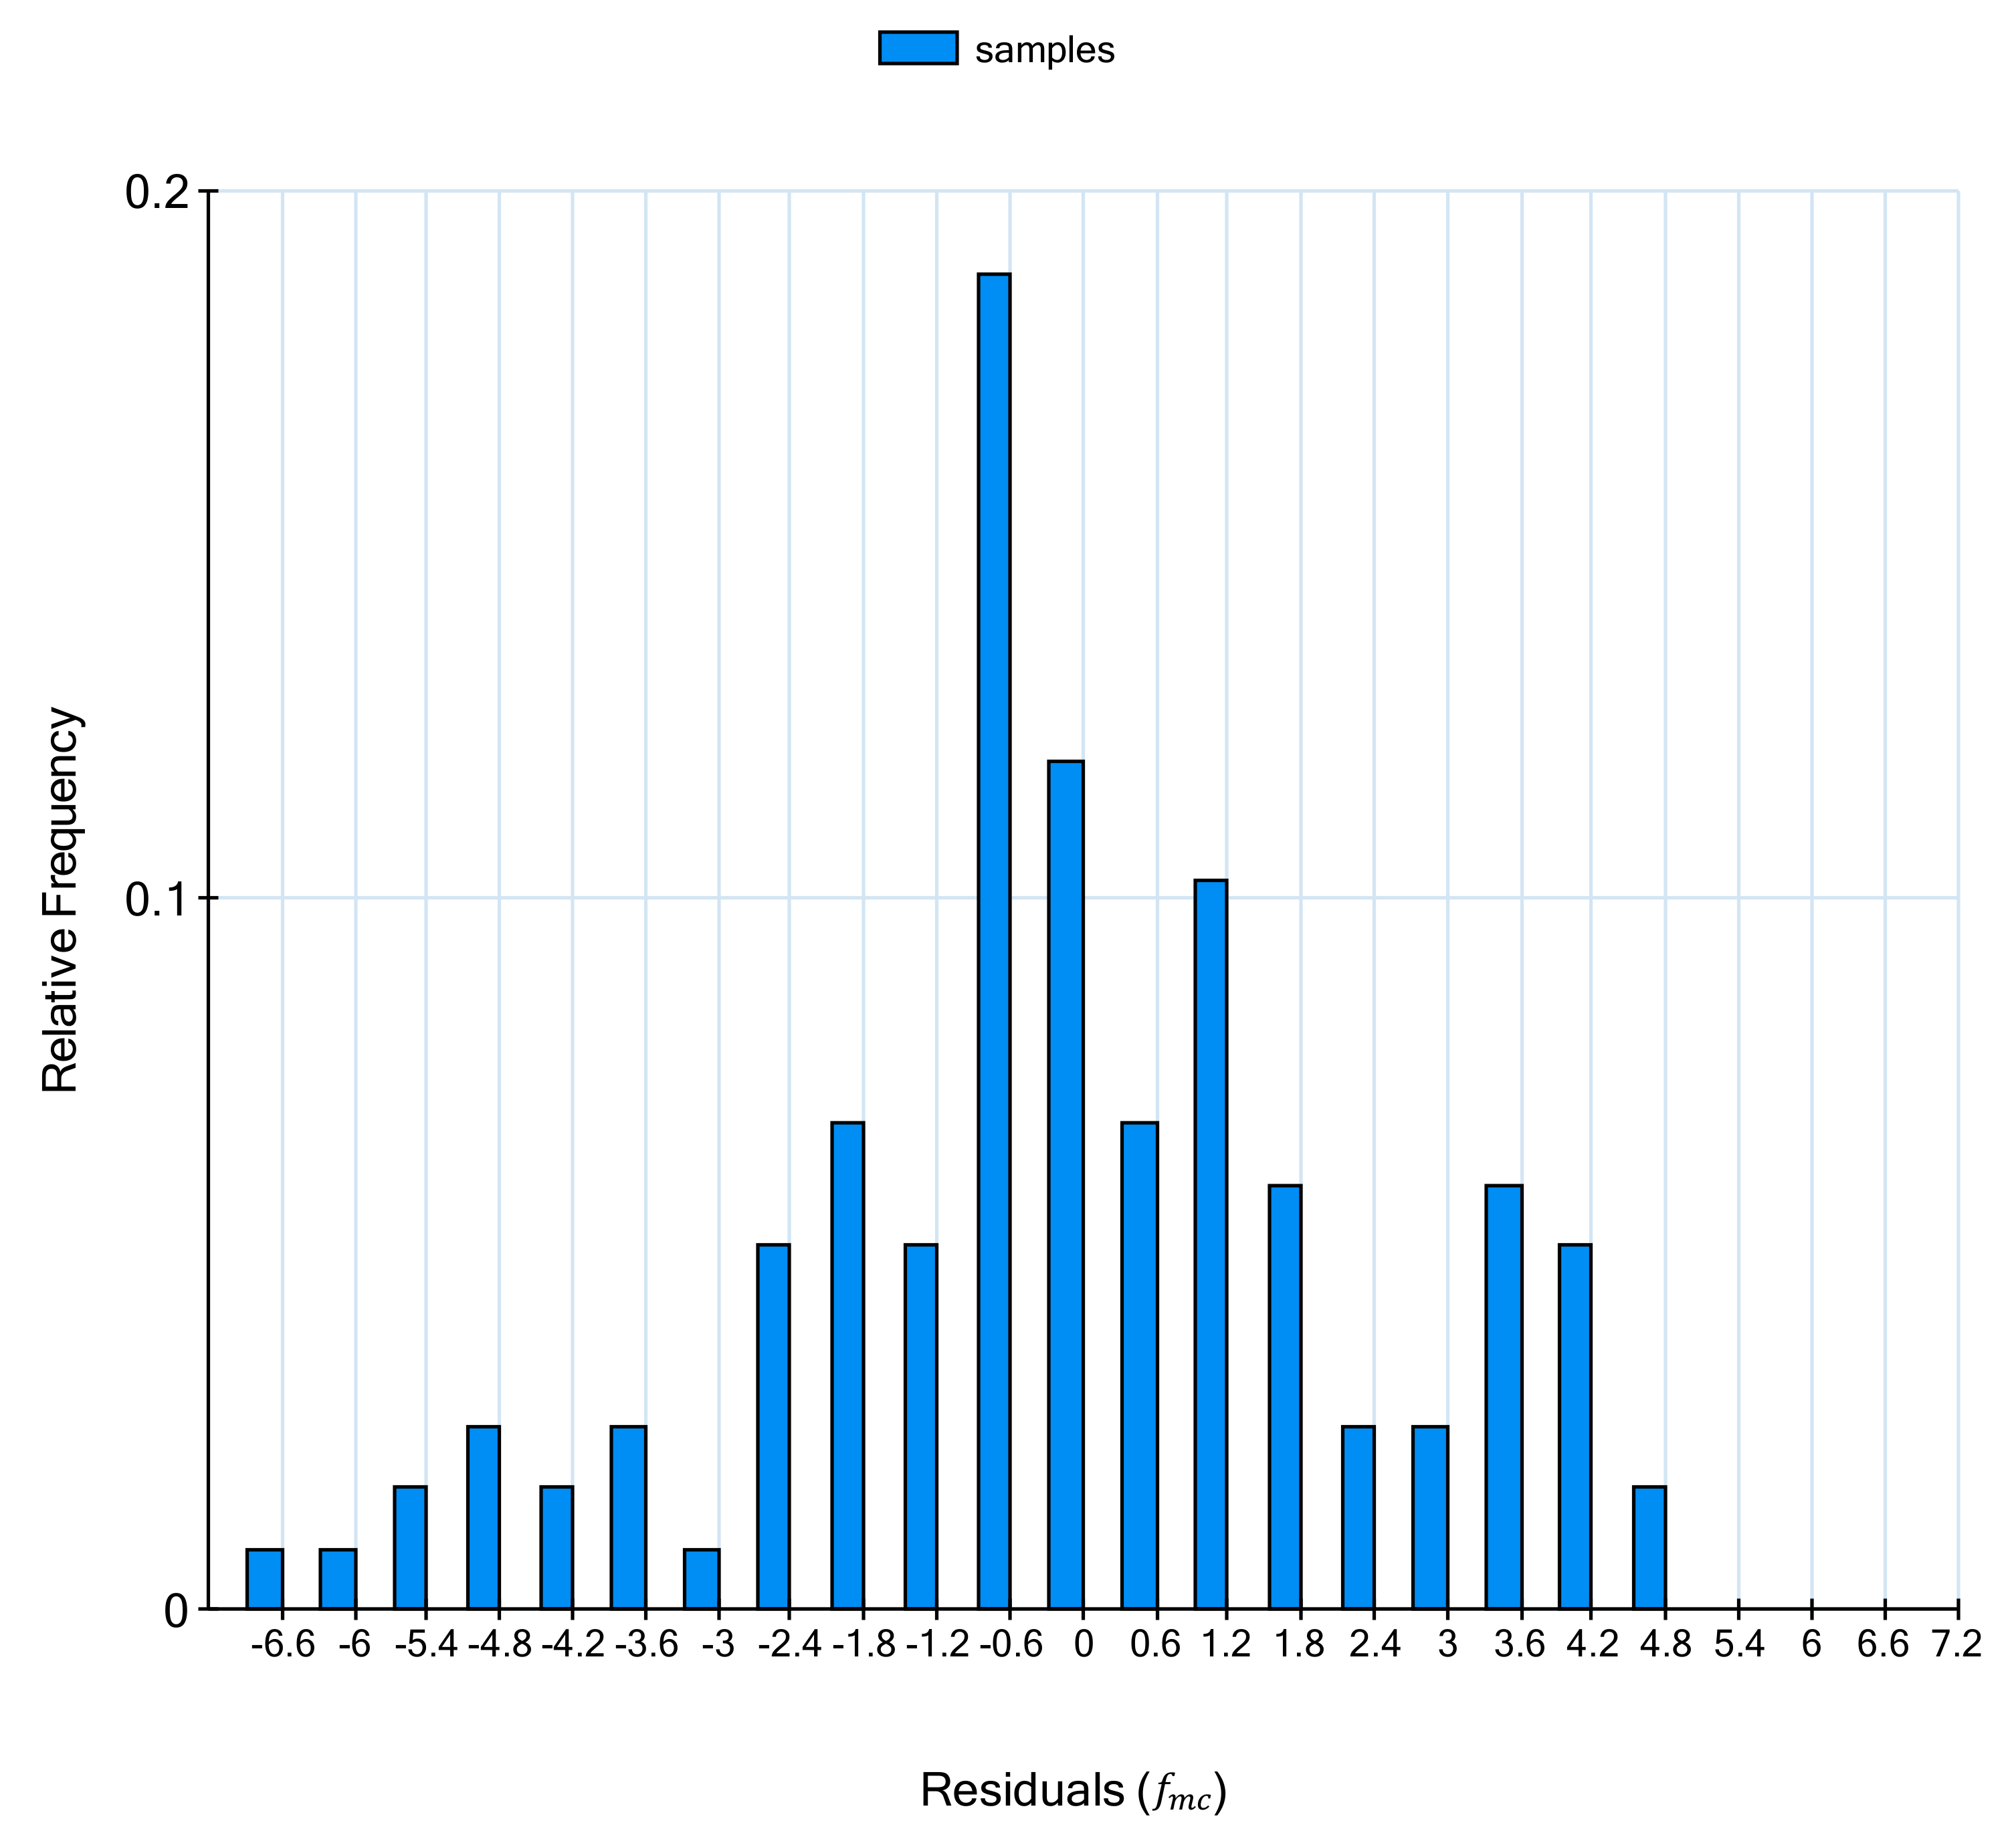
The relative frequency histogram of residual error is an additional crucial graph derived from the evaluation of the simplified symbolic expression. The relative frequency is the number of occurrences of a value within a data set. Further, Figure 11 depicts the relative frequency histogram of model error residuals. From the bar chart, the error concentration and minimum and maximum residuals error values can be visualized in advance.
6. Comparison of Proposed Symbolic Regression Model with Existing Formulas
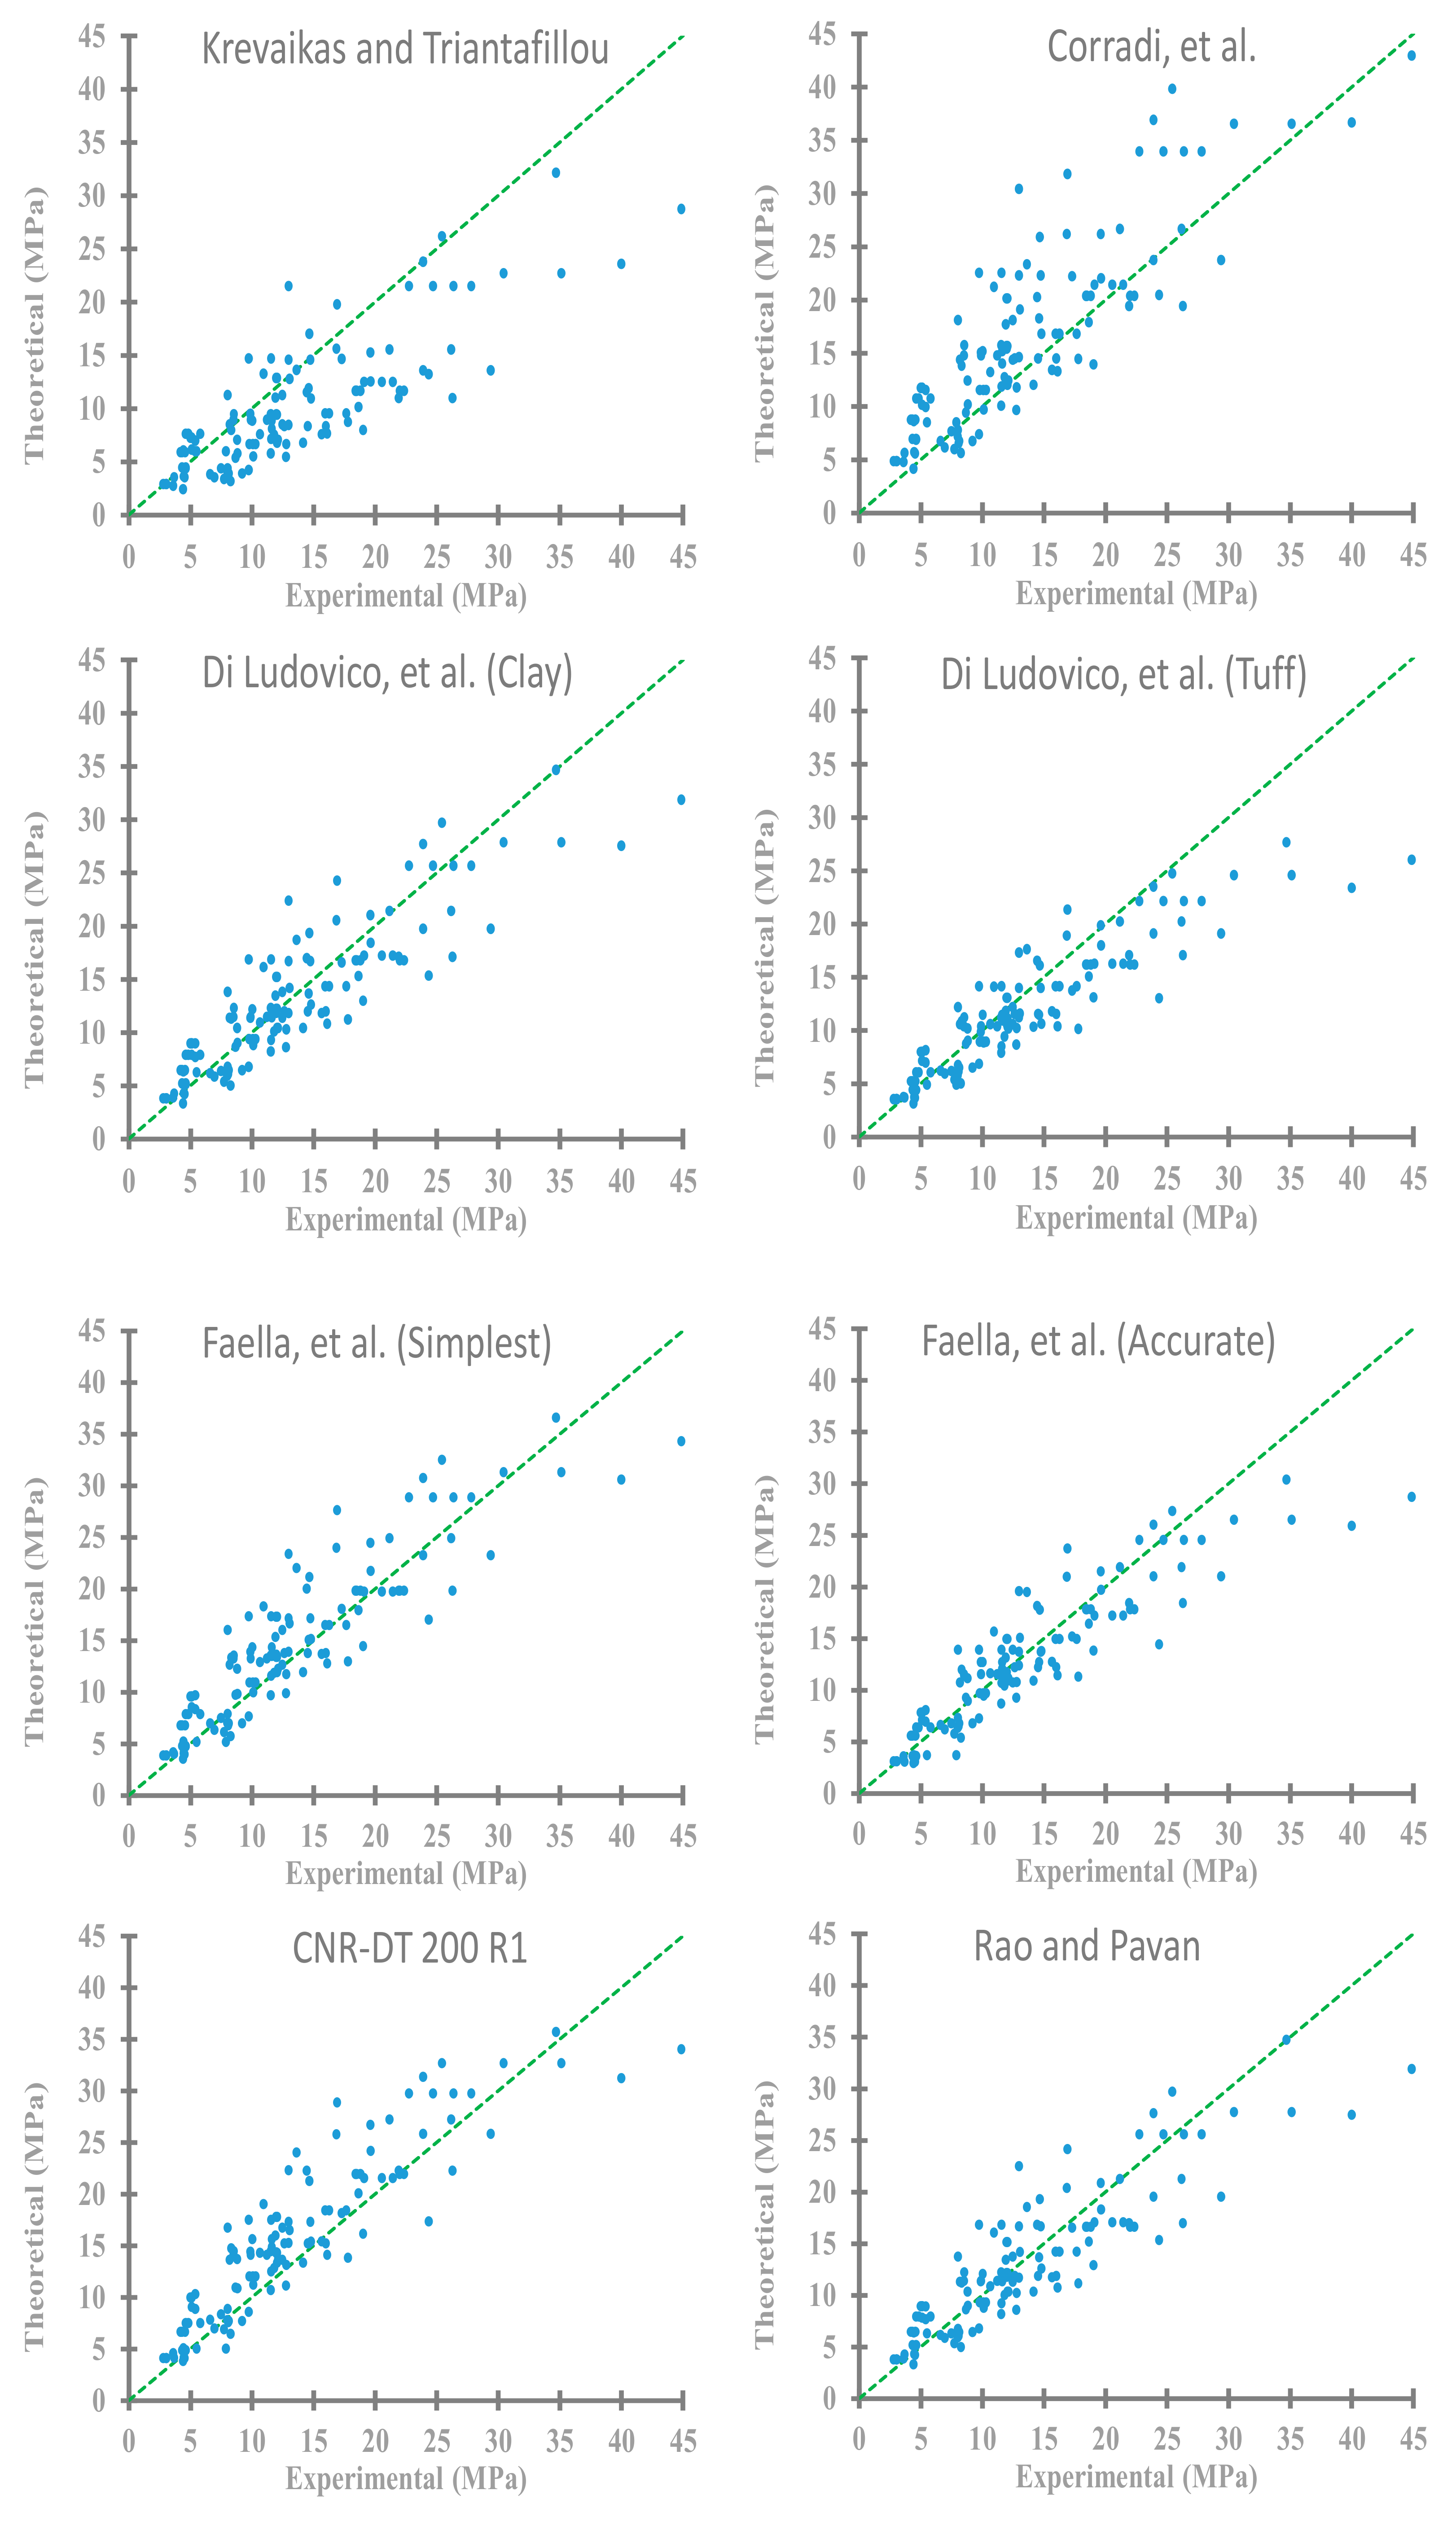
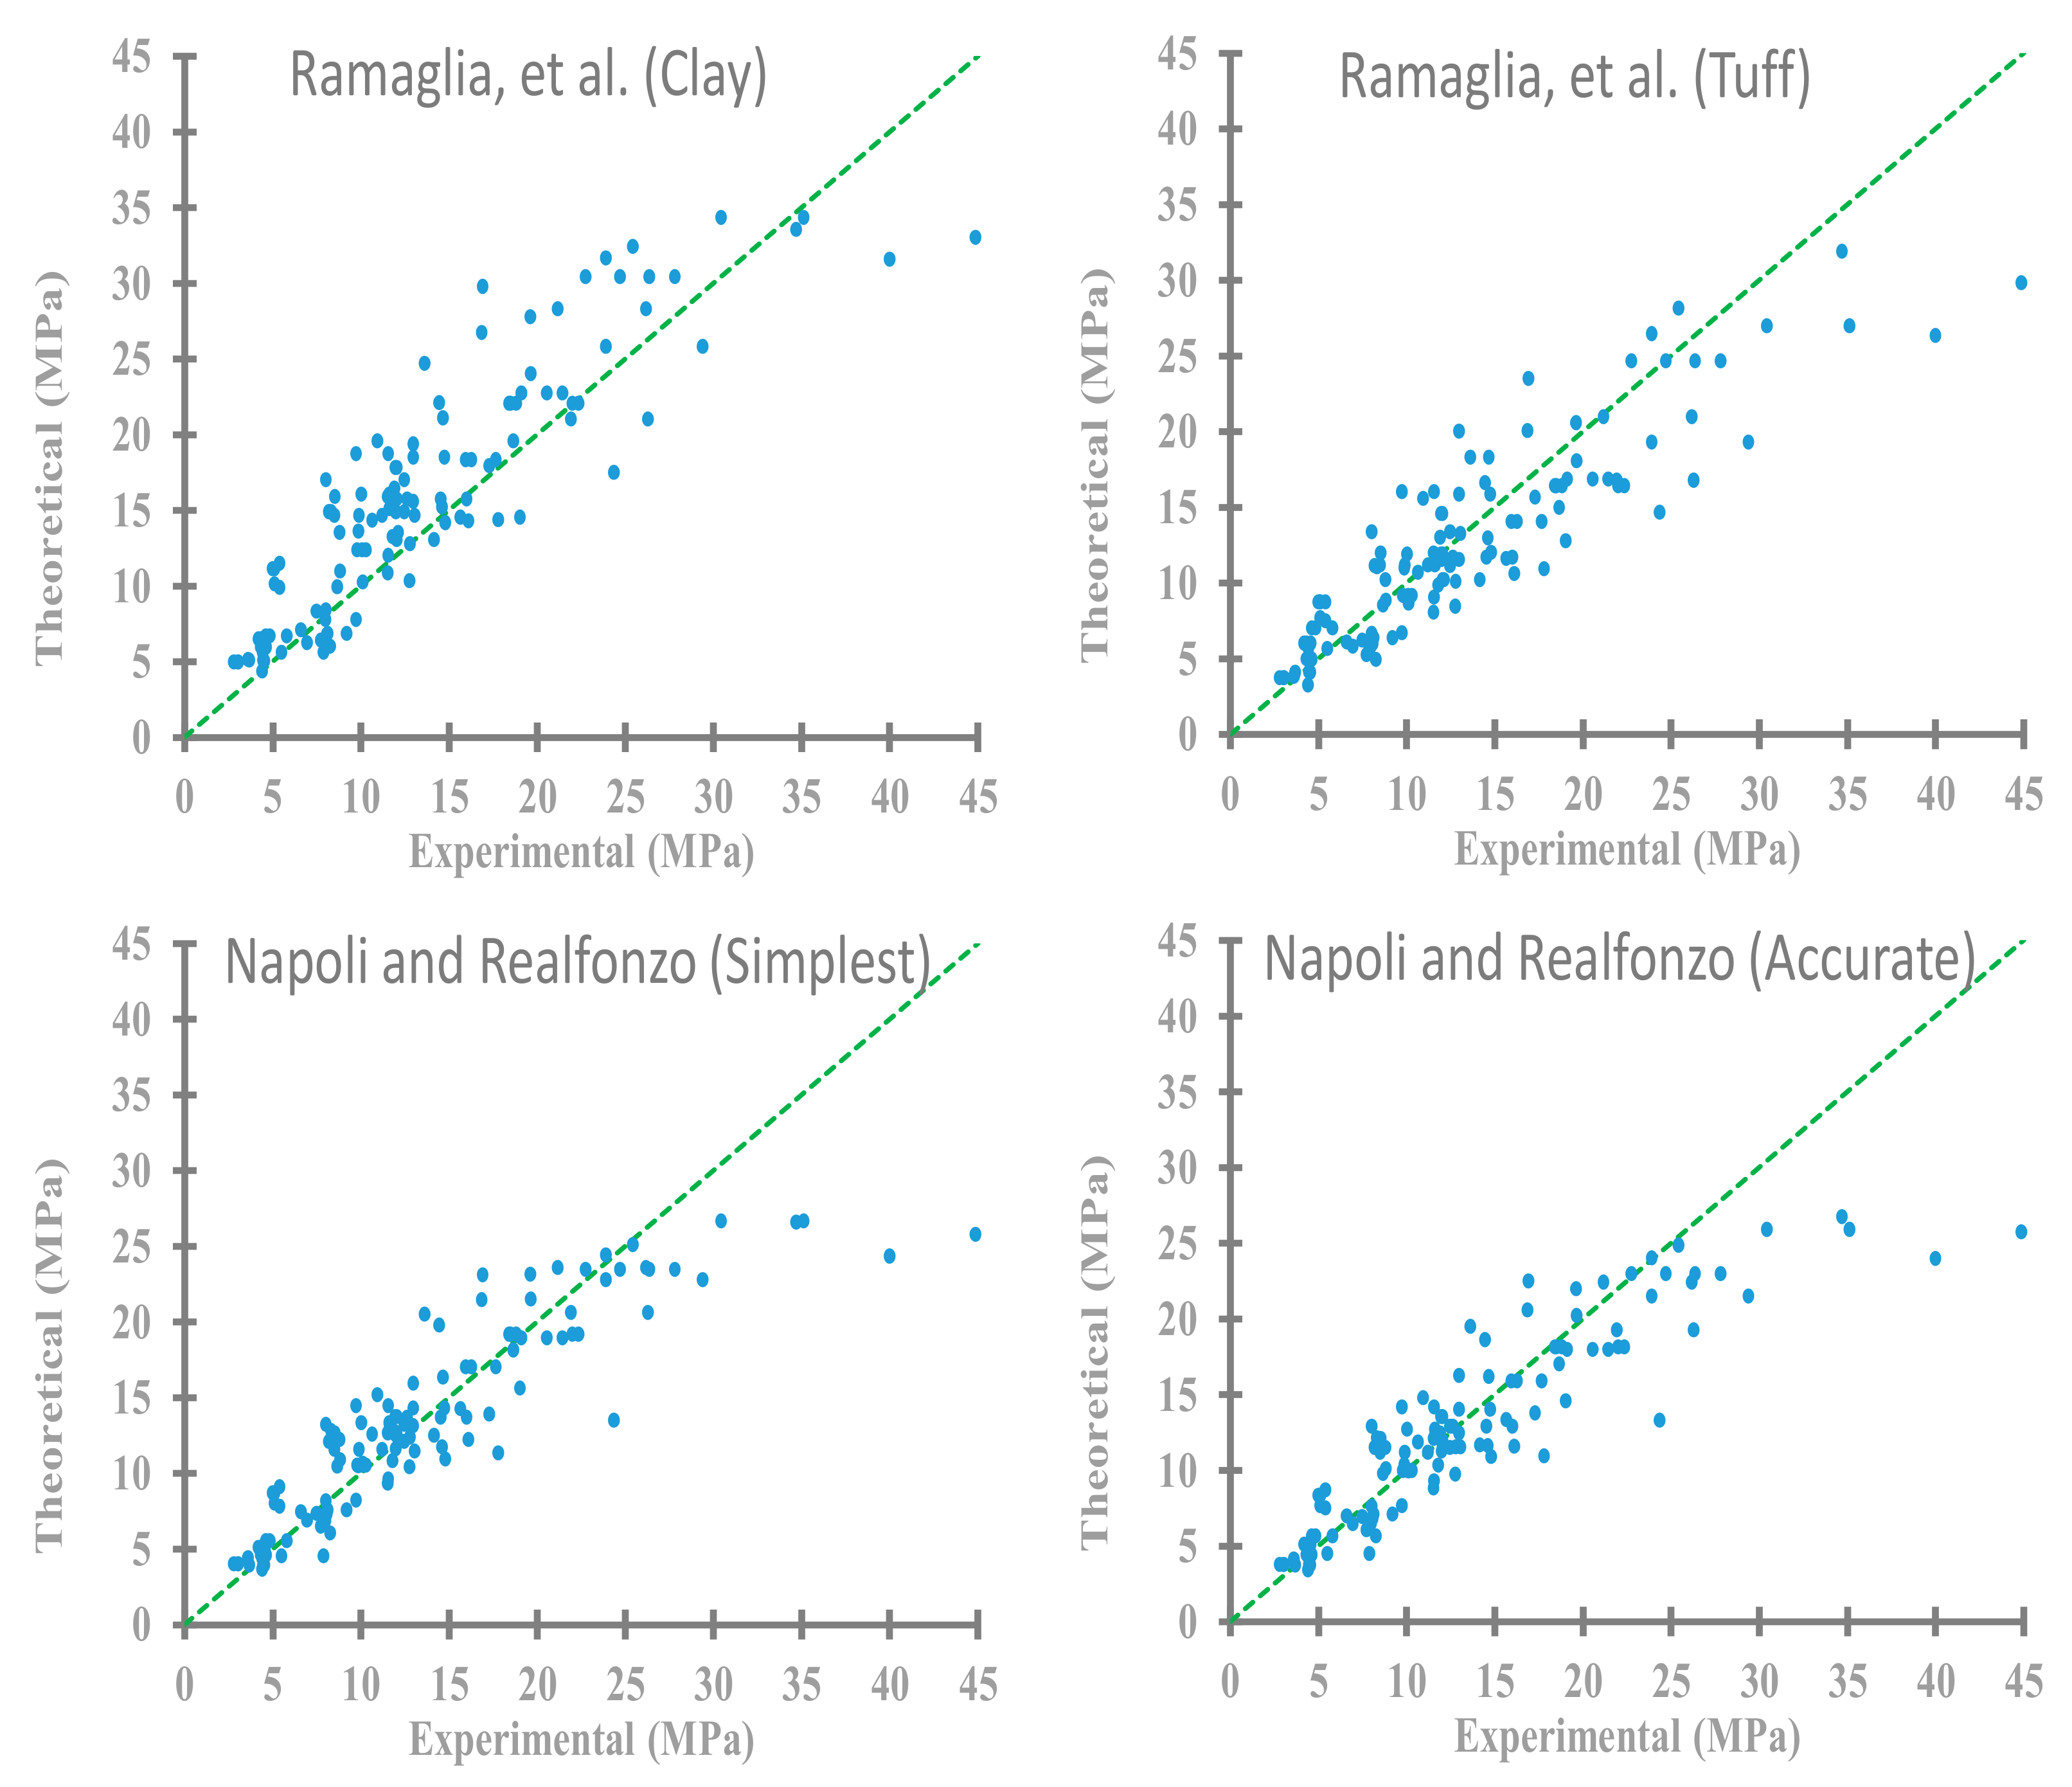
The accuracy of some strength expressions discussed in Section 2 has been compared and illustrated in Figure 12. Major theoretical models available to predict strength gaining for prismatic masonry columns confined by FRP in compression are considered. twelve distinct approaches to defining the compressive constitutive law are: Krevaikas and Triantafillou [21], Corradi et al. [19], Di Ludovico et al. [20] for clay and tuff, Faella et al. [14] simplest and accurate, CNR-DT 200 R1 [35], Rao and Pavan [36], Ramaglia et al. [22] for clay and tuff as well as Napoli and Realfonzo [37] simplest and accurate. R2 value, ARR, MAE, MSE and RMSE for each model along with the proposed model are calculated for obtaining the approach’s reliability (Table 7).
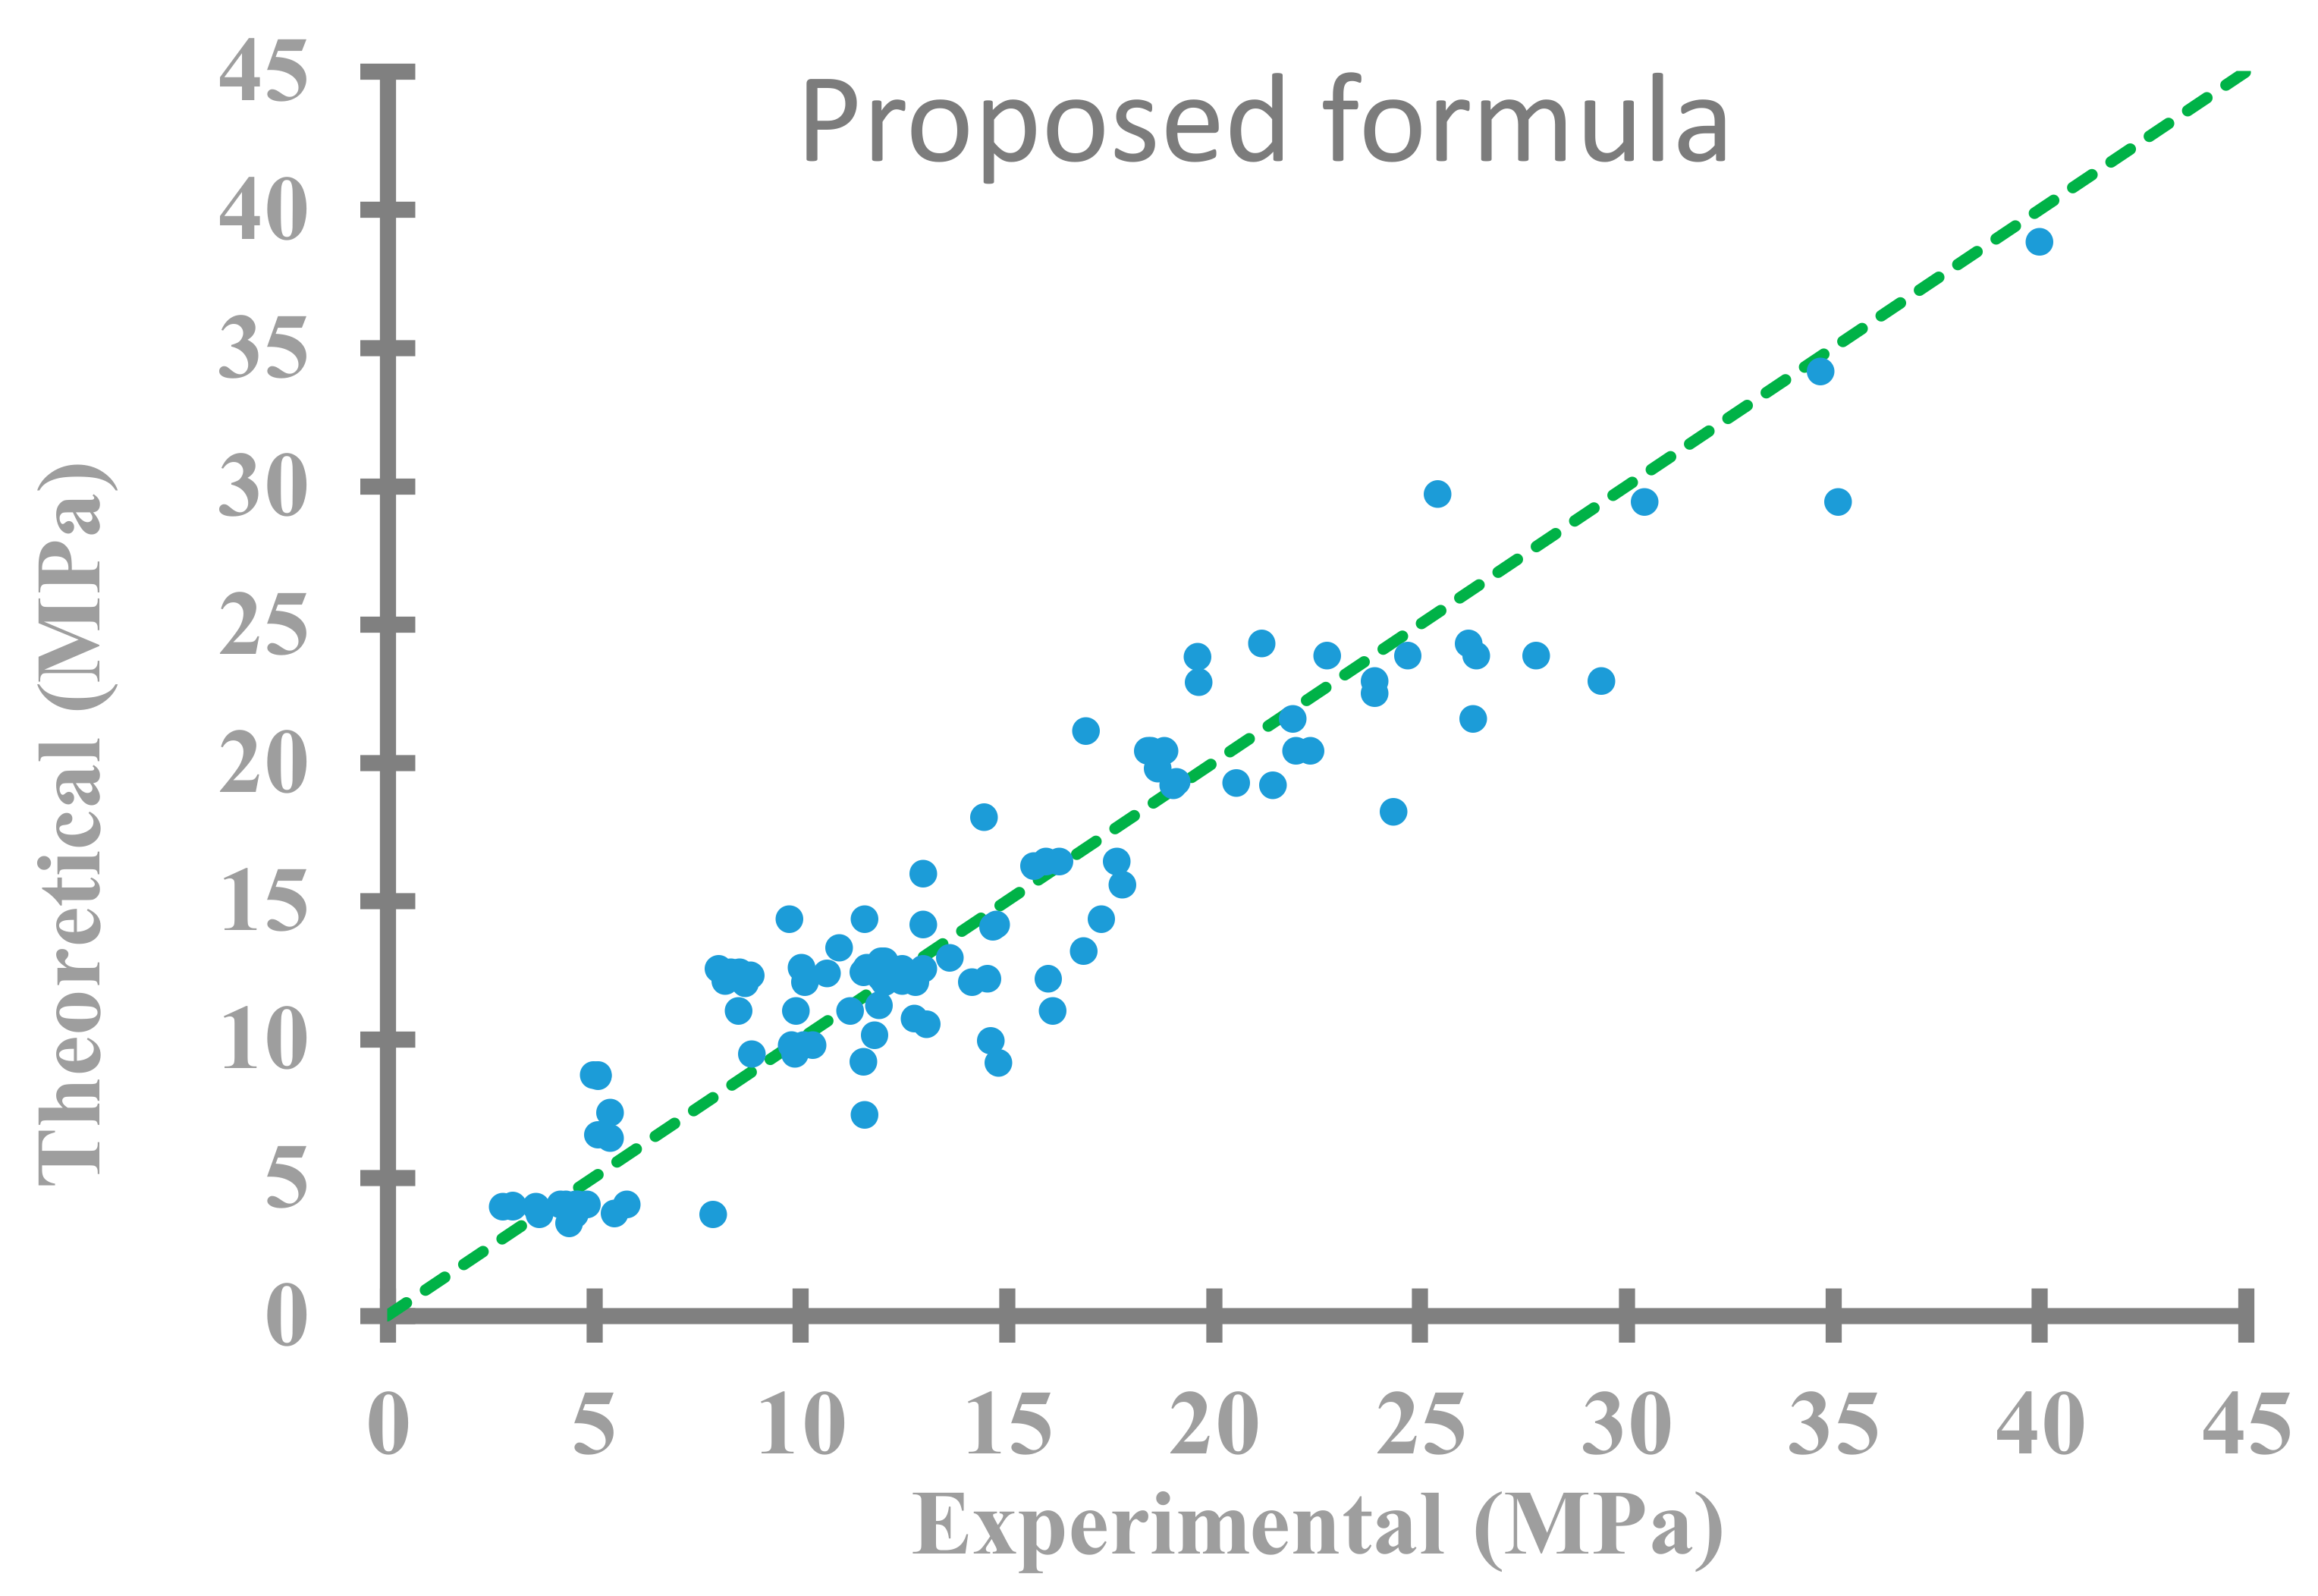
From Figure 12 and Figure 13, it can clearly be observed that the proposed model has an excellent agreement of regression value, 0.91 compared to the existing models. Di Ludovico et al. [20] for tuff, Faella et al. [14] accurate, CNR-DT 200 R1 [35], and Napoli and Realfonzo [37] shows immediate lower regression value as 0.82 which is also well below than the proposed model. Other models followed slightly lower regression. This finding has also been supported by the ARR, MAE, MSE and RMSE outputs. It can be concluded that the Napoli and Realfonzo [37] simplest model might offer good correlation with the experimental data although the proposed model is more accurate than this model as well. The experimental data for the proposed model shows ARR, MAE, MSE and RMSE as 0.16, 1.86, 5.94 and 2.44 whereas the Napoli and Realfonzo [37] simplest illustrates 0.18, 2.29, 12.67 and 3.56, respectively. The very less RMSE proves the superior accuracy of the proposed model. The Faella et al. [14] simplest model the trend with slightly lower value immediately after the Napoli and Realfonzo [37] simplest model though it has more MSE value. Figure 13 also reflects the data very close to the regression line without any major deviation. Whereas a few widely deviated values of other model made the differences proving the suitability of the proposed formulation.
During the comparison of the experimental results with the analytical predictions, the average ratio equal to the values of theoretical prediction over experimental values divided by number of samples was reported. Two of the major statistical metrics to evaluate the confinement model’s performance are namely average ratio and coefficient of variation (COV) according to the Equations (16) and (17), respectively.
The average ratio (Prediction/Experiment), coefficient of variance (COV), number of predictions less than 10% error, highest predictions and lowest predictions are also computed to validate the accuracy of the current model to the existing ones. The average ratio for the proposed model is 1.03 which is very good as only 3% variation is there for prediction compared to the experimental date. Faella et al. [14] accurate model offers the average ratio as 1.0; whereas Ramaglia et al. [22] for tuff and Napoli and Realfonzo [37] accurate shows it as 1.01 which are very close to the proposed model. The model better fits with results for both the average ratio and COV. The proposed model makes accurate predictions with an average ratio of approximately 1.03 and COV as 22.4%. Other models have elevated COV values. Nevertheless, overestimated predictions for strength of confined columns were observed by Corradi et al. [19] model by 33% greater average value than experimental output.
The models of Di Ludovico et al. [20] for clay, Faella et al. [14] simplest, CNR-DT 200 R1 [35], Ramaglia et al. [22] for clay gives non-conservative predictions of the specimens by 5%, 16%, 23% and 2% of the practical values though the COVs are little higher. Among all the models, the Corradi et al. [19] seems to be most non-conservative to overestimate the axial strength. The primary discrepancy between experimental data and theoretical predictions is that models overestimate the effective strain in the FRP jacket, resulting in an overestimate of the effective confining pressure. Reducing the maximum allowable strain would improve the model’s accuracy.
Table 8 also displays experimental and theoretically predicted values of compressive strength of FRP-confined prisms subjected to axial loading in terms of number of predictions with less than 10% error. It is evident from this output that the proposed model performs significantly better than the other models. Comparison is made between the performance of existing analytical models and the analytical expression proposed here. The number of predictions less than 10% error is 53 for the proposed model which is well above the immediate lower value of Di Ludovico et al. [20] as 24 followed by Ramaglia et al. [22] for Tuff, Krevaikas and Triantafillou [21], Faella et al. [14] accurate and Napoli and Realfonzo [37] accurate showing around 16 in number. This behavior is supported by the highest prediction value of 1.74 and lowest prediction value of 0.46 as well, which are much better than the other models. It means that the percentage variation of the peak highest and lowest values is more sensible for the proposed model. The proposed analytical model predicts the compressive strength of FRP-confined masonry prisms subjected to axial loading better than all existing analytical models.
7. Conclusions
This study deals with the analysis of the FRP confinement of masonry columns, proposing a new model to estimate the compressive strength and evaluate existing formulas. The objective is to identify mathematical expressions that outperform conventional regression models. To derive the constitutive equations from compression testing data with varying input parameters, symbolic regression is chosen. Literature was used to compile a large database containing the results of compression tests on over 198 FRP confined masonry members. Using symbolic regression, the experimental data were used for developing new relationships to foresee the compressive strength of FRP-confined masonry. Comparisons are made with the existing formulations and international guidelines. The subsequent conclusions are reached:
- The complex symbolic regression-based black-box model can be considered good with MAE and MSE for training data are 1.51 MPa and 3.48 MPa.
- The average ratio for the proposed model is 1.03 which is very good as only 3% variation is there for prediction compared to the experimental date.
- For the number of predictions less than 10% error output, it is evident that the proposed model is showing very excellent results compared to the other models. The number of predictions less than 10% error is 53 for the proposed model which is well above the immediate lower value of Di Ludovico et al. [20] for tuff as 24.
- The proposed simplified analytical model can predict the compressive strength of FRP-confined masonry prisms subjected to axial loading for any type of masonry better than available analytical models in the literature.
Recently, artificial intelligence techniques have emerged as powerful and versatile computational tools for producing new knowledge by classifying or connecting parameters. Moreover, artificial intelligence has shown better performance than traditional regression for correlating nonlinear data. Considering that the present study gave an accurate equation which could be adopted in the practical design process of retrofitting or strengthening masonry columns, more future research is required to increase the accuracy of the models or expand available database. Different artificial intelligence techniques could be tried to improve the correlations between input and outputs of the dataset or coming up with new findings. In addition, graphical user interface platforms could be useful for simplifying the design process for masonry columns confined by FRP when complex artificial intelligence systems based on the black-box model are adopted.
Author Contributions
Conceptualization, K.S.A.; methodology, K.S.A. and A.B.M.S.I.; software, K.S.A.; validation, K.S.A.; formal analysis, K.S.A. and A.B.M.S.I.; investigation, K.S.A. and A.B.M.S.I.; resources, K.S.A. and A.B.M.S.I.; data curation, K.S.A. and A.B.M.S.I.; writing—original draft preparation, K.S.A.; writing—review and editing, K.S.A. and A.B.M.S.I.; visualization, K.S.A. and A.B.M.S.I. All authors have read and agreed to the published version of the manuscript.
Funding
This research received no external funding.
Data Availability Statement
Not applicable.
Acknowledgments
The authors gratefully acknowledge the Civil and Construction engineering department, College of engineering, Imam Abdulrahman Bin Faisal University for the technical support.
Conflicts of Interest
The authors declare that they have no known competing financial interests or personal relationships that could appear to have influenced the research reported in this paper.
References
- Borri, A.; Castori, G.; Corradi, M. Masonry columns confined by steel fiber composite wraps. Materials 2011, 4, 311–326. [Google Scholar] [CrossRef] [PubMed]
- Ombres, L. Confinement Effectiveness in Eccentrically Loaded Masonry Columns Strengthened by Fiber Reinforced Cementitious Matrix (FRCM) Jackets. Key Eng. Mater. 2014, 624, 551–558. [Google Scholar] [CrossRef]
- Thamboo, J. Performance of masonry columns confined with composites under axial compression: A state-of-the-art review. Constr. Build. Mater. 2021, 274, 121791. [Google Scholar] [CrossRef]
- Bashiri, M.; Toufigh, V. Numerical and experimental investigation on a BRB confined with partially carbon fiber reinforced polymer (CFRP). Eng. Struct. 2020, 223, 111150. [Google Scholar] [CrossRef]
- Rodríguez, V.; Guerrero, H.; Alcocer, S.M.; Tapia-Hernández, E. Rehabilitation of heavily damaged beam-column connections with CFRP wrapping and SFRM casing. Soil Dyn. Earthq. Eng. 2021, 145, 106721. [Google Scholar] [CrossRef]
- Yan, Y.; Liang, H.; Lu, Y.; Huang, Y. Behaviour of concrete-filled steel-tube columns strengthened with high-strength CFRP textile grid-reinforced high-ductility engineered cementitious composites. Constr. Build. Mater. 2021, 269, 121283. [Google Scholar] [CrossRef]
- Yetilmezsoy, K.; Sihag, P.; Kıyan, E.; Doran, B. A benchmark comparison and optimization of Gaussian process regression, support vector machines, and M5P tree model in approximation of the lateral confinement coefficient for CFRP-wrapped rectangular/square RC columns. Eng. Struct. 2021, 246, 113106. [Google Scholar] [CrossRef]
- Ozbakkaloglu, T.; Lim, J.C. Axial compressive behavior of FRP-confined concrete: Experimental test database and a new design-oriented model. Compos. Part B Eng. 2013, 55, 607–634. [Google Scholar] [CrossRef]
- Thamboo, J.; Navaratnam, S.; Poologanathan, K.; Corradi, M. Characteristics of CFRP strengthened masonry wallettes under concentric and eccentric compression. Case Stud. Constr. Mater. 2021, 14, e00472. [Google Scholar] [CrossRef]
- Wan, C.; Wang, J.; Zeng, Q.; Shen, L.; Yan, D.; Peng, Y. Mechanical behavior of masonry columns strengthened with basalt textile reinforced concrete under eccentric loading: Experimental investigation and analytical modelling. Constr. Build. Mater. 2021, 269, 121816. [Google Scholar] [CrossRef]
- Li, T.; Deng, M.; Jin, M.; Dong, Z.; Zhang, Y. Performance of axially loaded masonry columns confined using textile reinforced concrete (TRC) added with short fibers. Constr. Build. Mater. 2021, 279, 122413. [Google Scholar] [CrossRef]
- Fossetti, M.; Minafò, G. Comparative experimental analysis on the compressive behaviour of masonry columns strengthened by FRP, BFRCM or steel wires. Compos. Part B Eng. 2017, 112, 112–124. [Google Scholar] [CrossRef]
- Faella, C.; Martinelli, E.; Paciello, S.; Camorani, G.; Aiello, M.A.; Micelli, F.; Nigro, E. Masonry columns confined by composite materials: Experimental investigation. Compos. Part B Eng. 2011, 42, 692–704. [Google Scholar] [CrossRef]
- Faella, C.; Martinelli, E.; Camorani, G.; Aiello, M.A.; Micelli, F.; Nigro, E. Masonry columns confined by composite materials: Design formulae. Compos. Part B Eng. 2011, 42, 705–716. [Google Scholar] [CrossRef]
- Micelli, F.; Di Ludovico, M.; Balsamo, A.; Manfredi, G. Mechanical behaviour of FRP-confined masonry by testing of full-scale columns. Mater. Struct. 2014, 47, 2081–2100. [Google Scholar] [CrossRef]
- Witzany, J.; Čejka, T.; Zigler, R. Failure mechanism of compressed short brick masonry columns confined with FRP strips. Constr. Build. Mater. 2014, 63, 180–188. [Google Scholar] [CrossRef]
- Witzany, J.; Zigler, R. Failure mechanism of compressed reinforced and non-reinforced stone columns. Mater. Struct. 2015, 48, 1603–1613. [Google Scholar] [CrossRef]
- Micelli, F.; Angiuli, R.; Corvaglia, P.; Aiello, M.A. Passive and SMA-activated confinement of circular masonry columns with basalt and glass fibers composites. Compos. Part B Eng. 2014, 67, 348–362. [Google Scholar] [CrossRef]
- Corradi, M.; Grazini, A.; Borri, A. Confinement of brick masonry columns with CFRP materials. Compos. Sci. Technol. 2007, 67, 1772–1783. [Google Scholar] [CrossRef]
- Di Ludovico, M.; D’Ambra, C.; Prota, A.; Manfredi, G. FRP confinement of tuff and clay brick columns: Experimental study and assessment of analytical models. ASCE J. Compos. Constr. 2010, 14, 583–596. [Google Scholar] [CrossRef]
- Krevaikas, T.D.; Triantafillou, T. Masonry confinement with fiber-reinforced polymers. ASCE J. Compos. Constr. 2005, 9, 128–135. [Google Scholar] [CrossRef]
- Ramaglia, G.; Lignola, G.P.; Fabbrocino, F.; Prota, A. Multi-parameters mechanical modeling to derive a confinement model for masonry columns. Constr. Build. Mater. 2019, 214, 303–317. [Google Scholar] [CrossRef]
- Waszczyszyn, Z.; Ziemiański, L. Neural networks in mechanics of structures and materials–new results and prospects of applications. Comput. Struct. 2001, 79, 2261–2276. [Google Scholar] [CrossRef]
- Gouda Mohamed, A.; Marzouk, M. Building condition assessment using artificial neural network and structural equations. Expert Syst. Appl. 2021, 186, 115743. [Google Scholar] [CrossRef]
- Arora, S.; Barak, B. Computational Complexity: A Modern Approach; Cambridge University Press: Cambridge, UK, 2009. [Google Scholar]
- Helmy, T.; Fatai, A.; Sallam, E.-S. An efficient randomized algorithm for real-time process scheduling in PicOS operating system. In Advanced Techniques in Computing Sciences and Software Engineering; Springer: Berlin/Heidelberg, Germany, 2010; pp. 117–122. [Google Scholar]
- Hasançebi, O.; Dumlupınar, T. Linear and nonlinear model updating of reinforced concrete T-beam bridges using artificial neural networks. Comput. Struct. 2013, 119, 1–11. [Google Scholar] [CrossRef]
- Song, H.; Ahmad, A.; Farooq, F.; Ostrowski, K.A.; Maślak, M.; Czarnecki, S.; Aslam, F. Predicting the compressive strength of concrete with fly ash admixture using machine learning algorithms. Constr. Build. Mater. 2021, 308, 125021. [Google Scholar] [CrossRef]
- Sun, J.; Wang, Y.; Liu, S.; Dehghani, A.; Xiang, X.; Wei, J.; Wang, X. Mechanical, chemical and hydrothermal activation for waste glass reinforced cement. Constr. Build. Mater. 2021, 301, 124361. [Google Scholar] [CrossRef]
- Zojaji, Z.; Ebadzadeh, M.; Nasiri, H. Semantic schema based genetic programming for symbolic regression. Appl. Soft Comput. 2022, 122, 108825. [Google Scholar] [CrossRef]
- Chen, Z.; Liu, Y.; Sun, H. Forecasting of nonlinear dynamics based on symbolic invariance. Comput. Phys. Commun. 2022, 277, 108382. [Google Scholar] [CrossRef]
- Rezaei, H.; Zarfam, P.; Golafshani, E.M.; Amiri, G.G. Seismic fragility analysis of RC box-girder bridges based on symbolic regression method. Structures 2022, 38, 306–322. [Google Scholar] [CrossRef]
- Wang, C.; Zhang, Y.; Wen, C.; Yang, M.; Lookman, T.; Su, Y.; Zhang, T.-Y. Symbolic regression in materials science via dimension-synchronous-computation. J. Mater. Sci. Technol. 2022, 122, 77–83. [Google Scholar] [CrossRef]
- Mansourdehghan, S.; Dolatshahi, K.; Asjodi, A. Data-driven damage assessment of reinforced concrete shear walls using visual features of damage. J. Build. Eng. 2022, 53, 104509. [Google Scholar] [CrossRef]
- CNR-DT 200 R1; Guide for the design and construction of externally bonded FRP systems for strengthening existing structures. Consiglio Nazionale delle Ricerche: Rome, Italy, 2013.
- Rao, K.N.; Pavan, G. FRP-confined clay brick masonry assemblages under axial compression: Experimental and analytical investigations. J. Compos. Constr. 2015, 19, 04014068. [Google Scholar] [CrossRef]
- Napoli, A.; Realfonzo, R. FRP confined masonry under compression: Database collection and design proposals. Compos. Struct. 2021, 276, 114490. [Google Scholar] [CrossRef]
- Udrescu, S.-M.; Tegmark, M. AI Feynman: A physics-inspired method for symbolic regression. Sci. Adv. 2020, 6, eaay2631. [Google Scholar] [CrossRef] [PubMed] [Green Version]
- Koza, J. On the programming of computers by means of natural selection. In Genetic Programming; MIT Press: Cambridge, MA, USA, 1992. [Google Scholar]
- Goldberg, D.E. Genetic Algorithms; Pearson Education India: Delhi, India, 2008. [Google Scholar]
- Wagner, S.; Kronberger, G.; Beham, A.; Kommenda, M.; Scheibenpflug, A.; Pitzer, E.; Vonolfen, S.; Kofler, K.; Winkler, S.; Dorfer, V.; et al. Architecture and design of the Heuristic. Lab Optimization Environment. In Advanced Methods and Applications in Computational Intelligence; Springer: Berlin/Heidelberg, Germany, 2014; pp. 197–261. [Google Scholar]
Figure 1.
Front view of prismatic masonry member confined with discontinuous FRP strips.

Figure 2.
Correlation matrix of dataset features.

Figure 3.
Distribution of the targeted parameter.

Figure 4.
Distribution of the selected input parameters.

Figure 5.
The best prediction of complex symbolic regression model tree.

Figure 6.
Prediction quality of the symbolic regression based black-box model.

Figure 7.
Comparison between complex symbolic regression model and experimental data.

Figure 8.
Simplified symbolic expression tree.

Figure 9.
Comparison between simplified symbolic regression model and experimental data.

Figure 10.
Partial dependence of the simplified model.

Figure 11.
Relative frequency histogram of residuals error of simple symbolic expression.


Figure 13.
Theoretical and experimental behavior of the proposed model.


Table 1.
Analytical models of gaining strength of FRP confined concrete prisms.
| References | Formulations |
|---|---|
| Krevaikas and Triantafillou [21] | |
| Corradi et al. [19] | |
| Di Ludovico et al. [20] for Clay | |
| Di Ludovico et al. [20] for Tuff | |
| Faella et al. [14] (Simplest) | |
| Faella et al. [14] (More accurate) | |
| CNR-DT 200 R1 [35] | |
| Rao and Pavan [36] | |
| Ramaglia et al. [22] for Clay | |
| Ramaglia et al. [22] for Tuff | |
| Napoli and Realfonzo [37] (Simplest) | |
| Napoli and Realfonzo [37] (More accurate) |
Table 2.
Variation and statistical characteristics of main parameters.
| Parameters | Min | Max | Median | Average | Std. | 25th Percentile | 75th Percentile | Common Value | Num. Diff. Values |
|---|---|---|---|---|---|---|---|---|---|
| 1250 | 2000 | 1750 | 1656.50 | 172.43 | 1565 | 1750 | 1750 | 10 | |
| 115 | 550 | 250 | 274.52 | 87.68 | 240 | 290 | 250 | 38 | |
| 115 | 560 | 250 | 264.79 | 91.31 | 240 | 288 | 250 | 36 | |
| 1 | 2 | 1 | 1.06 | 0.21 | 1 | 1.01 | 1 | 7 | |
| 300 | 1760 | 500 | 559.07 | 251.32 | 485 | 511 | 500 | 29 | |
| 0.28 | 0.83 | 0.49 | 0.49 | 0.15 | 0.34 | 0.5 | 0.5 | 24 | |
| 0 | 85 | 20 | 20.77 | 13.03 | 10 | 25 | 20 | 10 | |
| 1371 | 4830 | 2560 | 2717.68 | 1019.51 | 1605 | 3500 | 1600 | 16 | |
| 65 | 673 | 143 | 163.08 | 106.96 | 70 | 230 | 230 | 13 | |
| 0.29 | 3.2 | 1.99 | 1.96 | 0.60 | 1.5 | 2.5 | 1.5 | 14 | |
| 0.117 | 0.96 | 0.379 | 0.41 | 0.20 | 0.24 | 0.48 | 0.48 | 22 | |
| 2 | 14.33 | 7.04 | 7.79 | 3.69 | 5.36 | 11.91 | 7.85 | 33 | |
| 0.32 | 51 | 0.51 | 0.95 | 4.67 | 0.46 | 0.57 | 0.49 | 23 | |
| 0.23 | 1 | 1 | 0.91 | 0.17 | 0.89 | 1 | 1 | 13 | |
| 0.04 | 1.57 | 0.45 | 0.54 | 0.38 | 0.23 | 0.76 | 0.23 | 55 | |
| 2.79 | 44.87 | 12.03 | 13.87 | 8.15 | 8.5 | 18.42 | 5.1 | 107 |
Table 3.
Parameters and their impacts in complex symbolic regression model.
| Parameters | Variable Impacts |
|---|---|
| 0.915 | |
| 0.272 | |
| 0.103 | |
| 0.035 | |
| 0.026 | |
| 0.010 | |
| 0.007 |
Table 4.
Statistical indictors for both training and test data.
| Indictors | Training Data | Test Data |
|---|---|---|
| R2 | 0.92 | 0.80 |
| ARE | 15.76% | 29.14% |
| MAE | 1.51 | 4.27 |
| MSE | 3.48 | 30.31 |
| RMSE | 1.87 | 5.51 |
Table 5.
Parameters and their impact in the simplified symbolic expression model.
| Parameters | Variable Impacts |
|---|---|
| 0.906 | |
| 0.179 | |
| 0.17 | |
| 0.145 |
Table 6.
Statistical indictors of simplified symbolic expression.
| Indictors | Value over Dataset |
|---|---|
| R2 | 0.91 |
| ARE | 16.82% |
| MAE | 1.86 |
| MSE | 5.93 |
| RMSE | 2.44 |
Table 7.
Statistical values of gaining strength of FRP confined concrete prisms.
| References | R2 | Average Relative Error (ARR) | Mean Absolute Error (MAE) | Mean Squared Error (MSE) | Root Mean Squared Error (RMSE) |
|---|---|---|---|---|---|
| Proposed formula | 0.91 | 0.16 | 1.86 | 5.94 | 2.44 |
| Krevaikas and Triantafillou [21] | 0.69 | 0.31 | 4.22 | 31.30 | 5.60 |
| Corradi et al. [19] | 0.75 | 0.40 | 4.09 | 29.35 | 5.42 |
| Di Ludovico et al. [20] for Clay | 0.79 | 0.23 | 2.75 | 13.46 | 3.67 |
| Di Ludovico et al. [20] for Tuff | 0.82 | 0.20 | 2.71 | 15.86 | 3.98 |
| Faella et al. [14] (Simplest) | 0.81 | 0.25 | 2.77 | 13.81 | 3.72 |
| Faella et al. [14] (accurate) | 0.82 | 0.20 | 2.47 | 12.30 | 3.51 |
| CNR-DT 200 R1 [35] | 0.82 | 0.28 | 3.08 | 16.42 | 4.05 |
| Rao and Pavan [36] | 0.79 | 0.23 | 2.77 | 13.64 | 3.69 |
| Ramaglia et al. [22] for Clay | 0.79 | 0.32 | 3.42 | 19.29 | 4.39 |
| Ramaglia et al. [22] for Tuff | 0.80 | 0.22 | 2.73 | 13.83 | 3.72 |
| Napoli and Realfonzo [37] (Simplest) | 0.81 | 0.18 | 2.29 | 12.67 | 3.56 |
| Napoli and Realfonzo [37] (accurate) | 0.82 | 0.18 | 2.33 | 13.19 | 3.63 |
Table 8.
Statistical analysis of FRP confined concrete prisms models.
| References | Average (Prediction/Experimental) | COV (%) | Number of Predictions Less than 10% Error | Highest Prediction | Lowest Predictions |
|---|---|---|---|---|---|
| Proposed formula | 1.03 | 22.4 | 53 | 1.74 | 0.46 |
| Krevaikas and Triantafillou [21] | 0.82 | 37.2 | 16 | 3.12 | 0.23 |
| Corradi et al. [19] | 1.33 | 32.3 | 10 | 4.56 | 0.4 |
| Di Ludovico et al. [20] for Clay | 1.05 | 28.2 | 14 | 3.36 | 0.32 |
| Di Ludovico et al. [20] for Tuff | 0.95 | 24.5 | 24 | 2.69 | 0.3 |
| Faella et al. [14] (Simplest) | 1.16 | 26.2 | 12 | 3.55 | 0.34 |
| Faella et al. [14] (accurate) | 1.00 | 24.6 | 16 | 2.95 | 0.29 |
| CNR-DT 200 R1 [35] | 1.23 | 24.6 | 9 | 3.46 | 0.37 |
| Rao and Pavan [36] | 1.04 | 28.4 | 16 | 3.37 | 0.32 |
| Ramaglia et al. [22] for Clay | 1.26 | 27.1 | 10 | 3.33 | 0.42 |
| Ramaglia et al. [22] for Tuff | 1.01 | 27.1 | 17 | 3.1 | 0.31 |
| Napoli and Realfonzo [37] (Simplest) | 1.05 | 23.3 | 12 | 2.59 | 0.35 |
| Napoli and Realfonzo [37] (accurate) | 1.01 | 23.4 | 16 | 2.6 | 0.33 |
Disclaimer/Publisher’s Note: The statements, opinions and data contained in all publications are solely those of the individual author(s) and contributor(s) and not of MDPI and/or the editor(s). MDPI and/or the editor(s) disclaim responsibility for any injury to people or property resulting from any ideas, methods, instructions or products referred to in the content. |
© 2023 by the authors. Licensee MDPI, Basel, Switzerland. This article is an open access article distributed under the terms and conditions of the Creative Commons Attribution (CC BY) license (https://creativecommons.org/licenses/by/4.0/).
Share and Cite
MDPI and ACS Style
Alotaibi, K.S.; Islam, A.B.M.S. Symbolic Regression Model for Predicting Compression Strength of Prismatic Masonry Columns Confined by FRP. Buildings 2023, 13, 509. https://doi.org/10.3390/buildings13020509
AMA Style
Alotaibi KS, Islam ABMS. Symbolic Regression Model for Predicting Compression Strength of Prismatic Masonry Columns Confined by FRP. Buildings. 2023; 13(2):509. https://doi.org/10.3390/buildings13020509
Chicago/Turabian StyleAlotaibi, Khalid Saqer, and A. B. M. Saiful Islam. 2023. "Symbolic Regression Model for Predicting Compression Strength of Prismatic Masonry Columns Confined by FRP" Buildings 13, no. 2: 509. https://doi.org/10.3390/buildings13020509
Note that from the first issue of 2016, this journal uses article numbers instead of page numbers. See further details here.