
Stress Analysis of 2D-FG Rectangular Plates with Multi-Gene Genetic Programming


1
Department of Mechanical Engineering, Erciyes University, Kayseri 38039, Turkey
2
Mul2 Group, Department of Mechanical and Aerospace Engineering, Politecnico di Torino, 10154 Torino, Italy
3
Department of Computer Programming, Cappadocia University, Nevşehir 50402, Turkey
4
Intelligent Systems Research Group, Engineering Faculty, Erciyes University, Kayseri 38039, Turkey
5
Department of Software Engineering, Sivas Cumhuriyet University, Sivas 58140, Turkey
*
Author to whom correspondence should be addressed.
Appl. Sci. 2022, 12(16), 8198; https://doi.org/10.3390/app12168198
Submission received: 1 June 2022
/
Revised: 25 June 2022
/
Accepted: 11 August 2022
/
Published: 16 August 2022
(This article belongs to the Special Issue Genetic Programming, Theory, Methods and Applications)
Abstract
:Functionally Graded Materials (FGMs) are designed for use in high-temperature applications. Since the mass production of FGM has not yet been made, the determination of its thermo-mechanical limits depends on the compositional gradient exponent value. In this study, an efficient working model is created for the thermal stress problem of the 2D-FG plate using Multi-gene Genetic Programming (MGGP). In our MGGP model in this study, data sets obtained from the numerical analysis results of the thermal stress problem are used, and formulas that give equivalent stress levels as output data, with the input data being the compositional gradient exponent, are obtained. For the current problem, efficient models that reduce CPU processing time are obtained by using the MGGP method.
1. Introduction
As space technologies have evolved, the use of conventional composites has been limited. Therefore, FGM is suggested as an effective material idea for ultimate thermal and mechanical loads. FGM is metal on one side and ceramic on the other, and the composition changes depending on the volume fraction. Thus, the thermal resistance of the ceramic and the strength of the metal are utilized at the maximum level.
In the last two decades, many studies have been conducted on the determination of the mechanical behavior of FGMs [1,2,3,4,5,6,7,8]. However, due to the difficulties encountered in production, the use of FGMs in the industry has been limited [9,10]. Therefore, many studies have focused on finding the optimum compositional gradient exponents that determine the volumetric distribution theoretically [11,12,13,14,15,16].
However, although mass production has not yet been made for FGM, polymer and metal-based FG materials have started to be produced with the spread of additive manufacturing methods and these studies have begun to take place in the technical literature [17,18,19,20].
Moita et al. [21] used a gradient-based optimization algorithm for material distribution and sizing in free vibration and linear buckling problems of FGMs. Mantari and Monge [22] used a new optimized hyperbolic displacement in combination with Carrera’s Compound formulation for free vibration and buckling problems of FGM sandwich plates. Ashjari and Khoshravan [23] investigated mass optimization of FGM for stress analysis of the bending fraction. They applied genetic algorithms and herd optimization to the models they designed. As a result, they emphasized that particle swarm optimization outperforms the genetic algorithm when we look at the convergence rate and accuracy. Nazari et al. [24] tried to estimate the core thickness and volume ratio and the three-dimensional natural frequency of the FGM sandwich rectangular plate with the Meshless Local Petrov-Galerkin Method and Artificial Neural Networks (ANNs). Roque and Martins [25] used the Differential Evolution (DE) algorithm as a guide to finding the optimum design in the free vibration analysis of FG nanobeams. Correia et al. [26] optimized the minimum mass and minimum material cost for the FGM plates. The Simulated Annealing (SA) method is used to find the optimal design of the FGM. They emphasized that this model is easily applicable for different metal and ceramic materials within the p-index and production constraints. Maciejewski and Mroz [27] investigated the optimal composition of complex shaped FGM for thermomechanical behavior. Nguyen and Lee [28] modeled a thin-walled FG beam under buckling for beam section and material optimization.
Innovative materials, which are used in sensitive machine elements and materials under critical operating conditions and whose structure can change according to the problem, are gaining more and more importance day by day. For this reason, optimization approaches that reach the right result in effective time have been developed for different problems at certain limit values. Studies aimed to find the optimum material composition or lead the optimization in different methods such as artificial neural network, hybrid algorithms, multi-object, iso-geometric, topology optimization [29,30,31,32,33,34,35,36,37]. Genetic programming provides a formula by facilitating the solution path in numerical or non-numerical problems, so that the solutions to be obtained as a result of long efforts are simplified. The performance of genetic programming is tested and applied to capacity estimation, hydrology, multidimensional problems. Since it is a new method, there are very few studies in the field of FGM [38,39,40,41,42,43,44]. When the genetic programming applied in composite materials is examined; There are studies such as coating quality, strength, and frequency of the material. Some of these studies are exemplified below.
Gu et al. [45] used deep learning and genetic programming to predict the bond strength capacity in adhesive joints used in composite plates. They emphasized that in both developed models, optimum structure and material design are estimated efficiently. According to Dehestani et al. [46] estimated the microhardness of the Ni/Al2O3 nanocomposite coating with the model created by combining genetic programming and genetic algorithm methods in gene expression programming (GEP).
Shakeri [47] created a mathematical model with genetic programming and investigated the relationship between the coating quality of the composite material and the coated weight. With this model, the relationship between the coating material and coating time, and coating quality is determined. According to Punugupati et al. [48] investigated the effect of porosity on the flexural strength of composite material under load. Using MGGP, they created an efficient model between flexural strength and ceramic porosity, and solid loading. According to Sharif et al. [49] proposed a genetic programming model to reduce the magnetic resonance of composite materials. They noted that the model in GP outperformed the methods previously suggested in the literature. According to Demirbas et al. [50] found the relationship between the thermo-mechanical behavior of GP and 1-D FG rectangular plates and the material composition by constructing a model. They showed that the formulas and equations reached by GP converged to the real values at a high rate and the numerical analysis time became efficient.
In this study, an efficient working model was created by obtaining data sets with compositional gradient exponent values in both directions using MGGP and equivalent stress levels found by the finite difference method (FDM) of the 2D-FG plate. In these models, the input data is the compositional gradient exponent and the output data are equivalent stress levels, and formulas that give the relationship between input and output with MGGP models are obtained, thus reducing CPU processing time.
2. Optimization Method and Materials
2.1. Functionally Graded Materials
Although composite materials are more efficient than conventional materials depending on the operating conditions, discontinuities in the material transition zones cause cracks and stress concentrations. To regulate this situation, a gradual transition is achieved by providing volumetric control of the material in FGM, and stress concentrations and discontinuity regions can be reduced. For these materials, it is important to determine the optimum composition, that is, the composition gradient exponent, in order to provide the desired properties in the desired area [51].
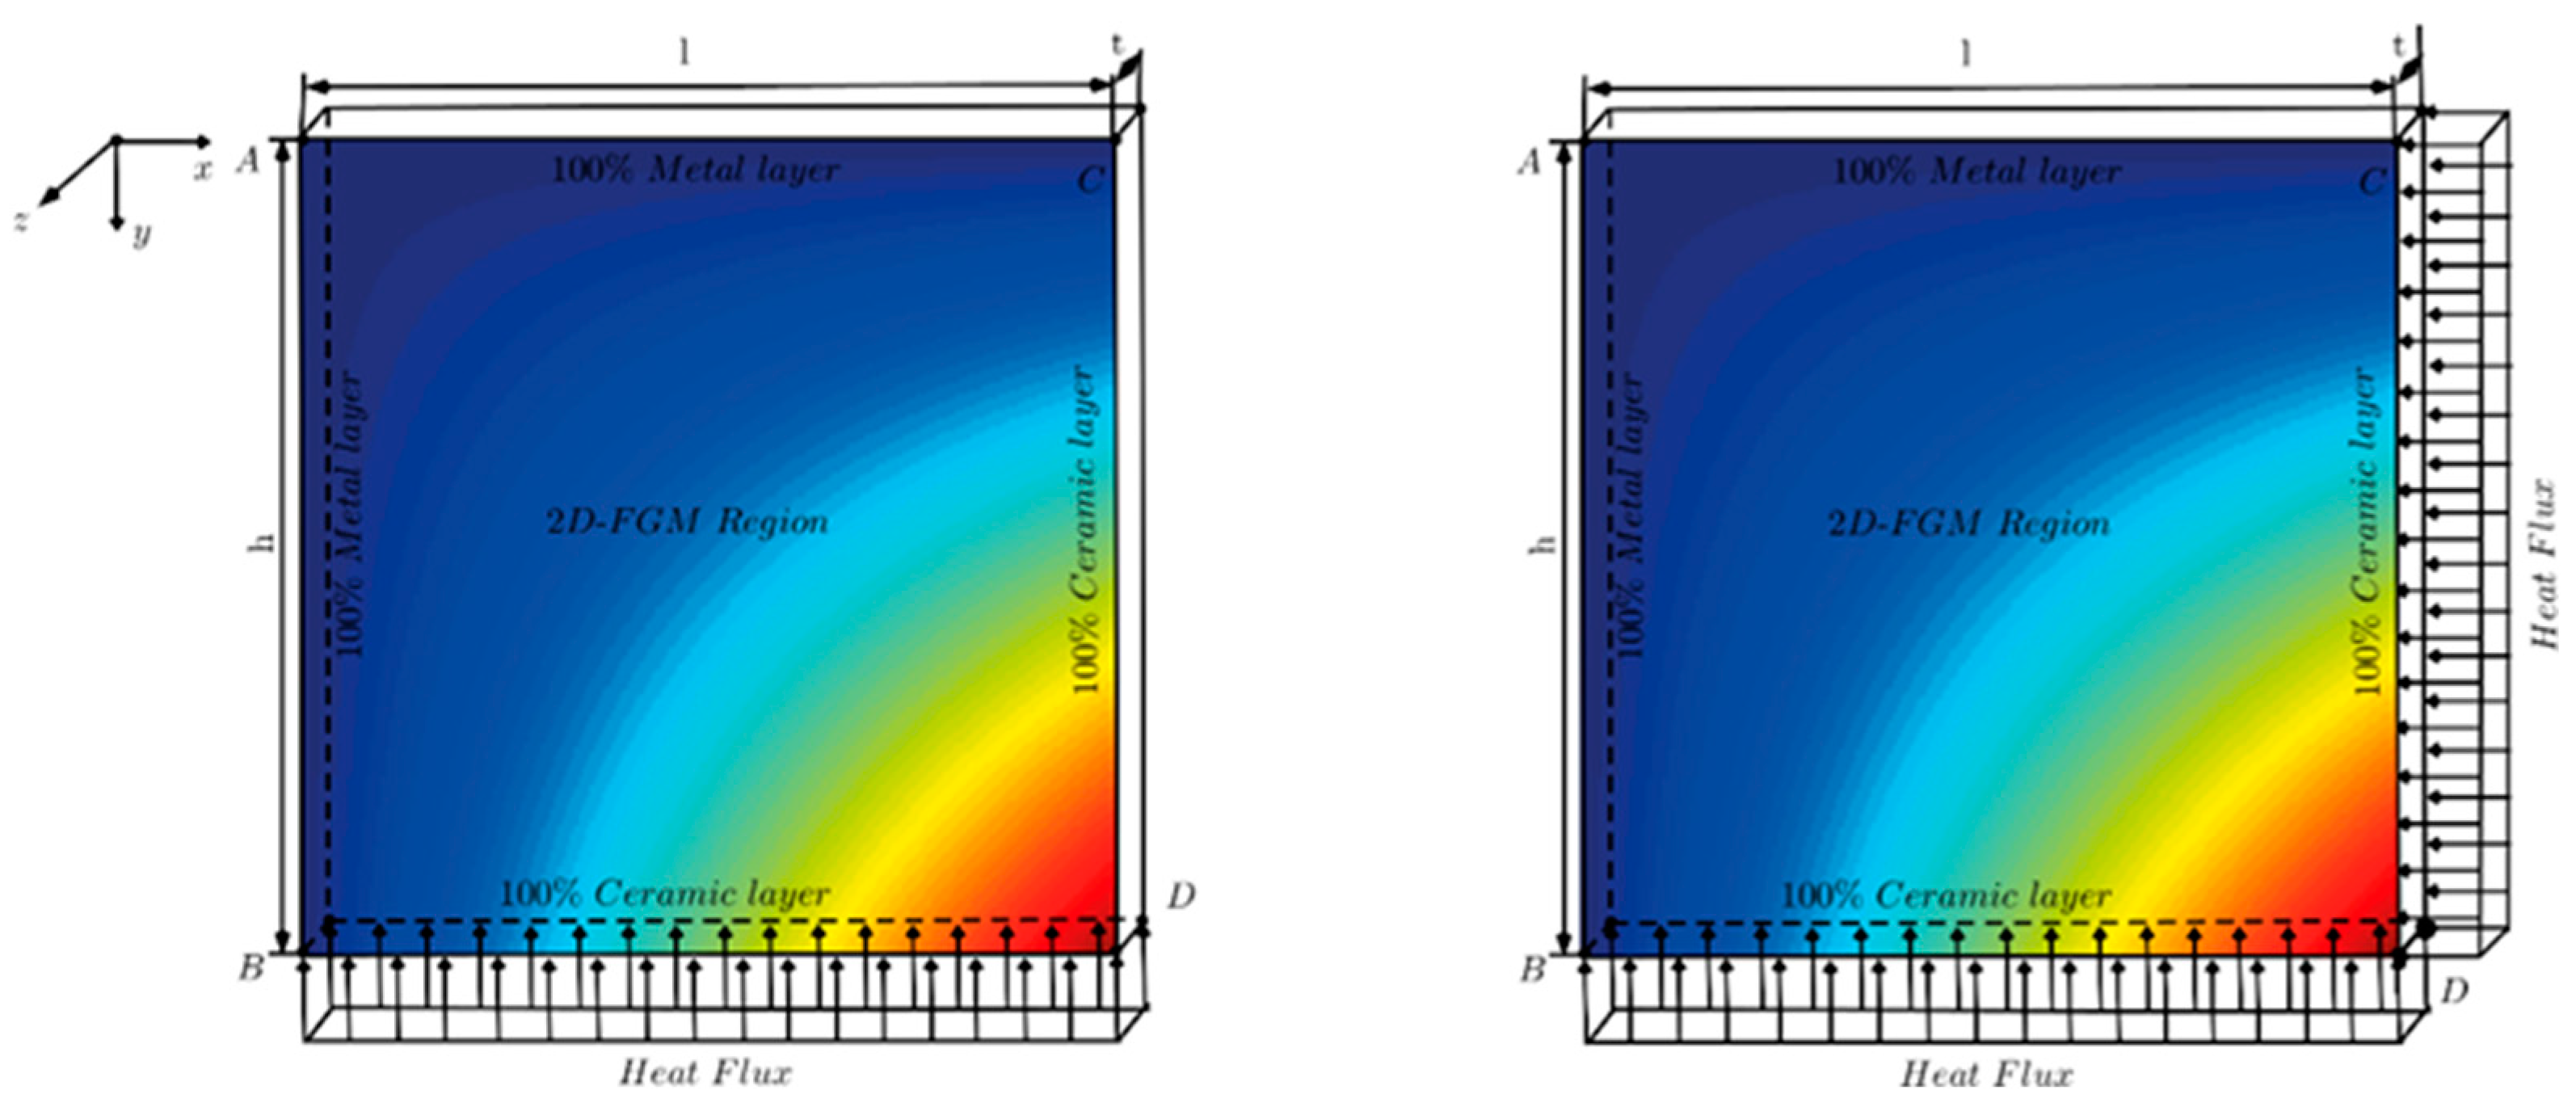
Figure 1 shows the variation of the compositional gradient exponent of the 2D-FGM material. Here, the compositional gradient exponent values n, m represents the change in the x-direction and y-direction, respectively. Equations (1) and (2) show the ceramic volume ratio (Vc), and the metal volume ratio (Vm), respectively.
In the 2D-FG plate problem discussed in this paper, stratification is performed according to the power law and the variation of material properties is discussed according to the Mori-Tanaka scheme [52], which is the mean-area micro-mechanical model. These models are suggested theoretically and errors that may occur in FG production are not included in the calculations [53].
Figure 1.
2D-FGM rectangular plate for different boundary conditions [54].
Figure 1.
2D-FGM rectangular plate for different boundary conditions [54].

2.2. Optimization Method
2.2.1. Genetic Programming
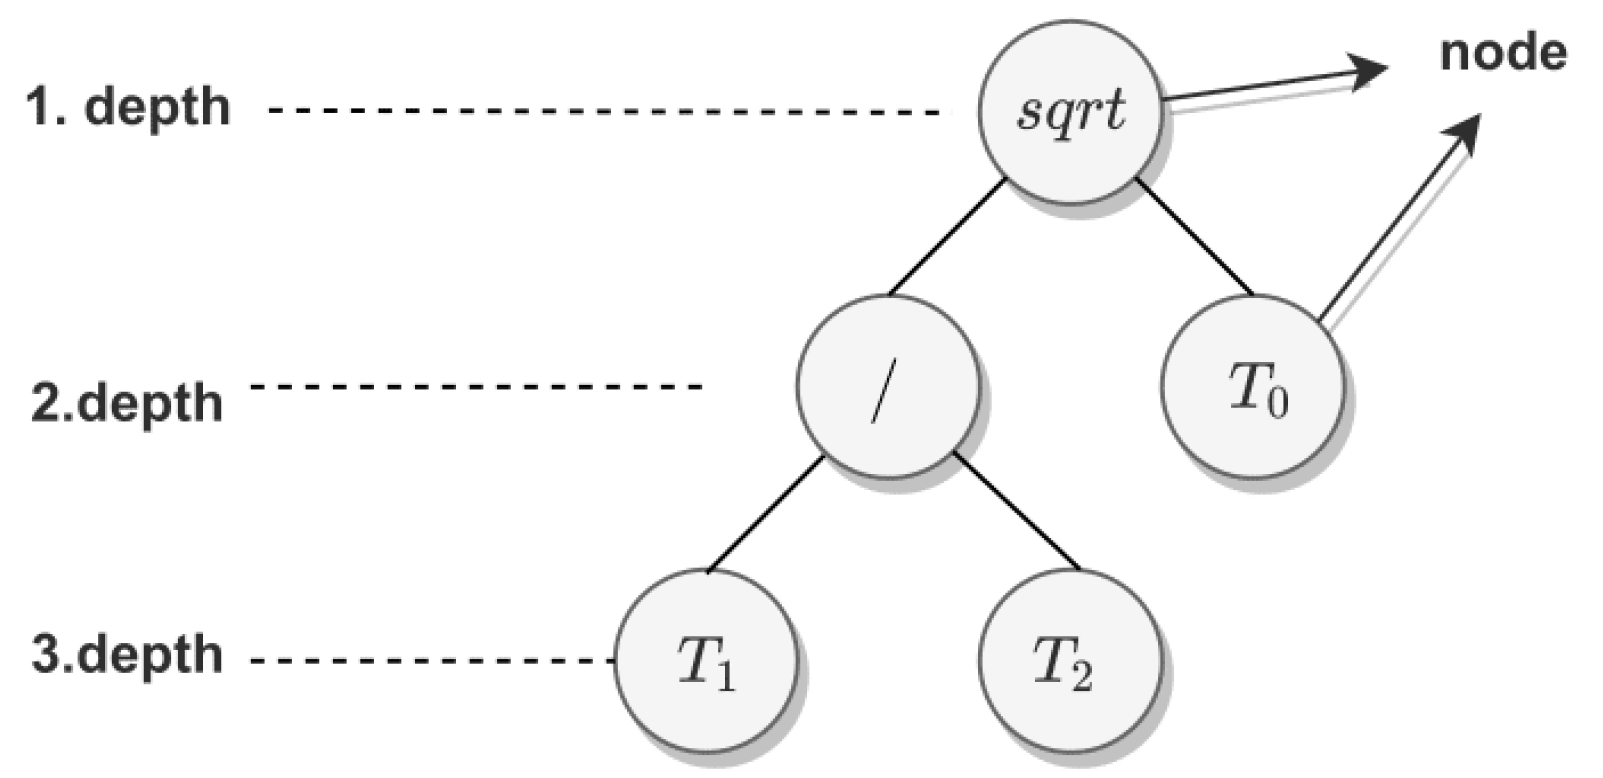
Genetic programming (GP) is established as an algorithm-based intuitive method inspired by operators (crossing, mutation, and selection) that form the basis of the genetic algorithm. However, individuals are mathematical functions operations keep going similar to a tree structure. The simple tree structure of GP is shown in Figure 2. Nodes and depths are indicated on the tree structure in Figure 2.
Ramped half-and-half unitizes the full and grow method to form the tree structure. The full method finishes the length between the initiating node and end node with the specified maximum depth of the tree. In the grow method, the nodes are randomly selected until the maximum tree depth is specified. The half-and-half method, mixed-method, uses 50% full method and 50% grow method. In different problem types, this method has been widely used in the literature [56].
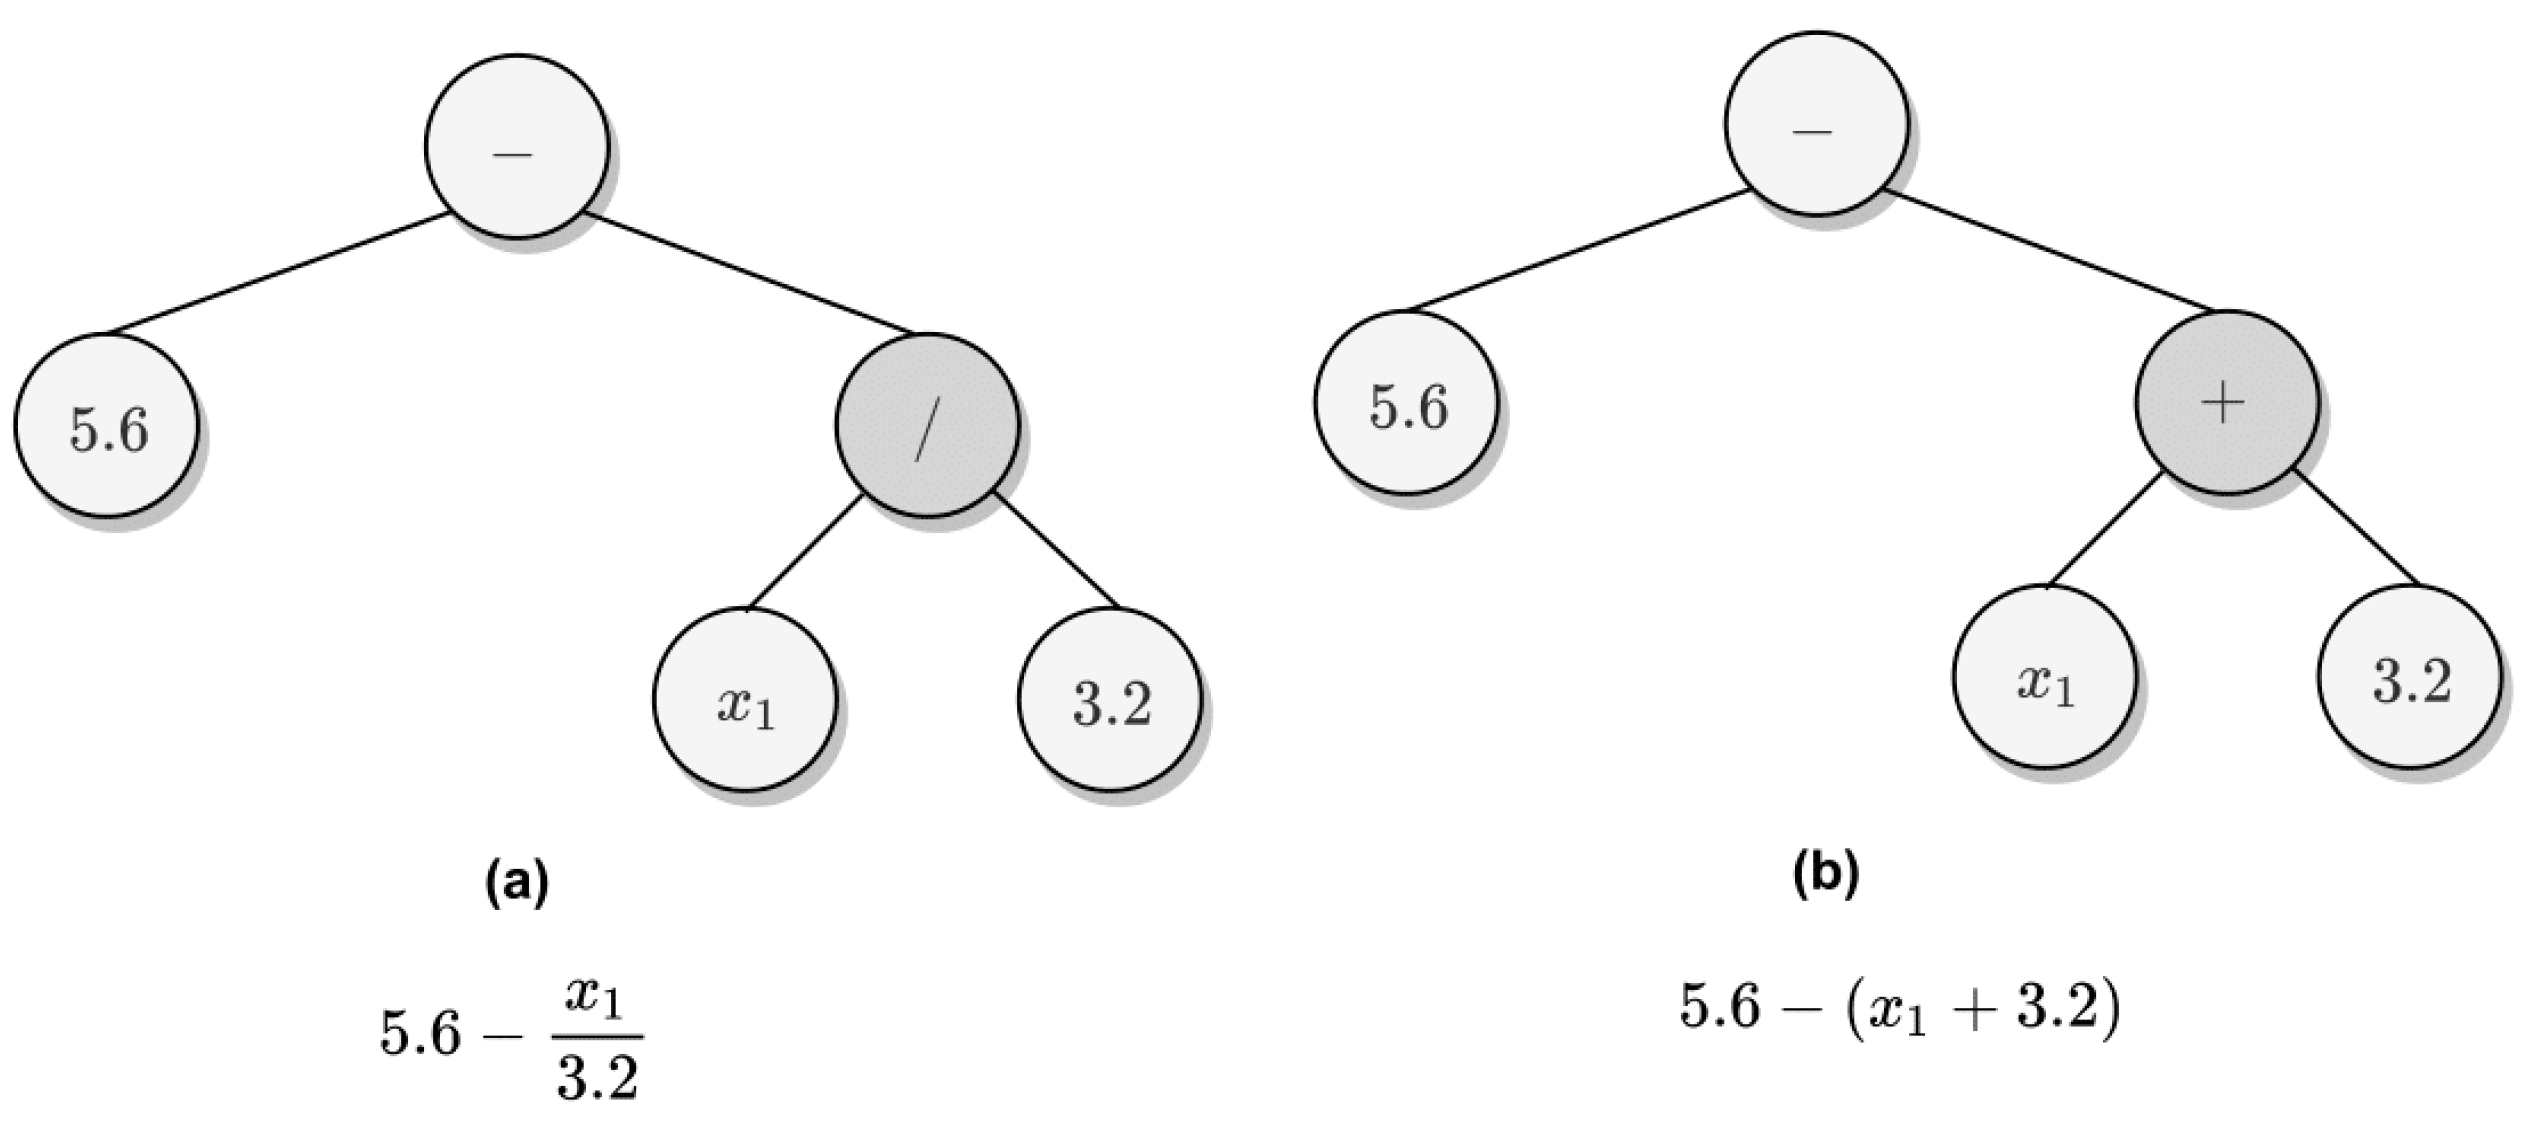
In the Mutation process, the node point over the individual which is chosen randomly is changed. Then it will advance from the node point until the tree depth [57]. The mutation process is shown as before and after in Figure 3.
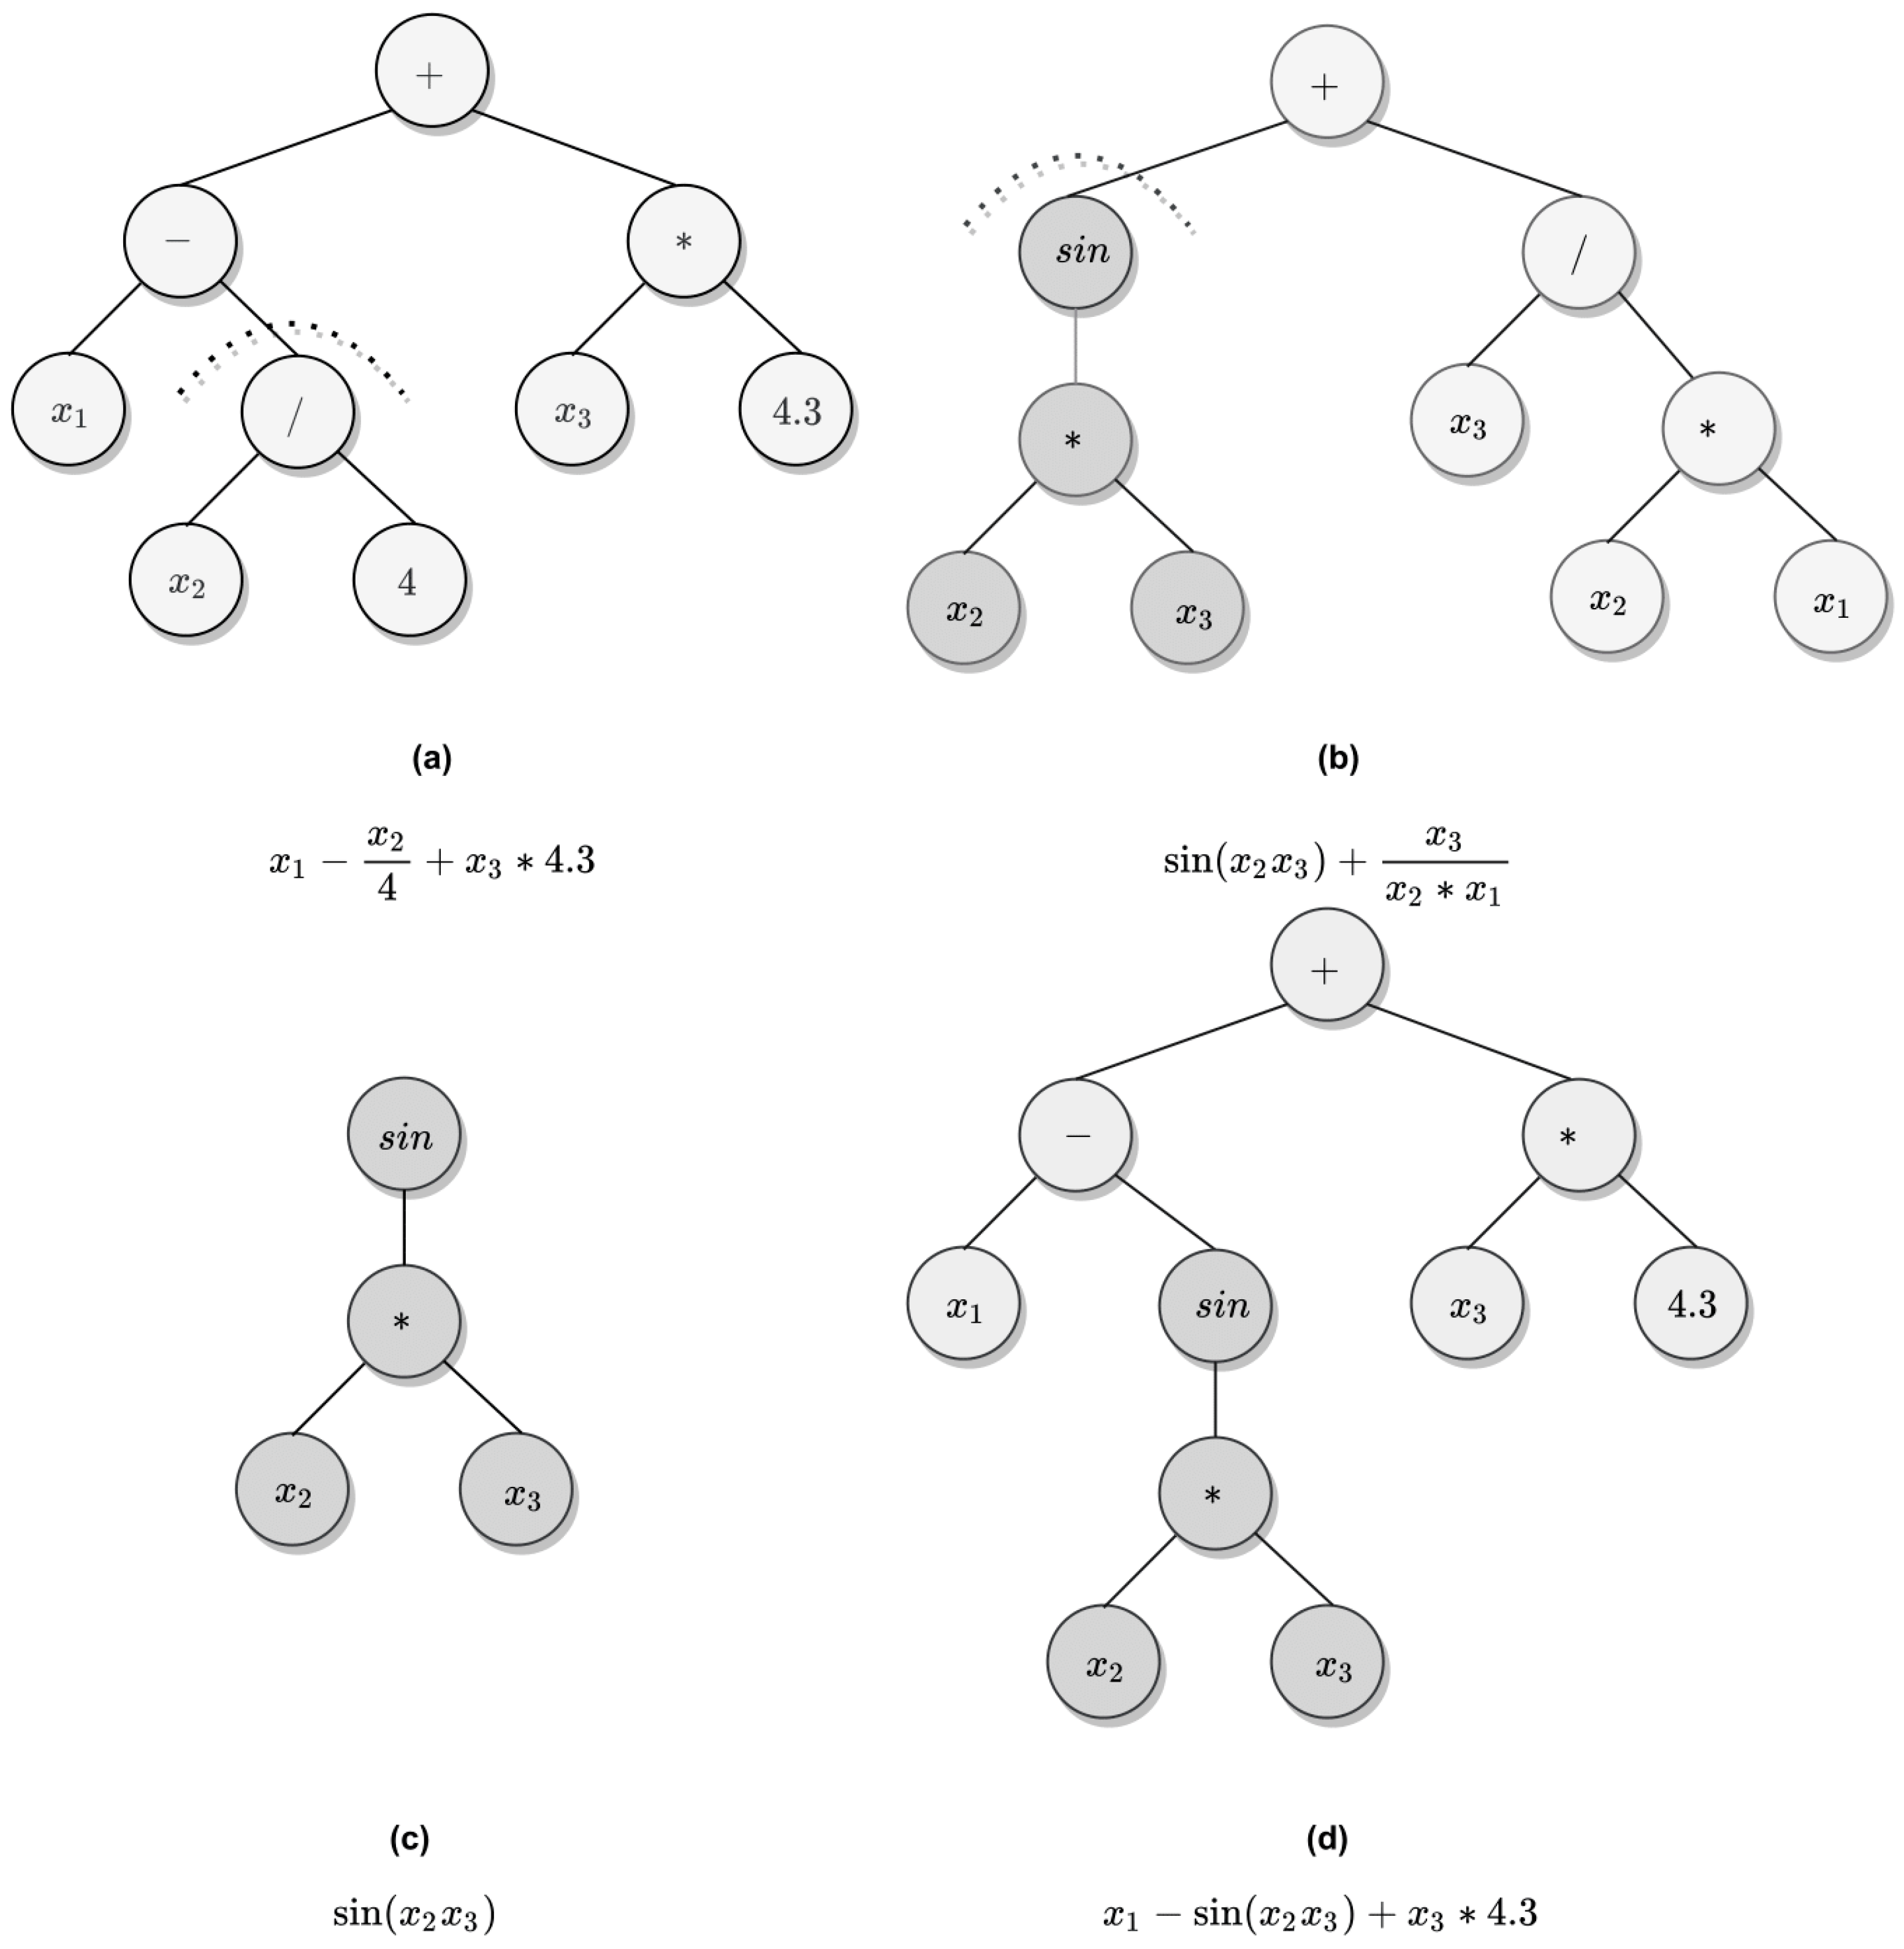
In the Crossover process, two individuals are selected in the population. Selected random nodes over the individual are modified between individuals. The crossover process is shown as before and after in Figure 4.
In the selection process, like the evolution algorithm, GP works with the logic which is selecting the strongest in nature. Individuals are selected with identified fitness function and fitness value. Later, selected individuals are copied to a new generation. Fitness function is evaluated by the Root Mean Square Error (RMSE) on both the training set and the test set. The fitness function is shown in Equation (3), and n is the data size, yactual is y values from the data set, ypred is the estimated y value obtained by entering the values of the solution. The complexity of the model is calculated as in Equation (4) in proportion to the depth of the tree and the number of nodes. C is tree complexity, d is the depth of the solution tree, and n is the number of nodes at depth.
2.2.2. Multi Gene Genetic Programming
MGGP process, unlike GP, produces more than one gene simultaneously and combines these genes with the help of a bias to form a linear function. Moreover, all other processes are applied in the same way.
For example, Table 1 shows how model 1 produces the equation to illustrate multi-gene genetic programming in more detail. Simultaneously, MGGP, which produced four genes, is progressed until four depths of the tree. The created four functions are multiplied with weights for the model as a linear function then formulation is finished with adding weight bias value to function. Overall genes, genetic programming operators are applied.
2.2.3. Experimental Design
In our numerical analysis problem, the ceramic material of the 2D-FG plate is ZrO2 and the metal material is Ti-6Al-4V. The dimensions of the plate are l = 100 mm and h = 100 mm and the thickness is t = 1 mm. Since the plate thickness is thinner than the other dimensions, all stresses and deformations occurring throughout the thickness are neglected during the analysis, so the problem is considered as 2D. Two different boundary conditions are applied to the 2D-FG plates. In the first boundary condition (model 1), with an initial temperature of 298 K, a heat flux of 50 kW/m2 from the BD edge is applied to the plate until the temperature at the AC edge is 600 K. In the second boundary condition (model 2), with an initial temperature of 298 K, 50 kW/m2 heat fluxes from the BD and CD edges are applied to the plate until the temperature at the AC edge is 600 K. The heat transfer analysis problem is solved with the time-dependent Fourier heat conduction equations and the temperature distribution matrix for the last time step is transferred to the Navier’s equations of elasticity and the thermo-mechanical behavior is determined. FDM is used in numerical analysis and datasets are obtained for MGGP. The input values of the MGGP are analyzed for 200 different values, with compositional gradient exponents in the range of n and m = 0.0001–1.5. In the analyzes made with FDM, it has been recorded that the CPU time is approximately 2 h. Optimization in thermal stress analysis is made by taking (the greatest of the greatest value of equivalent stress levels), (the smallest value of the greatest value of the equivalent stress levels), (the greatest value of the smallest value of the equivalent stress levels), (the smallest value of the smallest value of the equivalent stress levels) value into consideration [59]. These are added as output values into the dataset in MGGP. Determined input and output values, i.e., datasets, are split with randomly selected 70% of the datasets for training and the other 30% for the test set.
In this study, a model which used the GPTIPS code of Matlab is created for MGGP [59]. Unfortunately, a definite method to determine MGGP setting parameters’ value is not possible [50]. The parameters of MGGP, are based on a trial-and-error approach, are shown in Table 2. The divide (/) function is protected, i.e., it returns ‘1’ when it is divided by ‘0’.
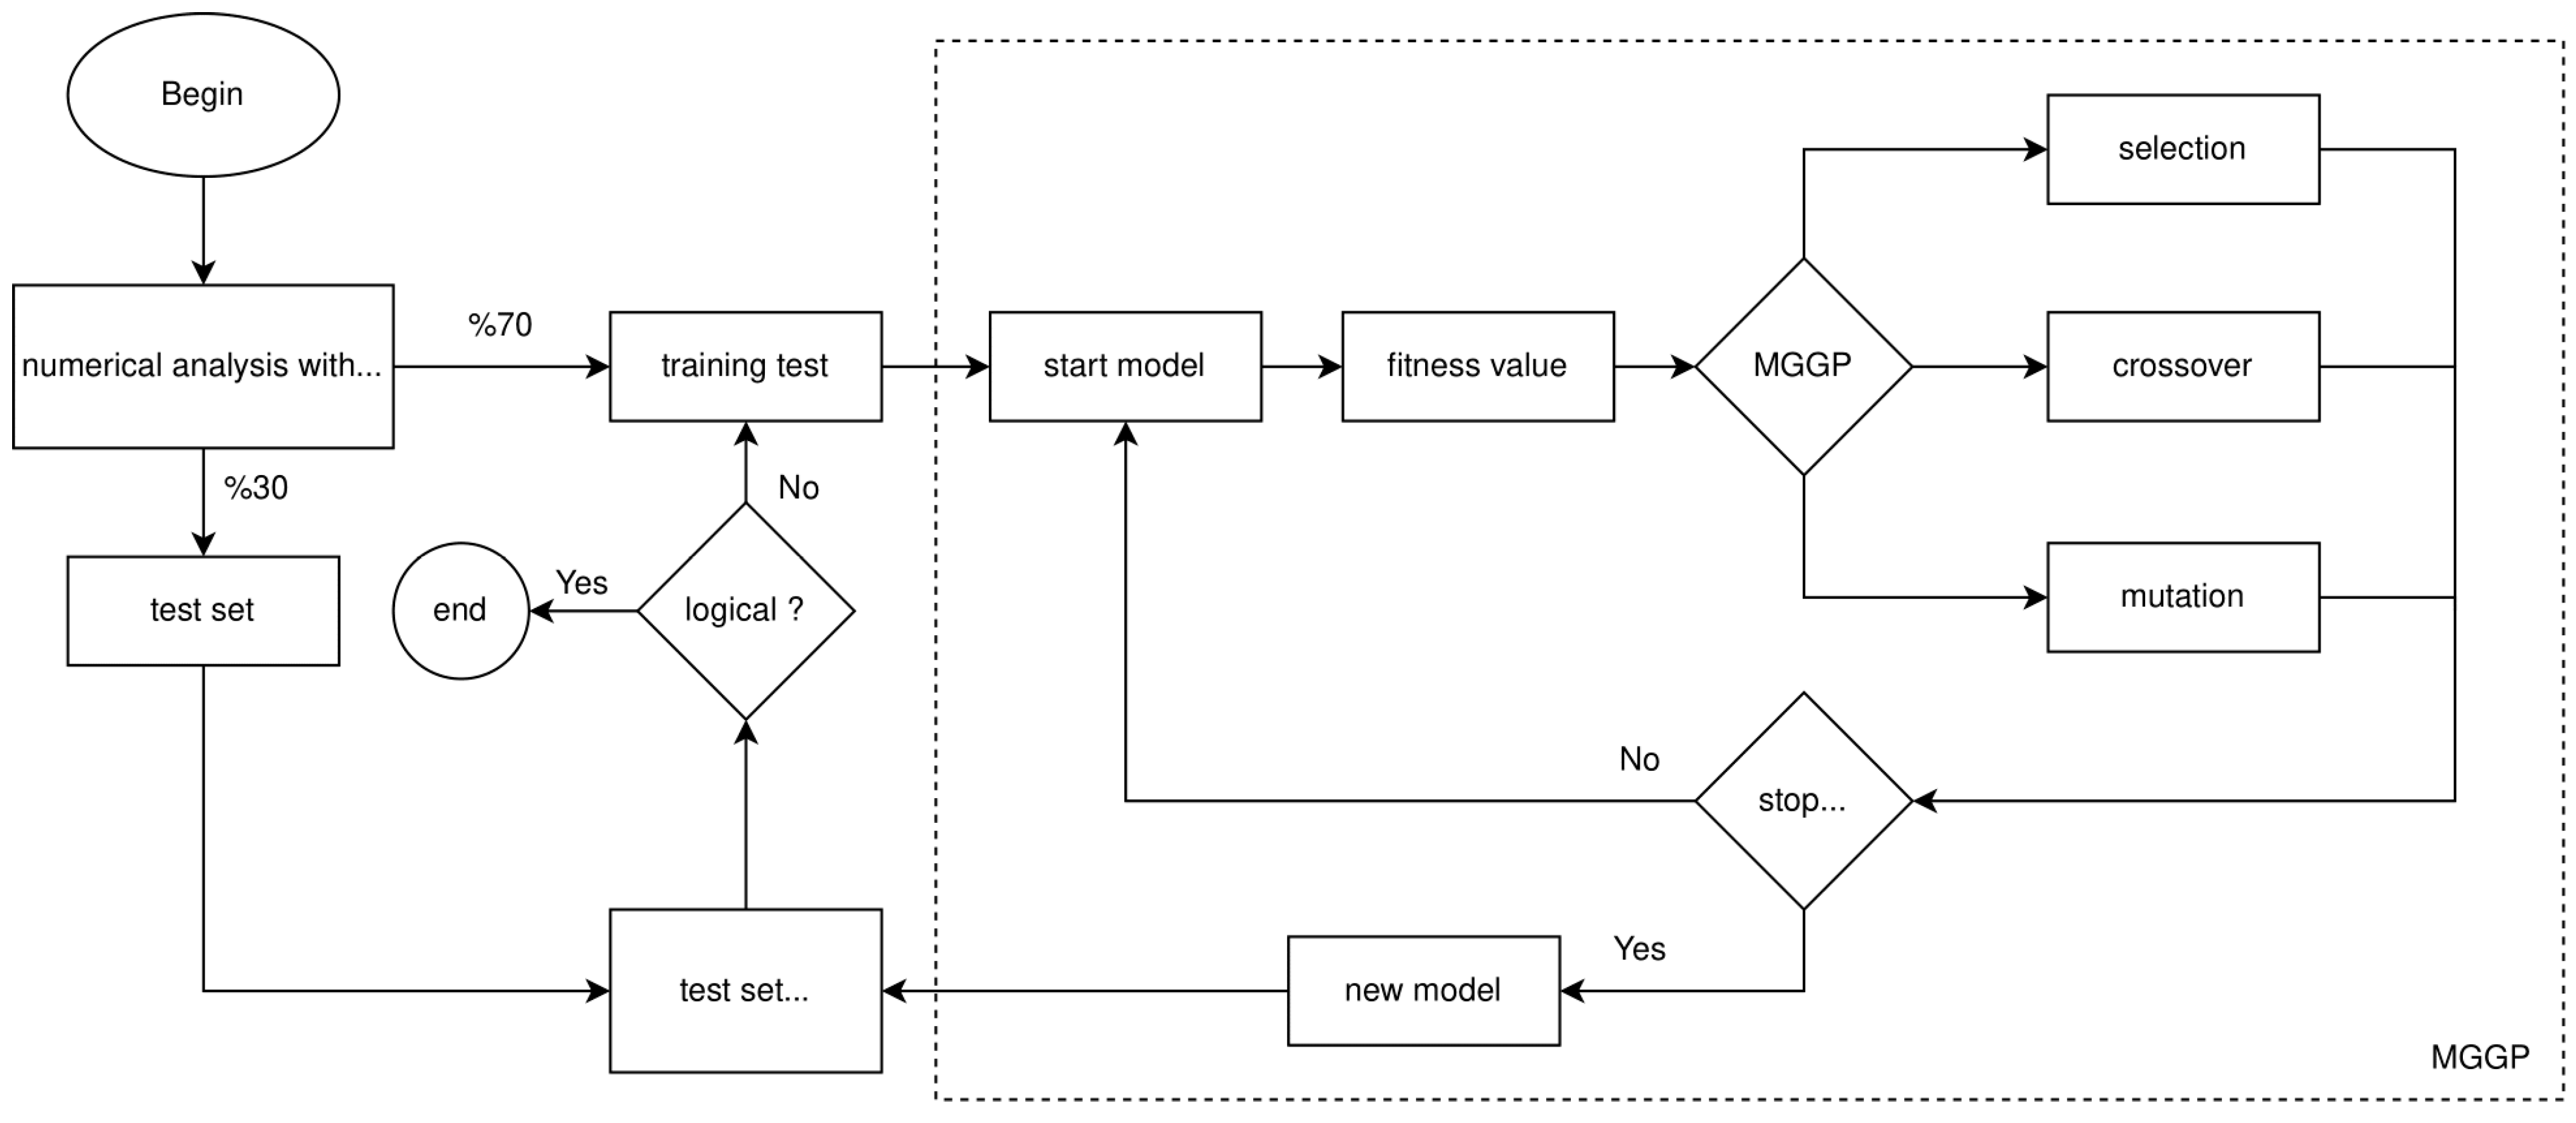
In general, to express the optimization method, the model is created with the training set data. And then, one of the MGGP operators is selected according to the determined fitness value. The initial model is updated until stop criteria are met. When the stopping criteria are met, it means a new model is created. The new model is analyzed using the test data. And if the results are reasonable, the program is stopped. Otherwise, the program continues from the training set. The flow diagram of optimization is shown in Figure 5.
3. Application in GP Programming
Performance of MGGP can be determined by fitness, maximum error, minimum error, and standard deviation. These are created after training value and test value. Table 3 shows the simulation results of Model 1 and Model 2. In Model 1, best fitness value , maximum error value , minimum error value and standard deviation are found in training results. In Model 2, best fitness value , maximum error value , minimum error value and standard deviation are found in training results. In Model 1, best fitness value , maximum error value , minimum error value and standard deviation are found in test results. In Model 2, best fitness value , maximum error value , minimum error value and standard deviation are found in test results. When we look at these values, we see that best produced equivalent stress value is for Model 1 and for Model 2.
Table 4 contains information on tree structures of the best models of Model 1 and Model 2. When all stress values are examined, gene and tree depths are reached at maximum values. When tree depth investigated by complex structure and node number, least node and minimum complex structure are seen in for Model 1 and in for Model 2. When all the models are studied, the most complex structure and maximum number of nodes occurred in of Model 2.
In our study, the best equations of MGGP are shown in Table 5. As we have explained in the other tables, the most complex equations are seen in in Model 2. All equations can be used as a guide in optimization for researchers.
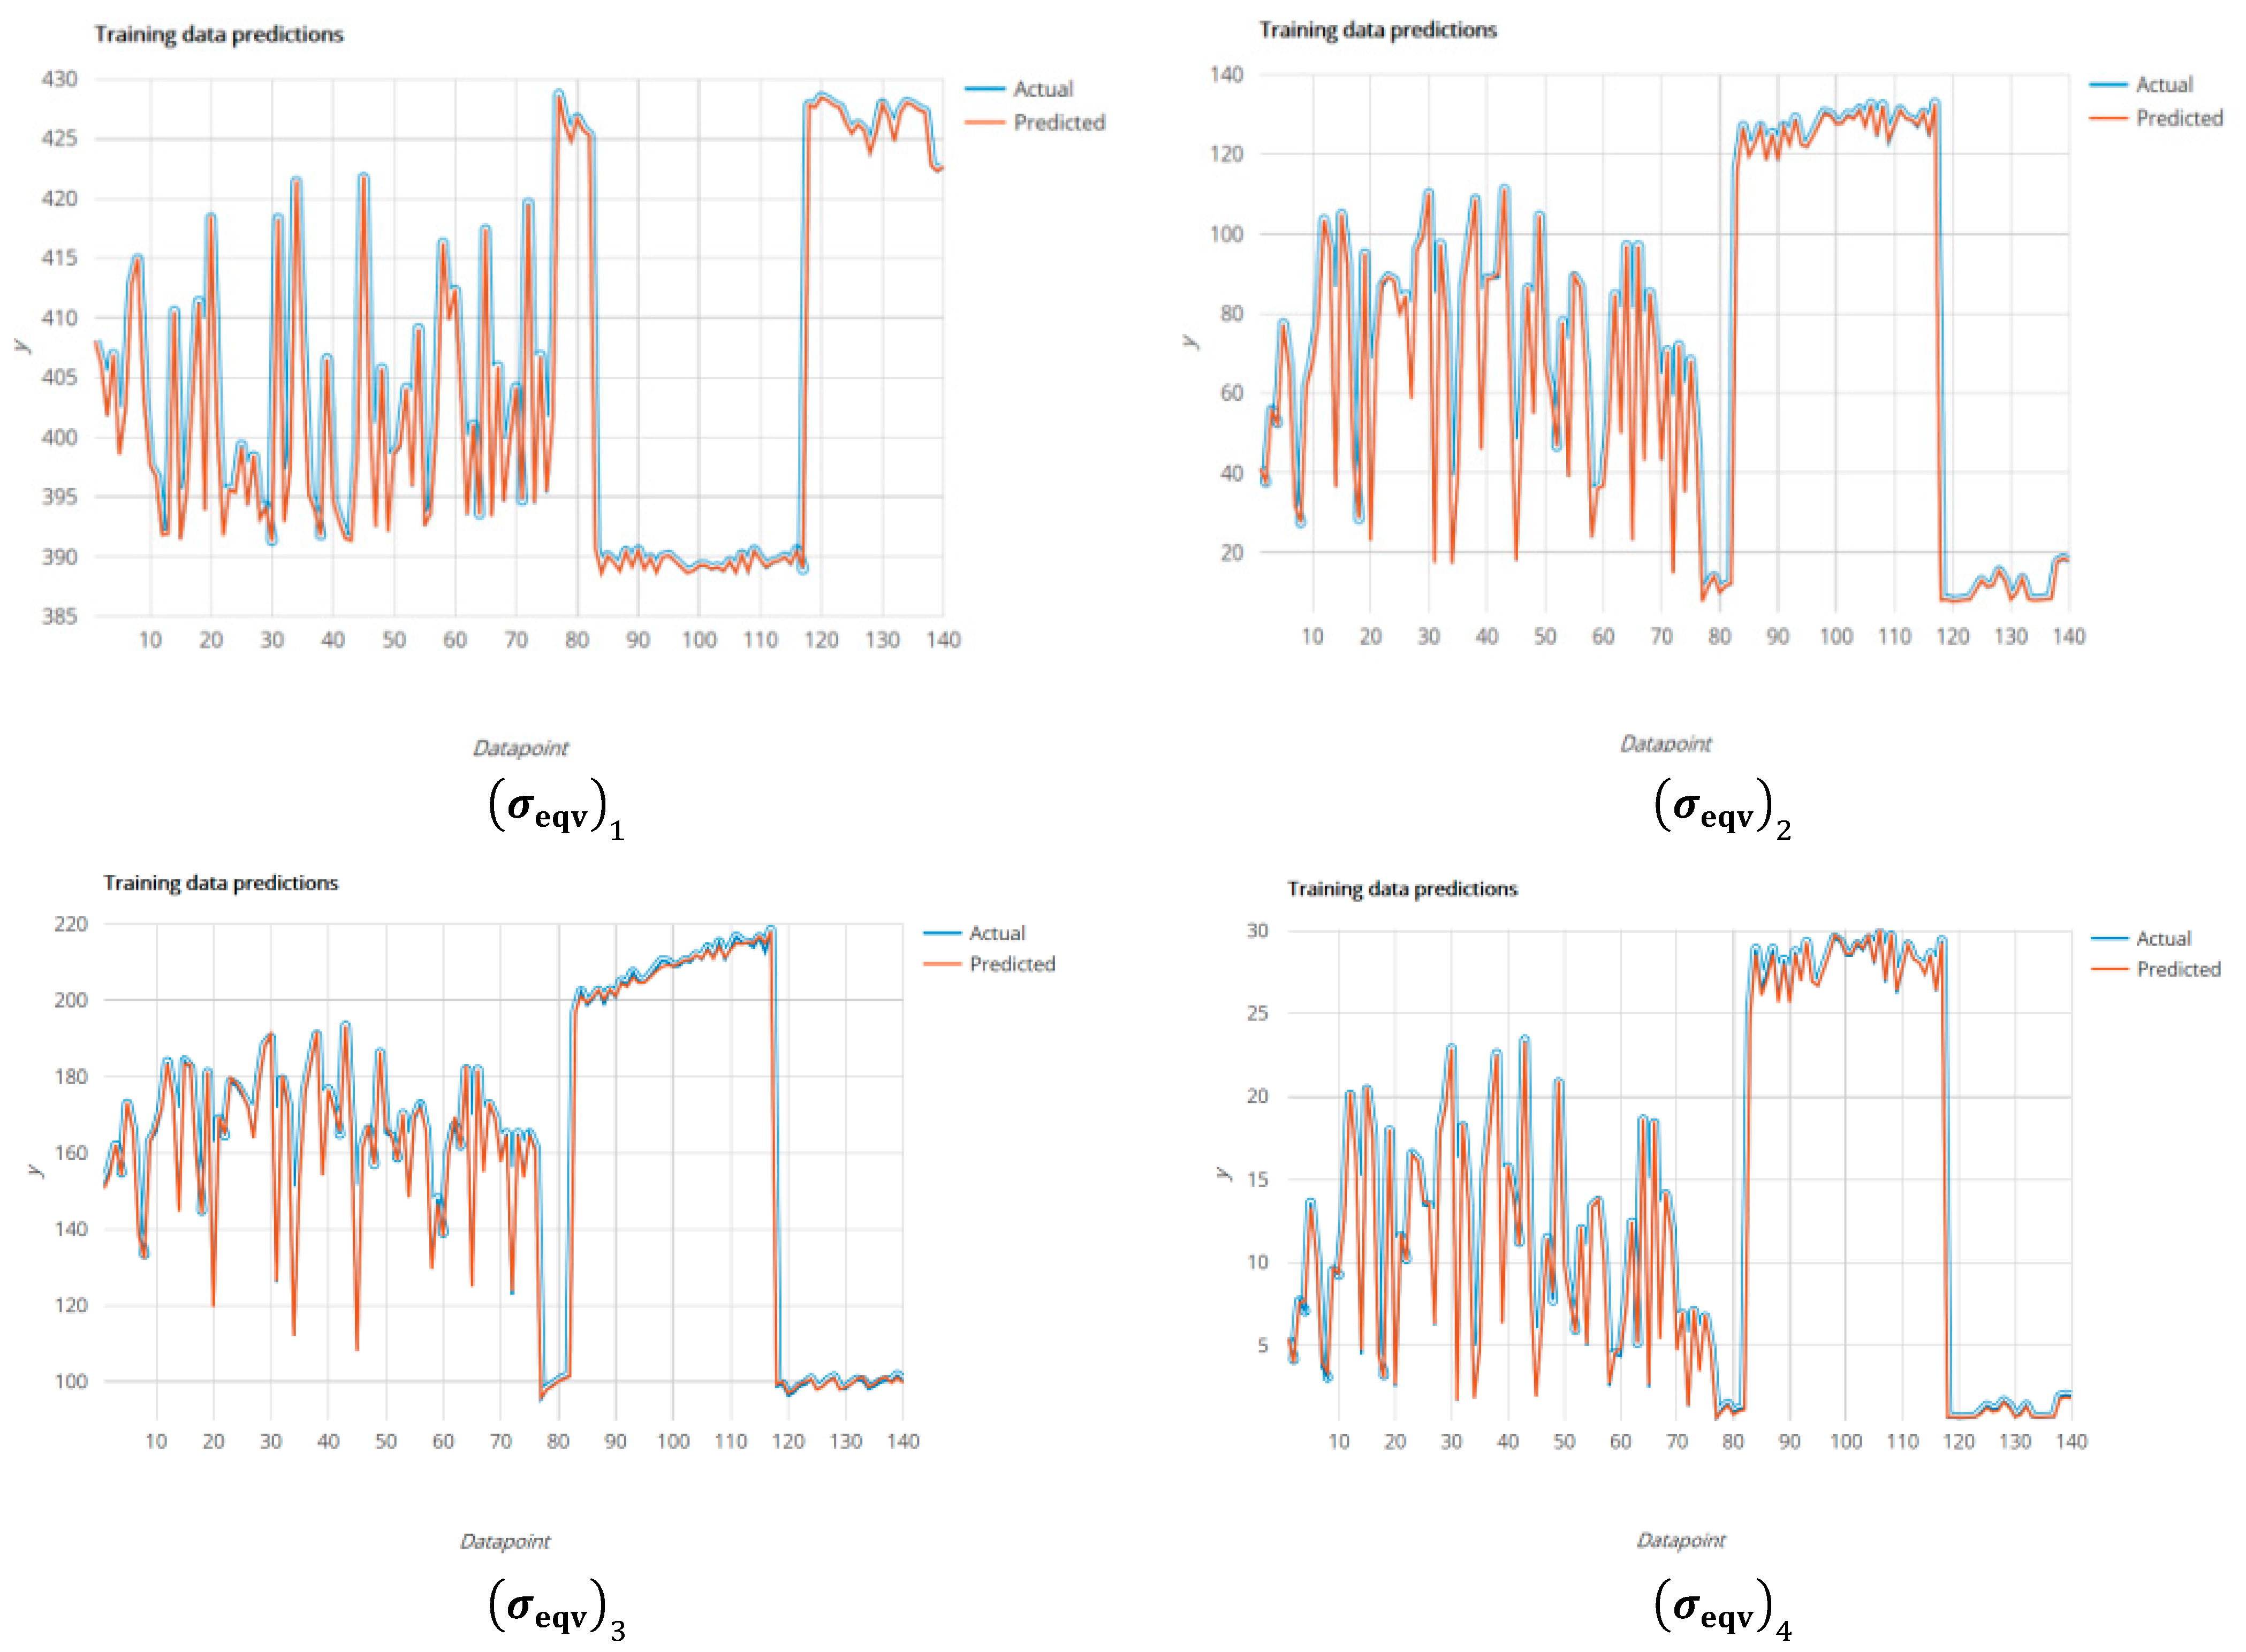
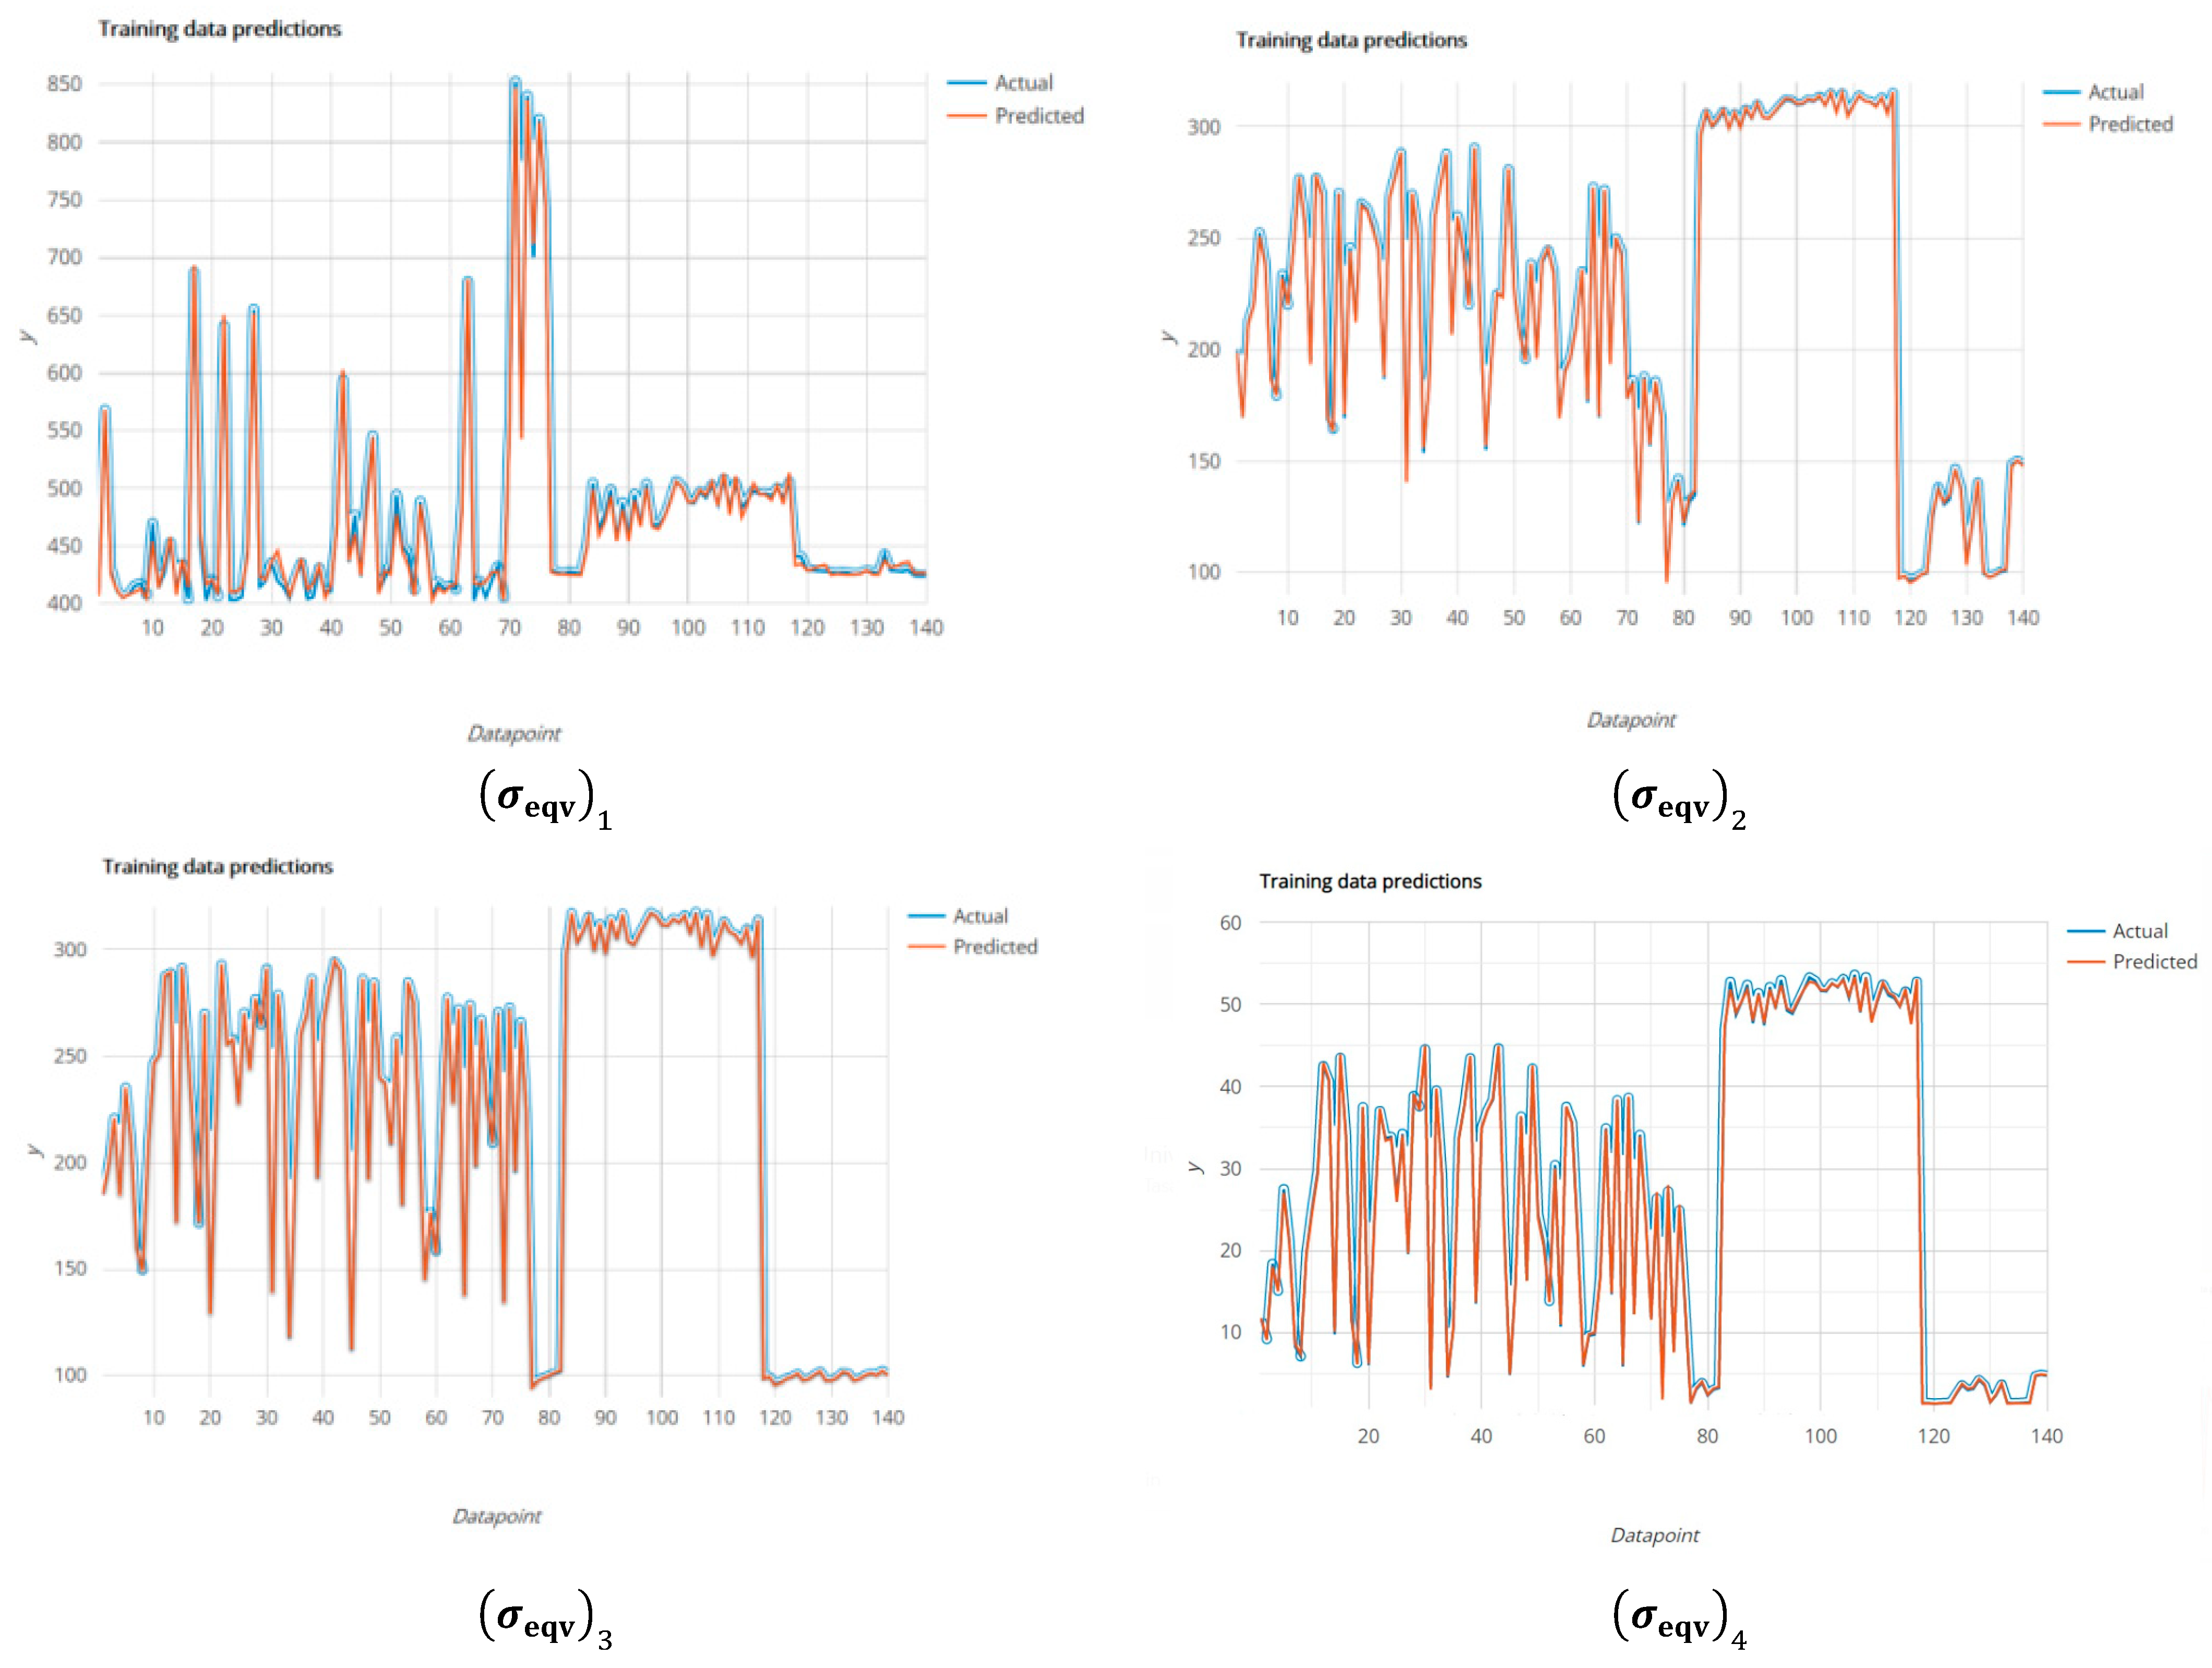
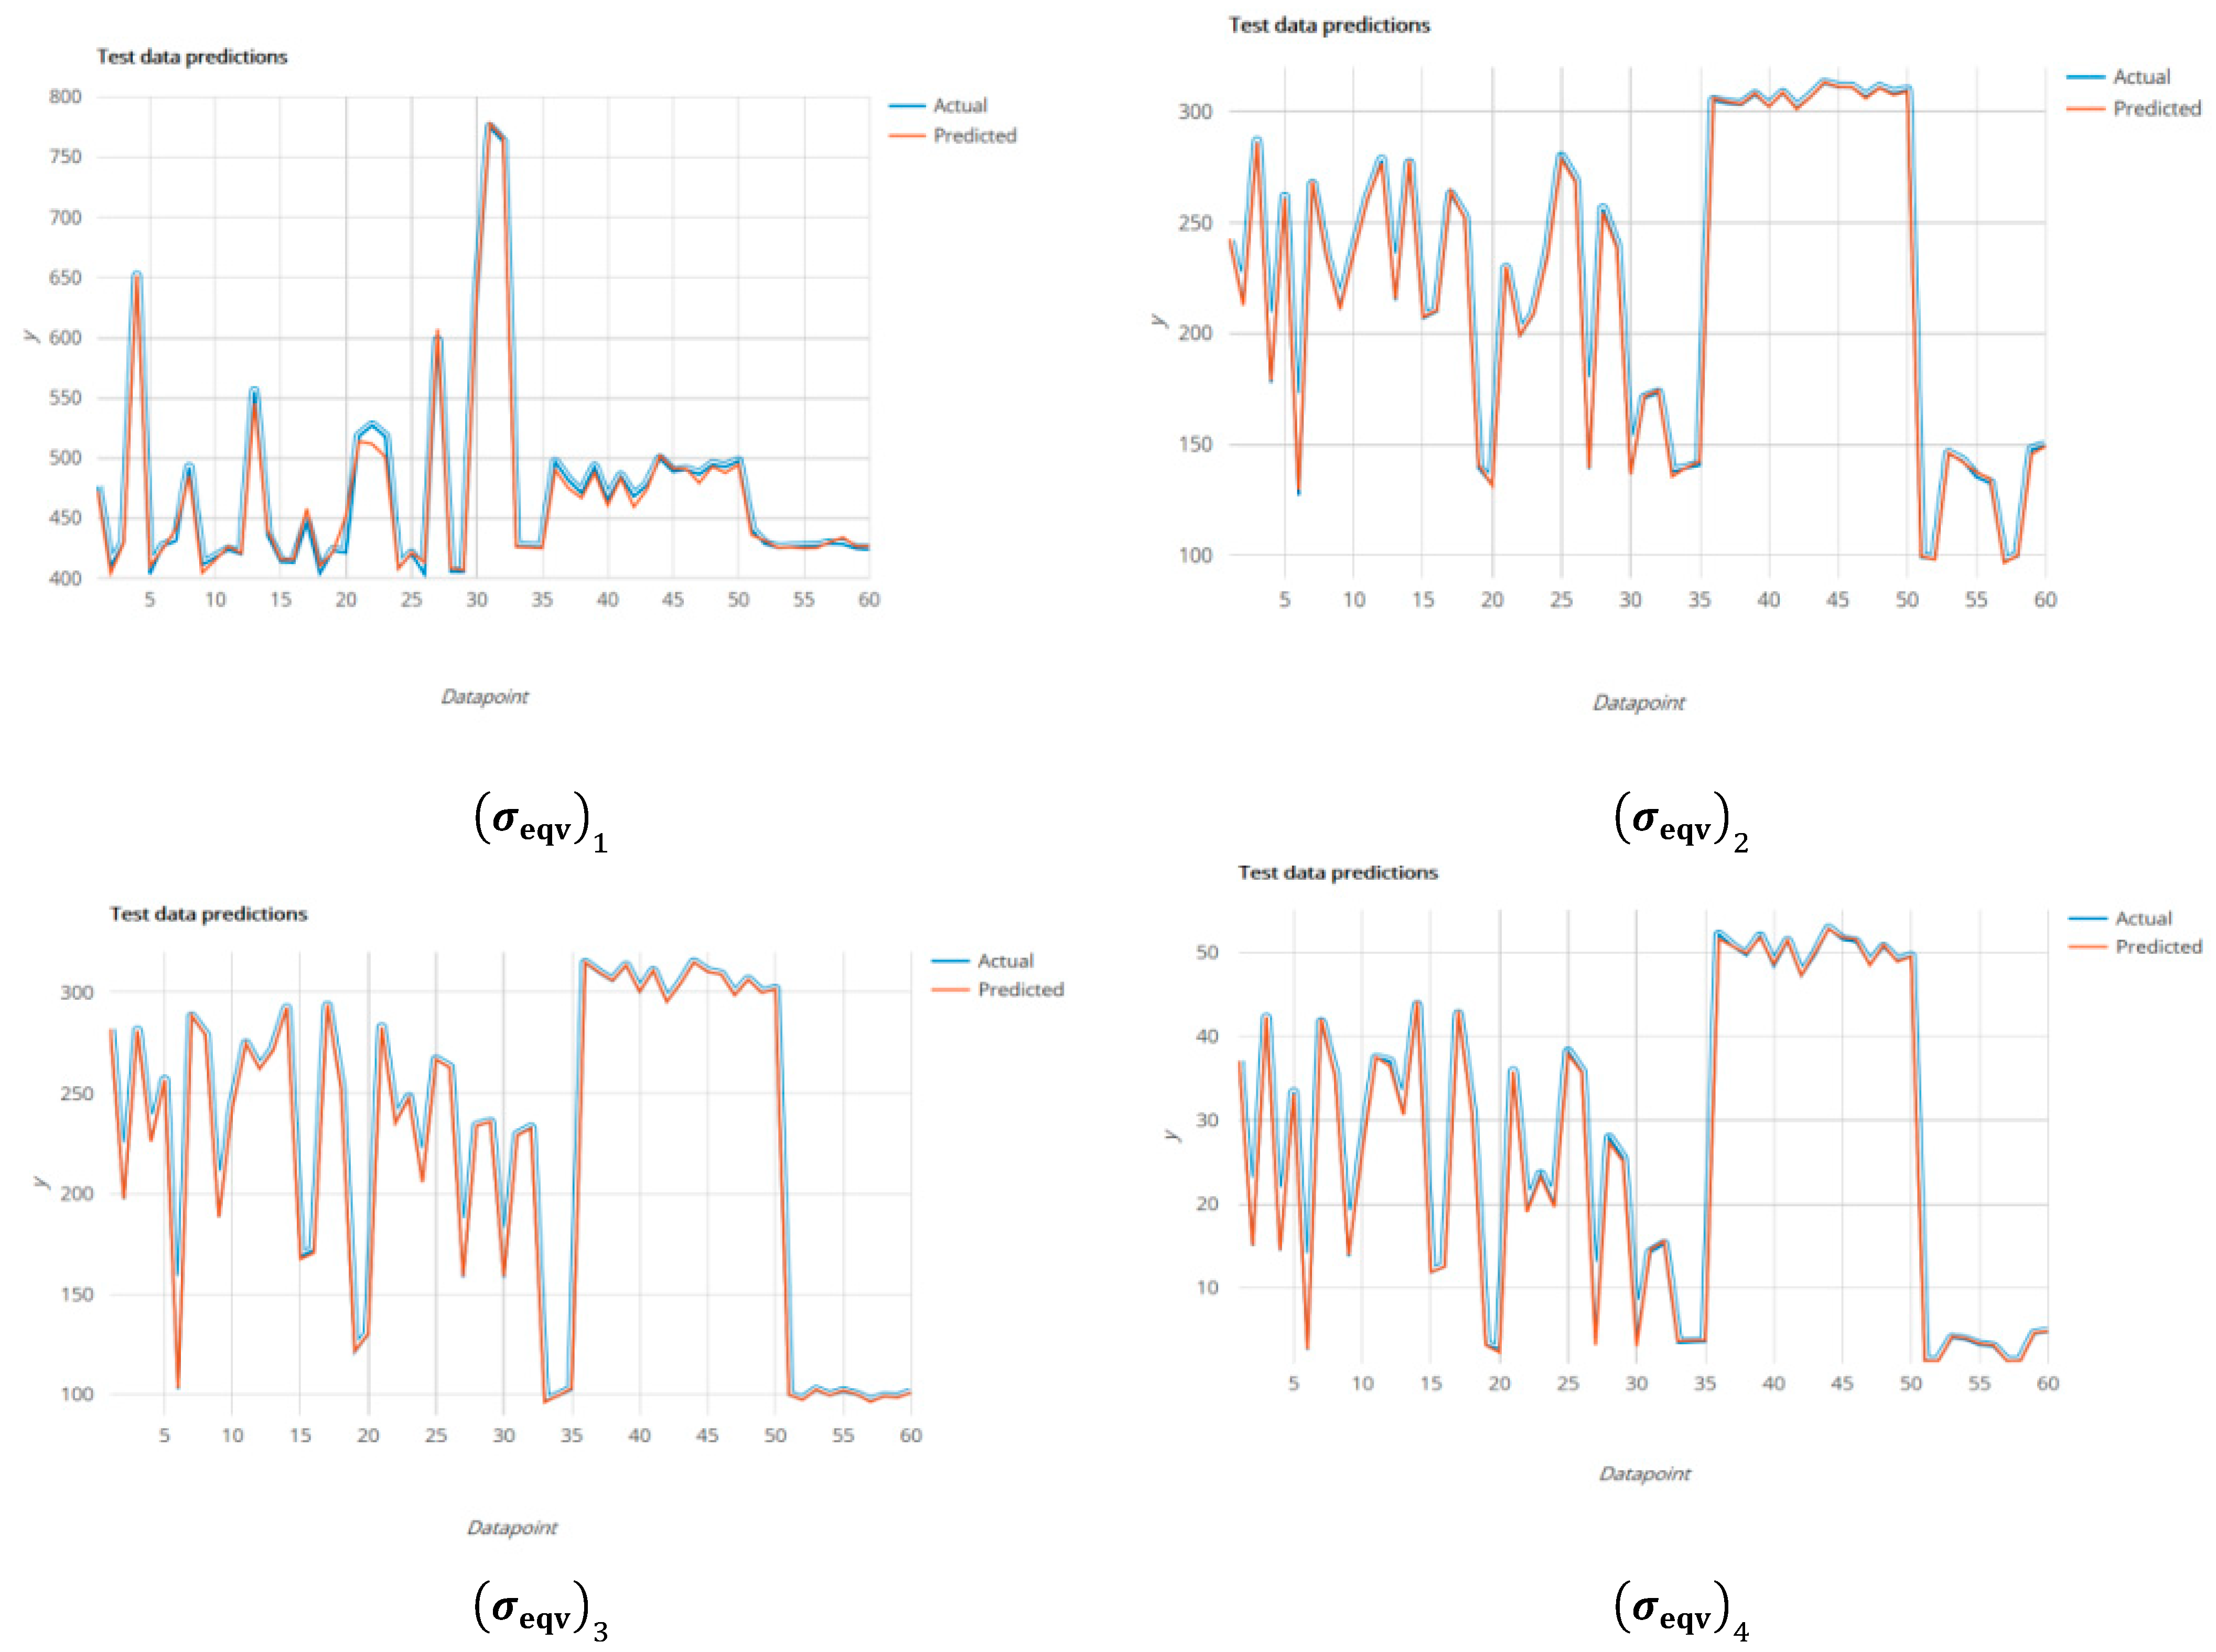
The results obtained from the numerical analysis results are compared with the values obtained in genetic programming. Considering the order of the input data, graphs are created with the equivalent stress value, which is our output data. It is important that the figures in the graphics are similar to each other in order to check whether the program is working correctly. When we look at all the graphics, it is remarkable that they are similar to each other.
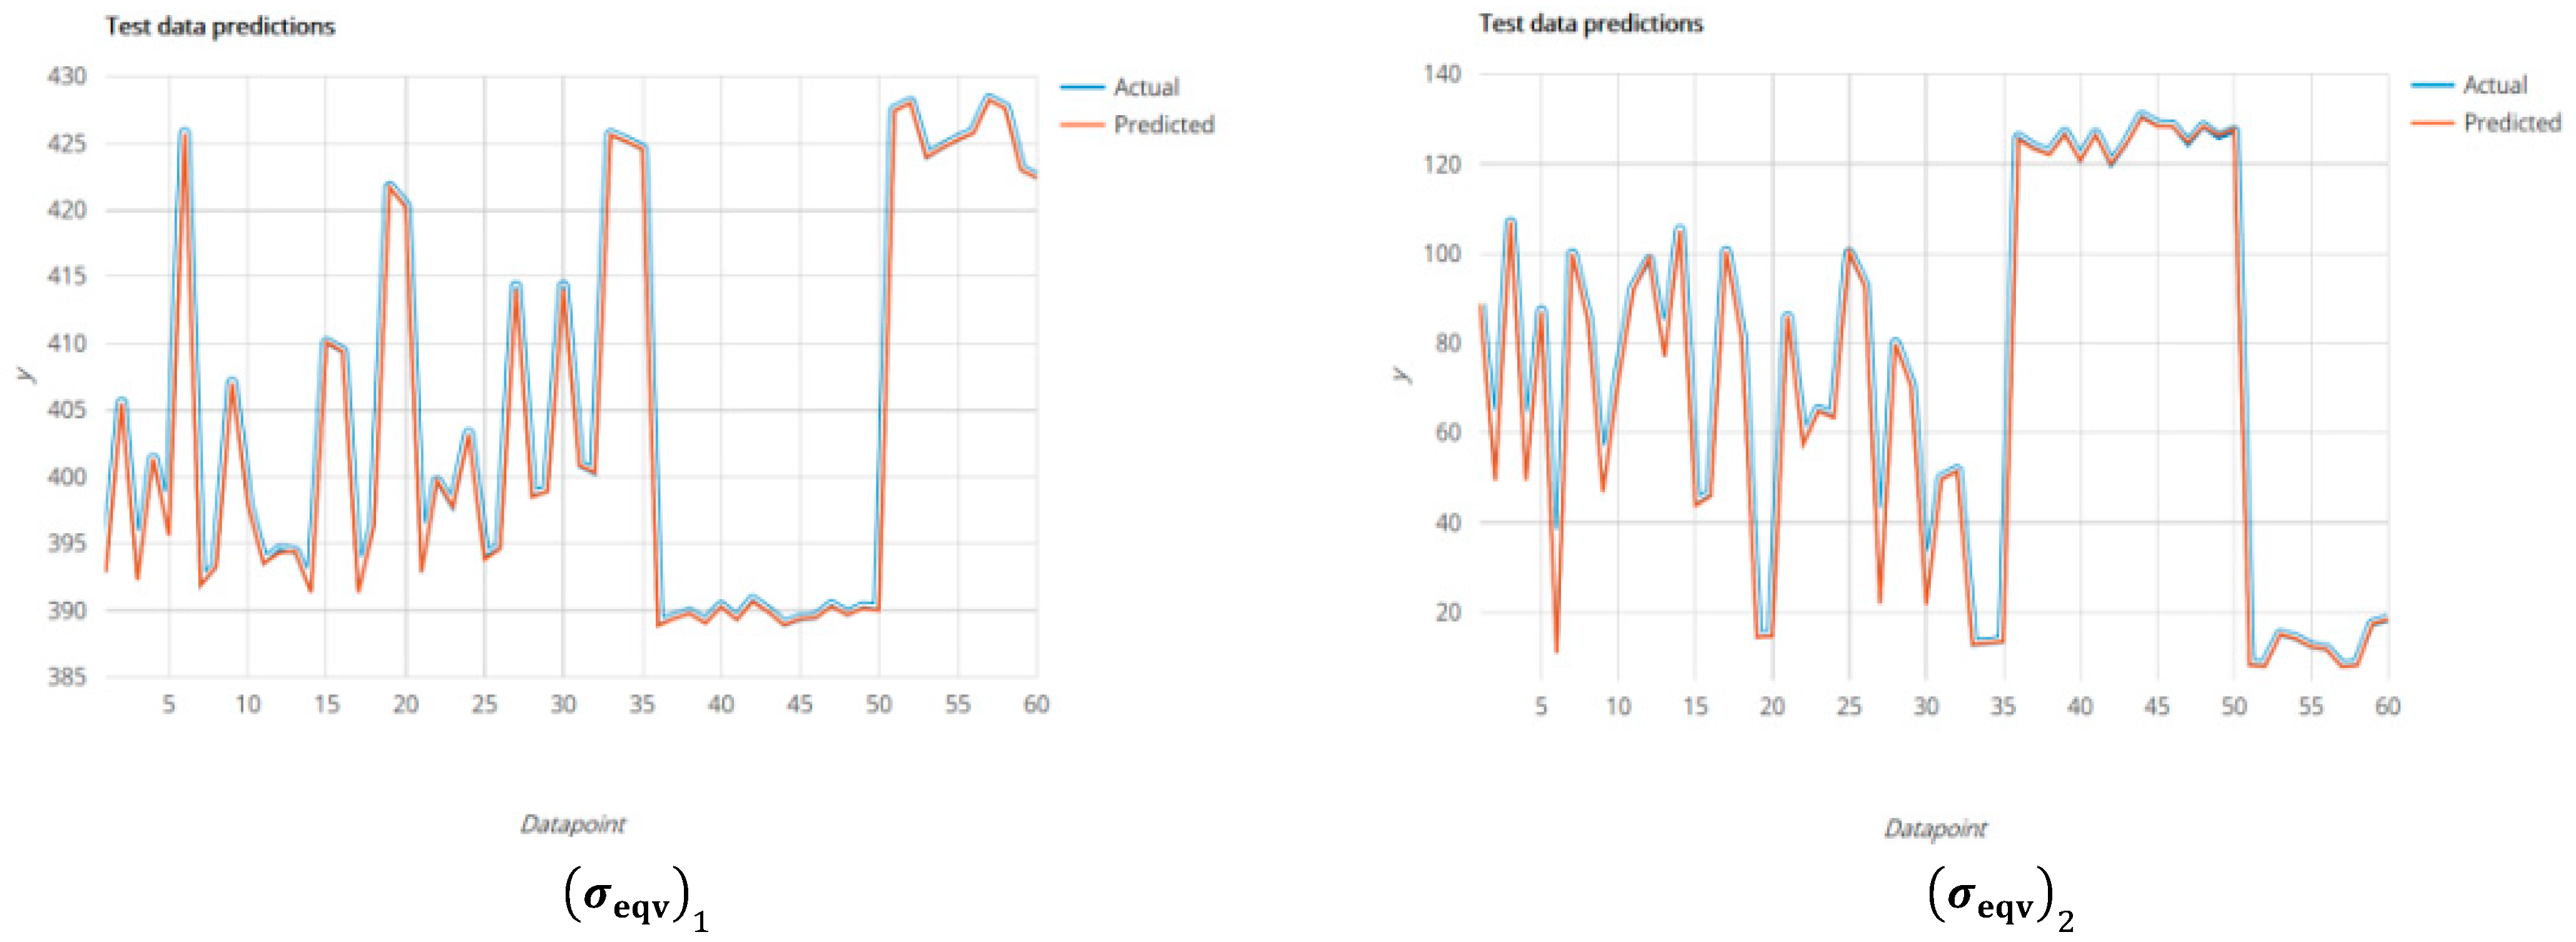
Figure 6 shows the graph of the actual and predicted values of the training simulation results of all equivalent stresses of Model 1, and Figure 7 has test simulation results. In error graphs, it is desired that the actual value and the predicted value be very close to each other. For both training and test simulation results, the actual and predicted values in the graphs converged.
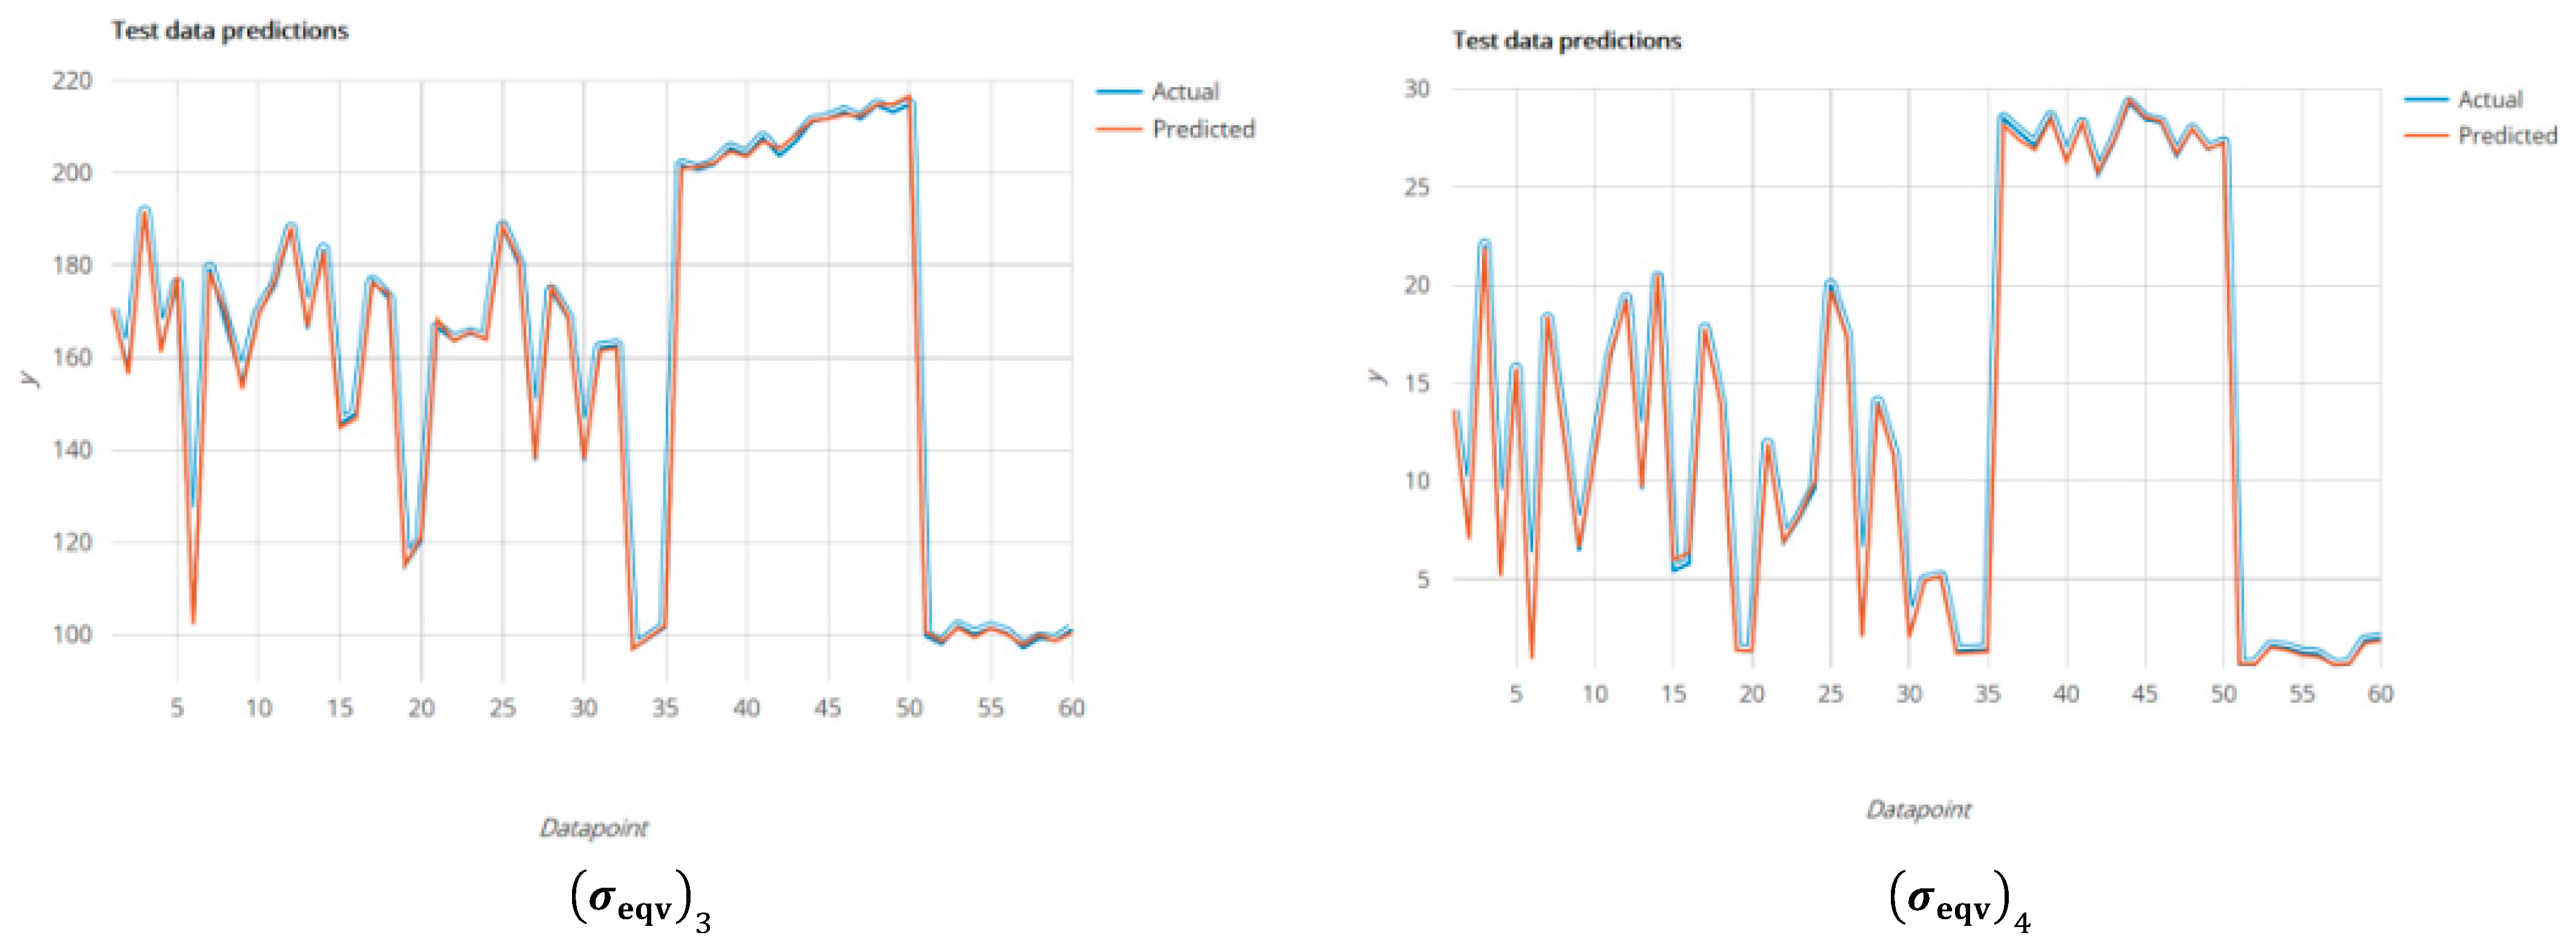
Figure 8 shows a graph of the actual and predicted values of the training simulation results of all equivalent stresses of Model 2, and also Figure 9 shows test simulation results of Model 2. Graphics show that MGGP solved all equivalent stresses with high accuracy.
The performance of 200 different compositional gradient exponent values evaluated with equations produced in MGGP. Results of found equations reached the effective solution with high accuracy. The RMSE, error rate, minimum and maximum error values of Model 1 obtained by looking at the actual and predicted values of all equivalent stresses are shown in Table 6. Considering these criteria, in terms of efficiency, values reached the best solution and values reached the worst solution.
The RMSE, error rate, minimum and maximum error values of the Model 2 achieved from actual and predicted values of all equivalent stresses are shown in Table 7. When Model 2 examined by these criteria, values reached the best solution and values reached the worst solution.
To determine the average duration of the numerical solution, an average time estimate is made by choosing the largest, medium, and smallest values of values between 0.0001–1.5. These time expressions are shown in Table 8. Based on these times, the average times are 2049.47 s in Model 1 and 842.00 s in Model 2. Regardless of the data set formation time of MGGP, one n-m compositional gradient exponent value is reached in less than one second after the model is created, and thus CPU time is reduced and work time saved.
4. Conclusions
For structural analysis of FGM, composite gradient exponent values and equivalent stress values, which affect thermo-mechanical behavior, have worked well. A useful equation is established in MGGP to save work and time. In accordance with this purpose, equations are founded in MGGP. The performance of these equations is evaluated with two different models. When the equation’s performance is evaluated, considering the RMSE value, it is solved in an average of 97.95% in model 1 and model 2 with an average of 97.99 accuracies. Due to the rapid progress of the technology and change in the usage conditions, it has become very important to reach the optimum product quickly. Established equations can be used in optimization studies because of their high accuracy and fast design. Our study will contribute to the literature in this aspect and will guide researchers.
Author Contributions
Conceptualization, M.D.D., C.O. and D.Ç.; methodology, M.D.D., C.O. and D.Ç.; software, M.D.D., C.O., D.Ç. and S.A.; validation, M.D.D., C.O., D.Ç. and S.A.; formal analysis, M.D.D. and D.Ç.; investigation, M.D.D., C.O. and D.Ç.; resources, M.D.D. and D.Ç.; data curation, M.D.D., C.O. and D.Ç..; writing—original draft preparation, D.Ç. and M.D.D.; writing—review and editing, D.Ç. and M.D.D..; visualization, D.Ç. and M.D.D.; supervision, M.D.D.; project administration, M.D.D. and C.O.; funding acquisition, M.D.D. and C.O. All authors have read and agreed to the published version of the manuscript.
Funding
This work was supported by Erciyes University Scientific Research Project Foundation with the Projects of Project ID: FYL-2017-7763 and Project ID: FBG-2022-11885.
Institutional Review Board Statement
The study does not require ethical approval.
Informed Consent Statement
The study does not include animal studies.
Data Availability Statement
The study did not report any data.
Acknowledgments
This work was supported by Erciyes University Scientific Research Project Foundation with the Projects of Project ID: FYL-2017-7763 and Project ID: FBG-2022-11885.
Conflicts of Interest
The authors declare no conflict of interest.
References
- Demirbas, M.D. Thermal stress analysis of functionally graded plates with temperature-dependent material properties using theory of elasticity. Compos. Part B Eng. 2017, 131, 100–124. [Google Scholar] [CrossRef]
- Kazemzadeh-Parsi, M.-J.; Chinesta, F.; Ammar, A. Proper generalized decomposition for parametric study and material distribution design of multi-directional functionally graded plates based on 3d elasticity solution. Materials 2021, 14, 6660. [Google Scholar] [CrossRef] [PubMed]
- Marchuk, A.V.; Onyshchenko, A.M.; Plazii, I.P. Stability analysis of functionally graded plates based on the three-dimensional theory of elasticity. Compos. Part C Open Access 2021, 6, 100200. [Google Scholar] [CrossRef]
- Huang, W.; Xue, K.; Li, Q. Three-Dimensional Solution for the Vibration Analysis of Functionally Graded Rectangular Plate with/without Cutouts Subject to General Boundary Condition. Materials 2021, 14, 7088. [Google Scholar] [CrossRef]
- Ye, W.B.; Liu, J.; Zhang, J.; Yang, F.; Lin, G. A new semi-analytical solution of bending, buckling and free vibration of functionally graded plates using scaled boundary finite element method. Thin-Walled Struct. 2021, 163, 107776. [Google Scholar] [CrossRef]
- Uymaz, B. Buckling Characteristics of FGM plates subjected to linearly varying in-plane loads. Mech. Compos. Mater. 2021, 57, 69–80. [Google Scholar] [CrossRef]
- Demirbaş, M.D.; Apalak, M.K. Thermal stress analysis of one- and two dimensional functionally graded plates subjected to in-plane heat fluxes. Proc. Inst. Mech. Eng. Part L J. Mater. Des. Appl. 2018, 42, 415–433. [Google Scholar] [CrossRef]
- Zhou, W.; Ai, S.; Chen, M.; Zhang, R.; He, R.; Pei, Y.; Fang, D. Preparation and thermodynamic analysis of the porous ZrO2/(ZrO2 þ Ni) functionally graded bolted joint. Compos. Part B Eng. 2015, 82, 13–22. [Google Scholar] [CrossRef]
- Mahamood, R.M.; Akinlabi, E.T.; Shukla, M.; Pityana, S. Functionally Graded Material: An overview. In Proceedings of the World Congress on Engineering (WCE 2012), London, UK, 4–6 July 2012. [Google Scholar]
- Nohut, S.; Schwentenwein, M. Vat Photopolymerization Additive Manufacturing of Functionally Graded Materials: A Review. J. Manuf. Mater. Process. 2022, 6, 17. [Google Scholar] [CrossRef]
- Koizumi, M. FGM activities in Japan. Compos. Part B Eng. 1997, 28, 1–4. [Google Scholar] [CrossRef]
- Kakac, S.; Pramuanjaroenkij, A.; Zhou, X.Y. A review of numerical modeling of solid oxide fuel cells. Int. J. Hydrogen Energy 2007, 32, 761–786. [Google Scholar] [CrossRef]
- Ruys, A.; Popov, E.; Sun, D.; Russell, J.; Murray, C. Functionally graded electrical/thermal ceramic systems. J. Eur. Ceram. Soc. 2001, 21, 2025–2029. [Google Scholar] [CrossRef]
- Shabana, Y.M.; Noda, N. Thermo-elastic-plastic stresses in functionally graded materials subjected to thermal loading taking residual stresses of the fabrication process into consideration. Compos. Part B Eng. 2001, 32, 111–121. [Google Scholar] [CrossRef]
- Praveen, G.N.; Reddy, J.N. Nonlinear transient thermos elastic analysis of functionally graded ceramic-metal plates. Int. J. Solids Struct. 1998, 35, 4457–4476. [Google Scholar] [CrossRef]
- Turteltaub, S. Optimal control and optimization of functionally graded materials for thermomechanical processes. Int. J. Solids Struct. 2002, 39, 3175–3197. [Google Scholar] [CrossRef]
- Ngo, T.D.; Kashani, A.; Imbalzano, G.; Nguyen, K.T.Q.; Hui, D. Additive manufacturing (3D printing): A review of materials, methods, applications and challenges. Compos. Part B Eng. 2018, 143, 172–196. [Google Scholar] [CrossRef]
- Sartal, A.; Bellas, R.; Mejías, A.M.; García-Collado, A. The sustainable manufacturing concept, evolution and opportunities within Industry 4.0: A literature review. Adv. Mech. Eng. 2020, 12, 1–17. [Google Scholar] [CrossRef]
- Saleh, B.; Jiang, J.; Fathi, R.; Al-hababi, T.; Xu, Q.; Wang, L.; Song, D.; Ma, A. 30 Years of functionally graded materials: An overview of manufacturing methods, applications, and future challenges. Compos. Part B Eng. 2020, 201, 108376. [Google Scholar] [CrossRef]
- Al Rashid, A.; Ahmed, W.; Khalid, M.Y.; Koç, M. Vat photopolymerization of polymers and polymer composites: Processes and applications. Addit. Manuf. 2021, 47, 102279. [Google Scholar] [CrossRef]
- Moita, J.S.; Araújoa, A.L.; Correia, F.V.; Soares, C.M.M.; Herskovits, J. Material, distribution and sizing optimization of functionally graded plate shell structures. Compos. Part B. Eng. 2018, 142, 263–272. [Google Scholar] [CrossRef]
- Mantari, J.L.; Monge, J.C. Buckling free vibration and bending analysis of functionally graded sandwich plates based on an optimized hyperbolic unified formulation. Int. J. Mech. Sci. 2016, 119, 170–186. [Google Scholar] [CrossRef]
- Ashjari, M.; Koshravan, M.R. Mass optimization of functionally graded plate for mechanical loading in the presence of deflection and stress constraints. Compos. Struct. 2014, 110, 118–132. [Google Scholar] [CrossRef]
- Nazari, F.; Abolbashari, M.H.; Hosseini, S.M. Three dimensional natural frequency analysis of sandwich plates with functionally graded core using hybrid meshless local petrov-galerkin method and artificial neural network. Comput. Model. Eng. Sci. 2015, 105, 271–299. [Google Scholar]
- Roque, C.M.C.; Martins, P.A.L.S. Differential evolution for optimization of functionally graded beams. Compos. Struct. 2015, 133, 1191–1197. [Google Scholar] [CrossRef]
- Franco Correia, V.; Moita, J.S.; Moleiro, F.; Soares, C.M.M. Optimization of Metal-Ceramic Functionally Graded Plates Using the Simulated Annealing Algorithm. Appl. Sci. 2021, 11, 729. [Google Scholar] [CrossRef]
- Maciejewski, G.; Mroz, Z. Optimization of functionally gradient materials in valve design under cyclic thermal and mechanical loading. Comput. Assist. Methods Eng. Sci. 2013, 20, 99–112. [Google Scholar]
- Nguyen, T.T.; Lee, J. Optimal design of thin-walled functionally graded beams for buckling problems. Compos. Struct. 2017, 179, 459–467. [Google Scholar] [CrossRef]
- Alshabatat, N.T. Natural Frequencies Optimization of Thin-Walled Circular Cylindrical Shells Using Axially Functionally Graded Materials. Materials 2022, 15, 698. [Google Scholar] [CrossRef]
- Pham, Q.H.; Nguyen, P.C.; Tran, T.T. Free vibration response of auxetic honeycomb sandwich plates using an improved higher-order ES-MITC3 element and artificial neural network. Thin-Walled Struct. 2022, 175, 109203. [Google Scholar] [CrossRef]
- Pais, A.I.; Alves, J.L.; Belinha, J. A bio-inspired remodelling algorithm combined with a natural neighbour meshless method to obtain optimized functionally graded materials. Eng. Anal. Bound. Elem. 2022, 135, 145–155. [Google Scholar] [CrossRef]
- Lieu, Q.X.; Lee, J.; Lee, D.; Lee, S.; Kim, D.; Lee, J. Shape and size optimization of functionally graded sandwich plates using isogeometric analysis and adaptive hybrid evolutionary firefly algorithm. Thin-Walled Struct. 2018, 124, 588–604. [Google Scholar] [CrossRef]
- Zong, H.; Liu, H.; Ma, Q.; Tian, Y.; Zhou, M.; Wang, M.Y. VCUT level set method for topology optimization of functionally graded cellular structures. Comput. Methods Appl. Mech. Eng. 2019, 354, 487–505. [Google Scholar] [CrossRef]
- Yi, B.; Zhou, Y.; Yoon, G.H.; Saitou, K. Topology optimization of functionally graded lattice structures with buckling constraints. Comput. Methods Appl. Mech. Eng. 2019, 354, 593–619. [Google Scholar] [CrossRef]
- Franco Correia, V.; Madeira, J.F.A.; Araujo, A.L.; Soarse, C.M.M. Multiobjective optimization of functionally graded material plates with thermo-mechanical loading. Compos. Struct. 2019, 207, 845–857. [Google Scholar] [CrossRef]
- Zhang, M.; Li, M.; Shen, Y.; Zhang, J. Isogeometric shape optimization of high RCC gravity dams with functionally graded partition structure considering hydraulic fracturing. Eng. Struct. 2019, 179, 341–352. [Google Scholar] [CrossRef]
- Bielefeldt, B.R.; Reich, G.W.; Beran, P.S.; Hartl, D.J. Development and validation of a genetic L-System programming framework for topology optimization of multifunctional structures. Comput. Struct. 2019, 218, 152–169. [Google Scholar] [CrossRef]
- Gandomi, A.H.; Roke, D.A.; Sett, K. Genetic programming for moment capacity modeling of ferrocement members. Eng. Struct. 2013, 57, 169–176. [Google Scholar] [CrossRef]
- Mehr, A.D.; Kahya, E.; Olyaie, E. Streamflow prediction using linear genetic programming in comparison with a neuro-wavelet technique. J. Hydrol. 2013, 505, 240–249. [Google Scholar] [CrossRef]
- Vanneschi, L.; Castelli, M.; Scott, K.; Trujillo, L. Alignment-based genetic programming for real life applications. Swarm Evol. Comput. 2019, 44, 840–851. [Google Scholar]
- Mehr, D.A.; Nourani, V.; Kahyaq, E.; Hrnjica, B.; Sattar, A.M.A.; Yaseen, Z.M. Genetic programming in water resources engineering: A state-of-the-art review. J. Hydrol. 2018, 566, 643–667. [Google Scholar] [CrossRef]
- Tran, B.; Xue, B.; Zhang, M. Genetic programming for multiple-feature construction on high-dimensional classification. Pattern Recognit. 2019, 93, 404–417. [Google Scholar] [CrossRef]
- Ma, J.; Teng, G. A hybrid multiple feature construction approach for classification using Genetic Programming. Appl. Soft Comput. J. 2019, 80, 687–699. [Google Scholar] [CrossRef]
- Kalfat, R.; Nazari, A.; Al-Mahaidi, R.; Sanjayan, J.G. Genetic programming in the simulation of Frp-to-concrete patch-anchored joints. Compos. Struct. 2016, 138, 305–312. [Google Scholar] [CrossRef]
- Gu, Z.; Liu, Y.; Hughes, D.J.; Ye, J.; Hou, X. A parametric study of adhesive bonded joints with composite material using black-box and grey-box machine learning methods: Deep neuron networks and genetic programming. Compos. Part B Eng. 2021, 217, 108894. [Google Scholar] [CrossRef]
- Dehestani, M.; Khayati, G.R.; Sharafi, S. Function finding via genetic expression programming to predict microhardness of Ni/Al2O3 nanocomposite coatings. J. Ultrafine Grained Nanostruct. Mater. 2021, 54, 73–84. [Google Scholar]
- Shakeri, M.S. The Relation between Deposited Weight and Quality of Coating in EPD Method Derived by Genetic programming. Comput. Eng. Phys. Model. 2021, 4, 73–83. [Google Scholar]
- Punugupati, G.; Kandi, K.K.; Bose, P.S.C.; Rao, C.S.P. Process modeling of gelcast Si3N4 ceramics using multi gene genetic programming. Mater. Today Proc. 2017, 4, 1900–1909. [Google Scholar] [CrossRef]
- Sharif, M.; Jaffar, M.A.; Mahmood, M.T. Optimal composite morphological supervised filter for image denoising using genetic programming: Application to magnetic resonance images. Eng. Appl. Artif. Intell. 2014, 31, 78–89. [Google Scholar] [CrossRef]
- Demirbaş, M.D.; Çakir, D.; Arslan, S.; Öztürk, C. Equivalent Stress Analysis of Functionally Graded Rectangular Plates by Genetic Programming. Int. Sci. Vocat. Stud. J. 2018, 2, 67–80. [Google Scholar]
- Bağcı, M.D. Thermal Stress Analysis of Two-Directional Functionally Graded Rectangular and Circular Plates Subjected to an In-Plane Heat Flux. Ph.D. Thesis, Graduate School of Natural and Applied Sciences, Erciyes University, Kayseri, Turkey, 2012; 207p. [Google Scholar]
- Mori, T.; Tanaka, K. Average stress in matrix and average elastic energy of materials with misfitting inclusions. Acta Metall. 1973, 2, 1571–1574. [Google Scholar] [CrossRef]
- Malikan, M.; Eremeyev, V.A. A new hyperbolic-polynomial higher-order elasticity theory for mechanics of thick FGM beams with imperfection in the material composition. Compos. Struct. 2020, 249, 112486. [Google Scholar] [CrossRef]
- Demirbas, M.D. Thermo-elastic response of 2D-FGRPs with temperature-dependent material properties by means of the theory of elasticity. Mech. Adv. Mater. Struct. 2021; in press. [Google Scholar] [CrossRef]
- Poli, R.; Langdon, W.; McPhee, N. A Field Guide to Genetic Programming; Lulu: Morrisville, NC, USA, 2008. [Google Scholar]
- Koza, J.R. Genetic Programming: On the Programming of Computers by Means of Natural Selection; MIT Press: Cambridge, MA, USA, 1992. [Google Scholar]
- Aydoğan, E. Automatic Generation of Mobile Malwares Using Genetic Programming. Master’s Thesis, Graduate School of Natural and Applied Sciences, Hacettepe University, Ankara, Turkey, 2014; 81p. [Google Scholar]
- Çakır, D. Determination of Material Composition in Functionally Graded Plates by Artificial Neural Network and Genetic Programming. Master’s Thesis, Graduate School of Natural and Applied Sciences, Erciyes University, Kayseri, Turkey, 2018; 185p. [Google Scholar]
- Available online: https://sites.google.com/site/gptips4matlab/ (accessed on 1 January 2018).
Figure 2.
Simply tree structure of GP [55].
Figure 2.
Simply tree structure of GP [55].

Figure 3.
Mutation (a) before (parent) and (b) after (offspring) tree structure.

Figure 4.
(a) candidate solution (b) neighborhood solution (c) received subtree from the neighborhood solution (d) generated candidate solution structure.
Figure 4.
(a) candidate solution (b) neighborhood solution (c) received subtree from the neighborhood solution (d) generated candidate solution structure.

Figure 5.
Flow diagram of optimization.

Figure 6.
Comparison of actual values and predicted results of equivalent stress values in the training for Model 1.
Figure 6.
Comparison of actual values and predicted results of equivalent stress values in the training for Model 1.

Figure 7.
Comparison of actual values and predicted results of equivalent stress values in the test for Model 1.
Figure 7.
Comparison of actual values and predicted results of equivalent stress values in the test for Model 1.


Figure 8.
Comparison of actual values and predicted results of equivalent stress values in the training for Model 2.
Figure 8.
Comparison of actual values and predicted results of equivalent stress values in the training for Model 2.

Figure 9.
Comparison of actual values and predicted results of equivalent stress values in the test for Model 2.
Figure 9.
Comparison of actual values and predicted results of equivalent stress values in the test for Model 2.


Table 1.
Model 1 example for the illustration of the overall model in MGGP [58].
Table 1.
Model 1 example for the illustration of the overall model in MGGP [58].
| Gene 1 | Gene 2 | Gene 3 | Gene 4 | |
|---|---|---|---|---|
| Genotype |  |  |  |  |
| Weight | −64.2 | 5.16 | −3.74 | 24.2 |
| Phenotype (simplified) | ||||
| Weight Bias | 427.0 | |||
| Formulation | ||||
Table 2.
MGGP Setting Parameters.
| Parameters | GP |
|---|---|
| Population Size | 100 |
| Runs | 100 |
| Number of generations | 100 |
| Maximum Tree Depth | 4 |
| Maximum Gene | 4 |
| Crossover Rate | 0.14 |
| Mutation Rate | 0.84 |
| Direct Reproduction Rate | 0.02 |
| Initialization | Ramped Half and Half |
| Functions | +, −, *, square, tan, exp, log, sqrt, cube, negexp, neg, abs |
| Fitness function | RMSE |
Table 3.
Simulation results.
| Model 1 | Model 2 | ||||
|---|---|---|---|---|---|
| Equivalent Stress | Criteria | Training | Test | Training | Test |
| Fitness | 0.143 | 0.157 | 15.486 | 20.877 | |
| Max | 0.287 | 0.321 | 26.223 | 62.125 | |
| Min | 0.063 | 0.073 | 6.254 | 6.816 | |
| S.D | 0.047 | 0.054 | 3.864 | 8.614 | |
| Fitness | 0.925 | 0.916 | 1.860 | 1.979 | |
| Max | 2.000 | 2.087 | 3.889 | 4.173 | |
| Min | 0.237 | 0.260 | 0.934 | 0.898 | |
| S.D | 0.391 | 0.377 | 0.647 | 0.767 | |
| Fitness | 1.082 | 1.156 | 0.668 | 0.780 | |
| Max | 1.343 | 1.380 | 0.800 | 0.929 | |
| Min | 0.763 | 0.815 | 0.328 | 0.400 | |
| S.D | 0.113 | 0.106 | 0.093 | 0.104 | |
| Fitness | 0.218 | 0.143 | 0.617 | 0.658 | |
| Max | 0.692 | 0.287 | 1.284 | 1.393 | |
| Min | 0.162 | 0.165 | 0.299 | 0.285 | |
| S.D | 0.066 | 0.047 | 0.191 | 0.206 | |
Table 4.
Information about trees of the best models.
| Equivalent Stress | Criteria | Model 1 | Model 2 |
|---|---|---|---|
| Node | 22 | 42 | |
| Complexity | 56 | 129 | |
| Tree Depth | 4 | 4 | |
| Gen | 4 | 4 | |
| Node | 29 | 21 | |
| Complexity | 82 | 53 | |
| Tree Depth | 4 | 4 | |
| Gen | 4 | 4 | |
| Node | 18 | 19 | |
| Complexity | 44 | 50 | |
| Tree Depth | 4 | 4 | |
| Gen | 4 | 4 | |
| Node | 24 | 17 | |
| Complexity | 64 | 43 | |
| Tree Depth | 4 | 4 | |
| Gen | 4 | 4 |
Table 5.
Equations of best models.
| Dataset | Equations | |
|---|---|---|
| Model 1 | ||
| Model 2 | ||
Table 6.
RMSE minimum and maximum error values for Model 1.
| RMSE | 0.067 | 0.246 | 3.6078 | 0.1631 |
| Min Error | 0.00103 | 0.007 | 0.0014 | 0.0005 |
| Max. Error | 0.2129 | 0.9059 | 12.0658 | 0.5662 |
| Error Rate (%) | 0.0125 | 0.4884 | 1.395 | 2.752 |
Table 7.
RMSE minimum and maximum error values for Model 2.
| RMSE | 6.428 | 0.960 | 0.350 | 0.295 |
| Min Error | 0.065 | 0.020 | 0.001 | 0.002 |
| Max Error | 30.90 | 2.478 | 1.384 | 0.96 |
| Error Rate (%) | 1.02 | 0.42 | 0.15 | 2.12 |
Table 8.
Numerical solution times of model 1 and model 2.
| n-m | Start | End | Time (s) | Average Time (s) | |
|---|---|---|---|---|---|
| Model 1 | 1.5–1.11 | 13:31:25 | 14:19:40 | 2895.00 | 2049.67 |
| 0.77–0.66 | 15:12:31 | 15:40:08 | 1657.00 | ||
| 0.001–0.005 | 16:31:12 | 16:57:49 | 1597.00 | ||
| Model 2 | 1.5–1.11 | 09:45:58 | 10:08:33 | 1356.00 | 842.00 |
| 0.77–0.66 | 10:14:57 | 10:36:36 | 699.00 | ||
| 0.001–0.005 | 10:46:27 | 11:04:18 | 471.00 |
Publisher’s Note: MDPI stays neutral with regard to jurisdictional claims in published maps and institutional affiliations. |
© 2022 by the authors. Licensee MDPI, Basel, Switzerland. This article is an open access article distributed under the terms and conditions of the Creative Commons Attribution (CC BY) license (https://creativecommons.org/licenses/by/4.0/).
Share and Cite
MDPI and ACS Style
Demirbas, M.D.; Çakır, D.; Ozturk, C.; Arslan, S. Stress Analysis of 2D-FG Rectangular Plates with Multi-Gene Genetic Programming. Appl. Sci. 2022, 12, 8198. https://doi.org/10.3390/app12168198
AMA Style
Demirbas MD, Çakır D, Ozturk C, Arslan S. Stress Analysis of 2D-FG Rectangular Plates with Multi-Gene Genetic Programming. Applied Sciences. 2022; 12(16):8198. https://doi.org/10.3390/app12168198
Chicago/Turabian StyleDemirbas, Munise Didem, Didem Çakır, Celal Ozturk, and Sibel Arslan. 2022. "Stress Analysis of 2D-FG Rectangular Plates with Multi-Gene Genetic Programming" Applied Sciences 12, no. 16: 8198. https://doi.org/10.3390/app12168198
Note that from the first issue of 2016, this journal uses article numbers instead of page numbers. See further details here.