Article

Robust and General Model to Forecast the Heat Transfer Coefficient for Flow Condensation in Multi Port Mini/Micro-Channels

by
Seyyed Hossein Hosseini
1,
Mohamed Arselene Ayari
2,3,*,
Amith Khandakar
4,
Mohammad Amin Moradkhani
1,
Mehdi Jowkar
5,
Mohammad Panahi
1,
Goodarz Ahmadi
6 and
Jafar Tavoosi
7
1
Department of Chemical Engineering, Ilam University, Ilam 69315-516, Iran
2
Department of Civil and Architectural Engineering, College of Engineering, Qatar University, Doha 2713, Qatar
3
Technology Innovation and Engineering Education (TIEE), Qatar University, Doha 2713, Qatar
4
Electrical Engineering Department, College of Engineering, Qatar University, Doha 2713, Qatar
5
Department of Mechanical Engineering, Ilam University, Ilam 69315-516, Iran
6
Department of Mechanical and Aeronautical Engineering, Clarkson University, Potsdam, NY 13699, USA
7
Department of Electrical Engineering, Ilam University, Ilam 69315-516, Iran
*
Author to whom correspondence should be addressed.
Processes 2022, 10(2), 243; https://doi.org/10.3390/pr10020243
Submission received: 12 December 2021 / Revised: 7 January 2022 / Accepted: 18 January 2022 / Published: 26 January 2022

Abstract

:
A general correlation for predicting the two-phase heat transfer coefficient (HTC) during condensation inside multi-port mini/micro-channels was presented. The model was obtained by correlating the two-phase multiplier, φ t p with affecting parameters using the genetic programming (GP) method. An extensive database containing 3503 experimental data samples was gathered from 21 different sources, including a broad range of operating parameters. The newly obtained correlation fits the broad range of measured data analyzed with an average absolute relative deviation (AARD) of 16.87% and estimates 84.73% of analyzed data points with a relative error of less than 30%. Evaluation of previous correlations was also conducted using the same database. They showed the AARD values ranging from 36.94% to 191.19%. However, the GP model provides more accurate results, AARD lower than 17%, by considering the surface tension effects. Finally, the effect of various operating parameters on the HTC was studied using the proposed correlation.

1. Introduction

Condensers play important roles in different systems, such as air conditioning [1,2], heat pumping [3], refrigeration [4,5], nuclear [6,7], chemical [8,9], etc. Nowadays, condensers with mini/micro-channels are used instead of conventional channels in many industries [10,11,12,13,14,15]. The main reasons are reducing the size of the condensers, refrigeration charge, required space, and overall cost of the process [16]. Therefore, a lower condenser’s weight and size are required for a given heat duty in this type of channel. The multi-port mini/micro-channels can raise the contact region between the condenser and the working fluids and leads to a higher evaporating rate as an internal fin [17]. Furthermore, the influence of surface tension becomes important in the smaller channels. That is, the surface tension can decrease the liquid film thickness during condensation in these channels. Furthermore, heat exchange between parallel channels can lead to a difference in HTC in multi-port channels from conventional ones.

1.1. Previous Works

1.1.1. Channels’ Classifications

Several classifications are suggested for channels based on their characterizations [18,19,20,21,22,23,24,25,26,27]. Some of these classifications are based on channel diameters, and the others are based on the Bond number (Bo). An extensive review of these classifications is presented in [28]. The most commonly used classification was developed by Kandlikar [19]. According to this classification, the channels by hydraulic diameters lower than 0.2 mm are classified as micro-channels. The mini-channels have a hydraulic diameter (HD) between 0.2 to 3 mm, and the conventional channels are ones with HD of more than 3 mm. Through the classification suggested by Mehendale et al. [26], channels with D < 6 mm are mini-channels, and the micro-channels have an HD of less than 0.1 mm. Cheng and Wu [21] classified the channels based on the Bond number. They indicated that the buoyancy forces overcome the surface tension in the conventional channels, and these channels have a Bond number higher than 3. Furthermore, the surface tension effects could overcome the buoyancy forces in micro-channels. Therefore, the Bond number of less than 0.5 is defined for micro-channels. In addition, the mini-channels are those with a Bond number between 0.5 to 3. The classification suggested by Kandlikar [19] is used in the present study for defining the mini and micro-channels.

1.1.2. Experimental Research

Several experimental works have studied condensation heat-transfer in mini/micro-channels [16,29,30,31,32,33,34,35]. However, there are only limited works focusing on heat transfer in multi-port channels. Garimella et al. [36] investigated the condensation HTC of R134a in rectangular micro-channels with a HD between 0.1 to 0.16 mm and an aspect ratio between 1 to 4. They observed that similar to conventional channels, the HTC in multi-port channels increased with increasing vapor quality. The authors also compared measured data by the available correlations. All of the correlations showed large deviations and under-predicted the measured data. A similar study was conducted by Fronk and Garimella [37] for the HTC of carbon dioxide. Their result showed that the multi-port channel with a 0.1 mm HD had the highest HTC at a constant mass flux and saturation temperature. Jige et al. [38] studied the heat transfer of different refrigerants at different saturation temperatures in multi-port channels. They indicated that the HTC raises with raising the saturation temperature. In addition, their results showed that the HTC of R32 was more than R134a and R1234ze(E).

1.1.3. Previous Models for Condensation HTC

There are different models in the literature for approximating the HTC during condensation inside single and multi-channels. Some of these models have been improved by the experimental data for limited operating conditions [39,40,41,42,43]. The single-phase HTC equation developed by Dittus and Boelter [44] has been widely used as the basic equation for estimating the HTC in different studies. Based on this equation, the single-phase Nusselt number, N u s p , is a function of single-phase Reynolds and Prandtl numbers:
N u s p = h s p D k l = 0.023 R e l 0.8 P r l 0.4
In many previous studies, the two-phase Nusselt number, N u t p , was obtained by multiplying a two-phase correction factor by the single-phase HTC,
N u t p = N u s p φ t p
Here, φ t p is the two-phase correction factor. The values of the two-phase correction factor, φ t p , depend on several parameters, and different studies have been conducted to estimate this factor. Shah [45] presented the following simple expression for estimating the two-phase correction factor during film condensation in pipes,
φ t p = 1 + 3.8 [ ( 1 x 1 ) 0.8 P r e d 0.4 ] 0.95
Based on this correlation, only the vapor quality and the reduced pressure can affect the φ t p . Cavallini et al. [46] proposed a general correlation for various fluids. They indicated that the vapor quality, liquid P r , viscosity, and density of the liquid/vapor are the important parameters for estimating φ t p . In addition, they reported that the HTC is related to the wall temperature difference, when J g > J g T . The transition line for dimensionless vapor velocity, J g T was defined as following equation,
J g T = [ ( 7.5 4.3   X t t 1.111 + 1 ) 3 + C T 3 ] 1 3
where C T value is 1.6 for hydrocarbons and 2.6 for other refrigerants.
Dobson and Chato [41] suggested the use of the Lockhart–Martinelli Parameter, X t t for predicting the two-phase correction factor in annular flow,
φ t p = 1 + 2.22 X t t 0.89
There are several general correlations for estimating the two-phase HTC during condensation that was developed on the basis of large datasets, which are applicable for both single and multi-port channels [47,48,49,50,51]. Kim and Mudawar [52] proposed a correlation approach on the basis of 4045 data from 28 sources for single- multi port mini-channels with 0.424 to 6.22 mm hydraulic diameters. The analyzed database included 1964 data points for single-port channels and 2081 data points for multi-port channels. They suggested two separated correlations for slug/bubbly and annular flows. The transition line between these regimes was defined as follows,
W e * > 7 X t t 0.2
where modified Weber number, W e * , can be calculated as Soliman [53] method,
W e * = 2.45 R e v 0.64 S u v o 0.3 ( 1 + 1.09 X t t 0.039 ) 0.4                                                                       f o r   R e l 1250
W e * = 0.85 R e v 0.79 X t t 0.157 S u v o 0.3 ( 1 + 1.09 X t t 0.039 ) 0.4 [ ( ρ l ρ v ) ( μ v μ l ) 2   ] 0.084         f o r   R e l > 1250
In the general correlation developed by Dorao and Fernandino [49], only two parameters were used to estimate the N u t p . The correlation was suggested for horizontal mini/macro-channels with 0.067 to 20 mm diameters. This model presented two different regimes, i.e., high and low mass fluxes (or vapor qualities) for HTC. They indicated that the pipe diameter effect becomes significant when the two-phase Reynolds number, R e t p is greater than transient value, R e t p T ,
R e t p T = 10 8 D 1.5
Among the data points analyzed by Dorao and Fernandino [49], only the data from Derby et al. [54] and Wang et al. [55] were for multi-port channels, and the model is more suitable for single-port channels. This point was confirmed by Hosseini et al. [56], which compared the model of Dorao and Fernandino [49] with a large data for single-port channels and observed a good agreement with the experimental values.
Shah [57] presented general correlations based on 5100 data points for different flow regimes and channel orientations. The analyzed data contained single and multi-port channels with HDs from 0.08 mm to 49 mm. This model provided an improvement for estimating the HTC of hydrocarbons. In addition, the author suggested predictive methods for low Froude and Reynolds numbers. It should be mentioned that the machine learning algorithms have been extensively used in various applications such as biomedical [58], clinical [59,60], solar power prediction [61], food production [62], etc., for sustainable solutions. Zhou et al. [63] used the machine learning algorithms for estimating the HTC in mini/micro-channels using 4882 data points. Among the different methods tried by them, the artificial neural network (ANN) with 15 hidden layers and 22 adjusted parameters showed the best agreement with measured data with a total AARD of 6.80%. Recently, Hosseini et al. [56] developed a general model using the genetic programming (GP) approach for predicting the condensation HTC in single channels, with 5728 data points for a broad range of operating conditions. The model predicted the analyzed data points with a good AARD value of 17.82%. In addition, they used a separate database including 712 data points from 6 independent sources for validating the developed model. The results showed that the proposed model provides the best accuracy for single-port channels.

1.1.4. Contributions of the Present Study

It is seen that the previous researchers used the same methods for estimating the HTC during condensation in single and multi-port channels. Therefore, these correlations estimate the same values for these cases. However, as discussed previously, the HTC in parallel channels differs from that for single-port ones because of the contact area effects, surface tension forces, and heat exchange between parallel channels. In the previous work [56], a general correlation was developed for the HTC inside single port mini/micro and macro-channels using an extensive database. The basic objective of this study is to extend the former attainments by developing a general model for the HTC in flow condensation. Therefore, an extensive database containing 3503 data points was gathered from 21 independent studies, covering a broad range of operating conditions and working fluids. In addition, the intelligent and powerful method of genetic programming (GP) was employed for improving a mathematical equation for HTC during the condensation. Furthermore, the performance of previous correlations in estimating the HTC in multi-port channels was also evaluated using the same database. Finally, the predictive trends of the new model were evaluated, and the impact of various parameters on the HTC was discussed.

2. Materials and Methods

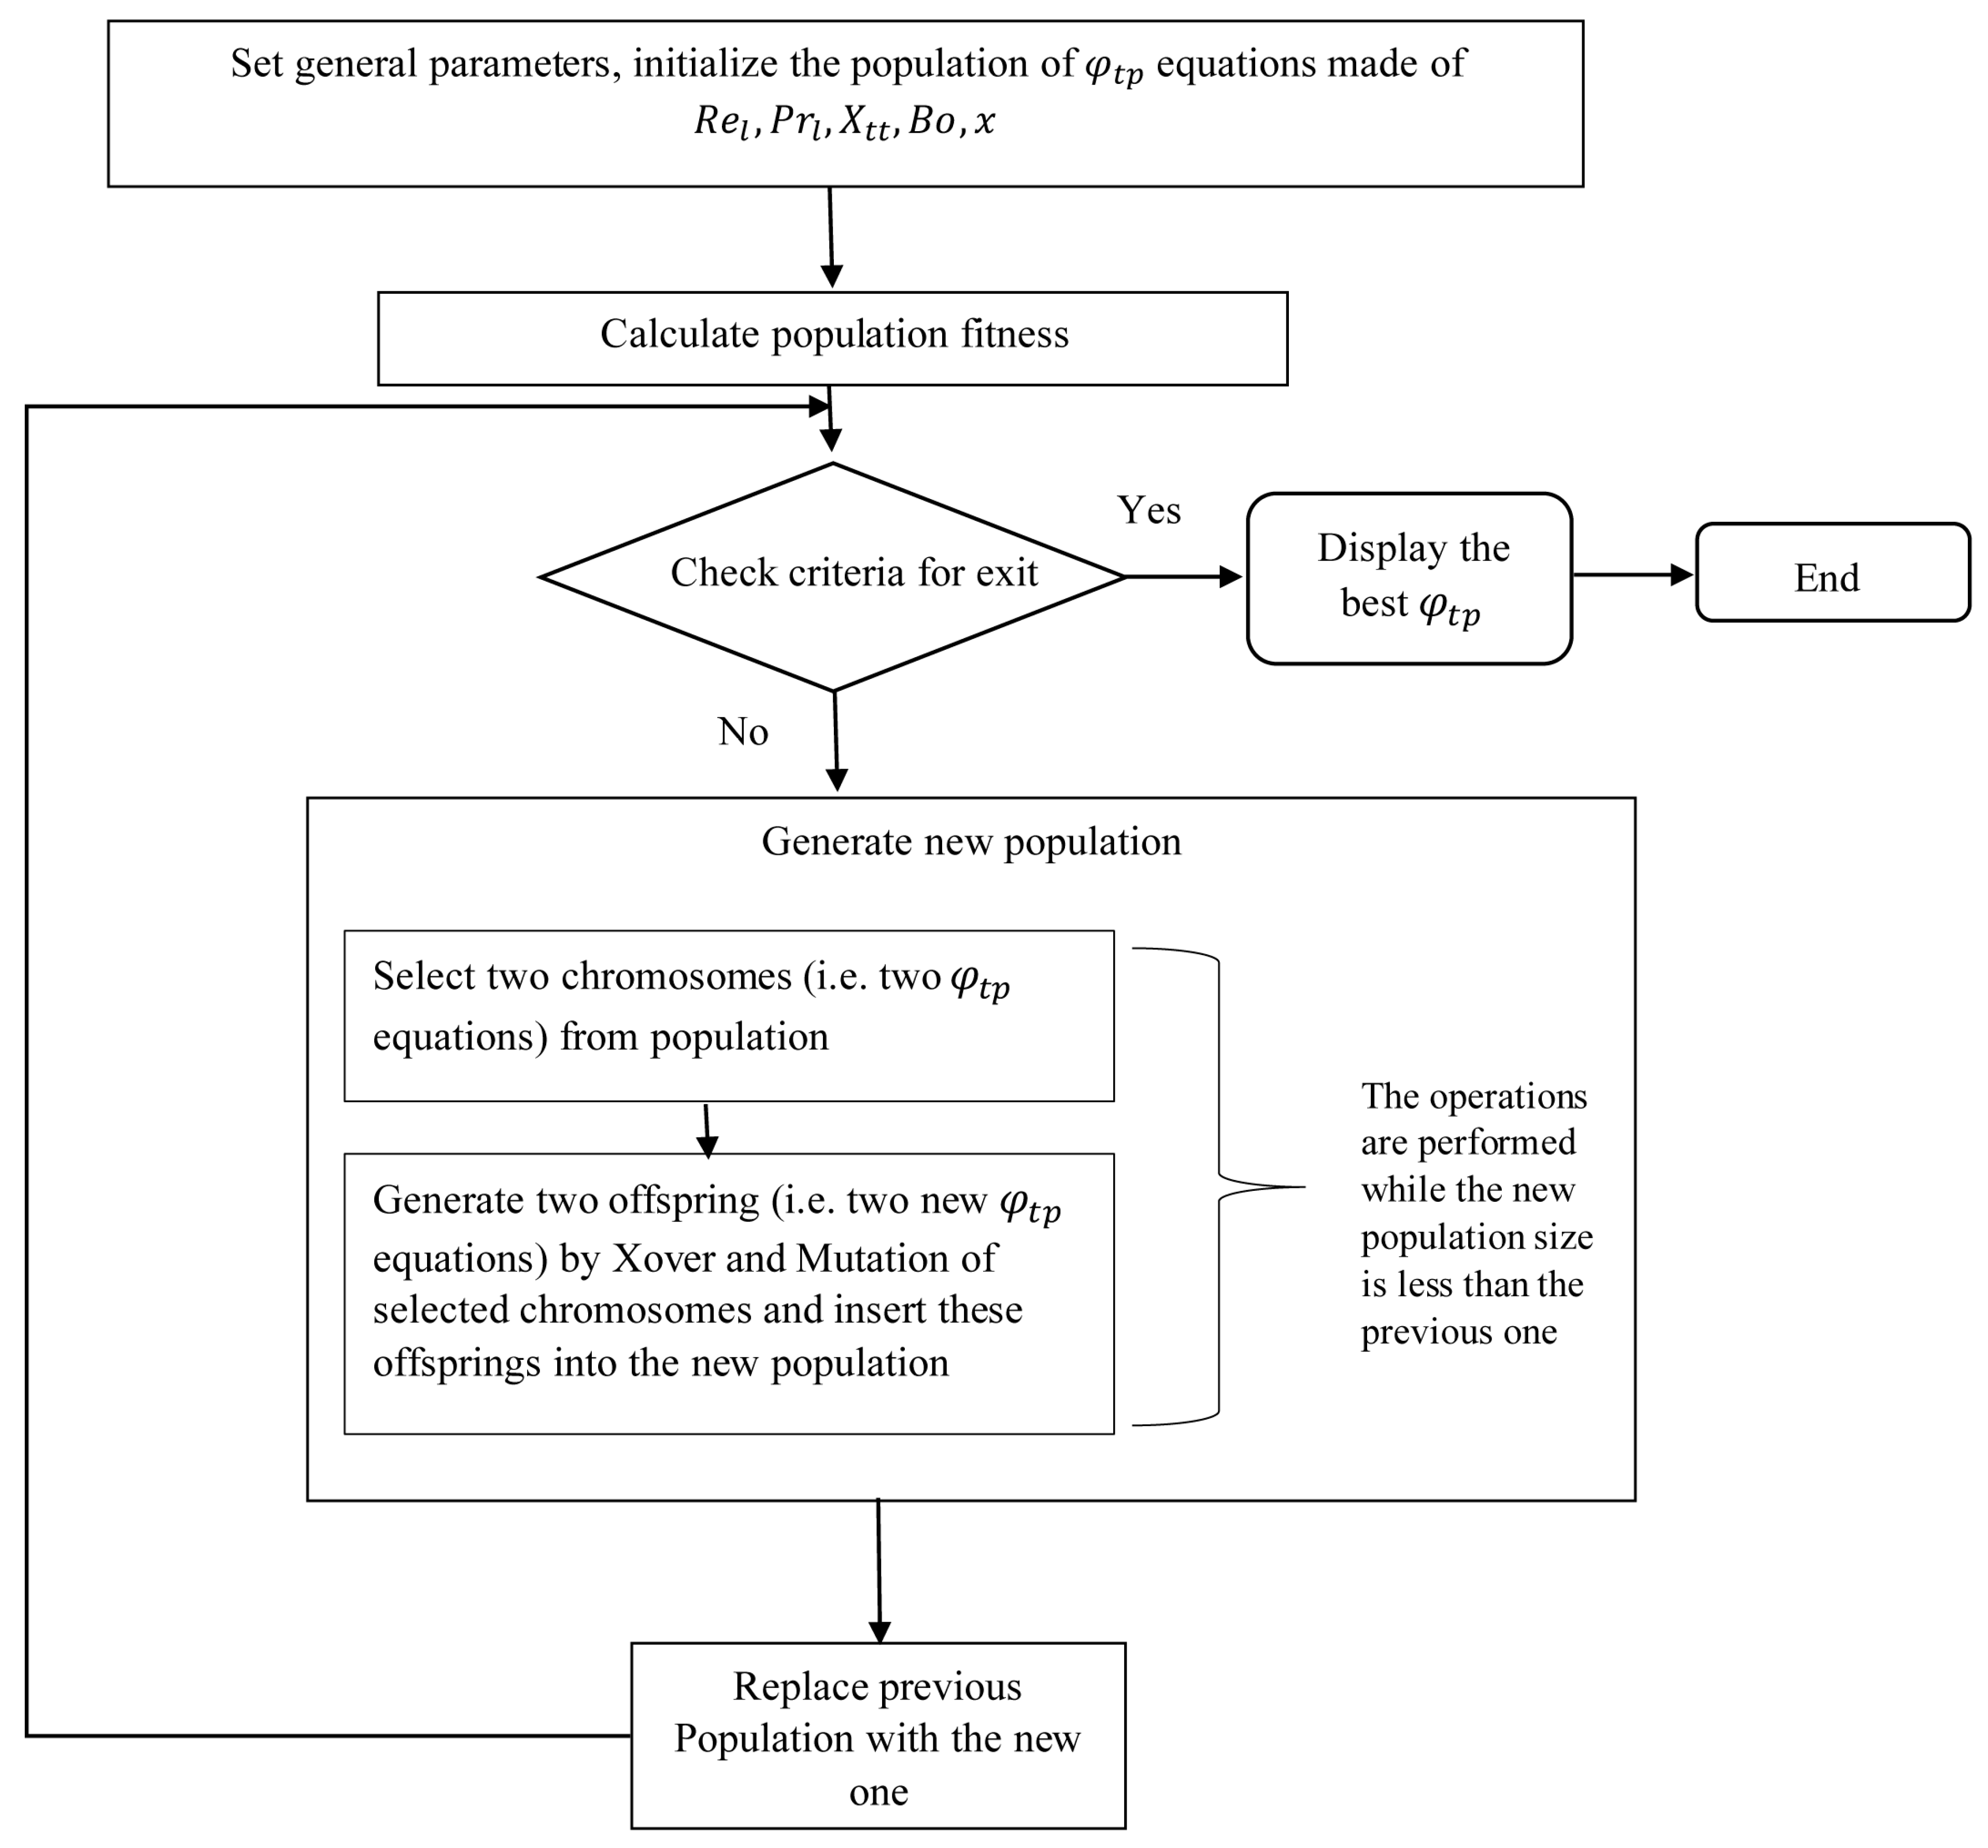
2.1. Genetic Programming

Recently, using intelligent methods for modeling, the thermal and hydrodynamic characterizations of different systems have received much attention [63,64,65,66,67]. In the present paper, GP was used for obtaining a general nonlinear correlation for predicting the HTC during the condensation of fluids inside multi-port mini/micro-channels. The flowchart of the present GP model is shown in Figure 1.
Genetic Programming (GP) is based on genetic algorithms thus it comprises a population. An equation in the population, a member of the population, is presented as a tree structure, thus that its branches contain arithmetic functions (i.e., sin, cos, +, *, etc.), and also its leaves are terminal points (i.e., variables). The initial population has a set of equations that each represents an individual. Combining the individuals of the previous population generates the next population. As such, the new equations are produced by applying the crossover and mutation operations to the equations from the last generation in a way that combines the individuals of the previous generation and creates the next individuals of the new generation. A crossover process operates when two individuals are selected based on their evaluations determined by the objective function, and a mutation process operates on a small percentage of the individuals that result from a crossover. Once the individuals of the next generation meet the problem criteria, the GP process is halted.
This method presents an explicit mathematical model with high accuracy for predicting the experimental data. Our previous studies [68,69,70] used this method to develop general models with high accuracy for thermal and hydrodynamic characterizations of different systems.

2.2. Experimental Data Samples

An extensive database containing 3503 HTC data samples during condensation inside multi-port mini/micro-channels was collected from 21 independent studies, which covered a wide range of working fluids, HDs, mass fluxes, saturation temperatures, and thermophysical properties. The operating parameters for each analyzed source are summarized in Table 1. All thermophysical characteristics of the fluids are computed with the REFPROP 9.1 software from NIST [71] at the saturation conditions of the working fluids. The analyzed data were gathered from experimental studies of average Nutp numbers for refrigerants condensation in multi-port mini/micro-channels. Most of these data are available as figures from the database sources listed in Table 1, which have been extracted using the GetData Graph Digitizer.
In addition to the range of the non-dimensional parameters used, Table 2 sets out the refrigerant types, channel geometry and dimension, and the operating conditions for the analyzed data. The range of dimensional and dimensionless factors is presented in Table 2. The restrictions of applicability of the new correlation for approximating the HTC during flow condensation inside multi-port channels are shown in this table.
In this paper, the term φ t p given by Equation (2) is obtained using the method of GP. The affecting parameters on φ t p in multi-port channels, such as vapor quality, saturation pressure, mass flux, surface tension, channel diameter, and thermophysical properties of the working fluids are considered for developing the new model. These parameters are employed to improve a general correlation for approximating the HTC using the GP. The two-phase multiplier is proposed using the following dimensionless expression,
φ t p = f ( R e l ,   P r l ,   X t t ,   B o ,   x )

2.3. Error Analysis

AARD is used for evaluating the performance of different correlations in this study. Furthermore, the arithmetic average deviation (AAD) is used to assess the over-estimation or under-estimation of the models. These error estimates can be calculated as,
A A D = 1 n i = 1 n ( N u t p ,   c a l c N u t p ,   e x p N u t p ,   e x p ) × 100
A A R D = 1 n i = 1 n | N u t p ,   c a l c N u t p ,   e x p N u t p ,   e x p | × 100

3. Results and Discussion

The former studies showed that the relationships between the two-phase multiplier and the affecting factors were nonlinear. In the present study, a powerful GP method was introduced for developing a nonlinear equation for estimating the two-phase multiplier. Among the many correlations generated by the GP, the best correlation is given by,
φ t p = 0.87 C 1 + 0.63 x + tan ( x ) sin ( 9783.5 P r e d ) + 0.25 C 1 sin ( 9118 P r e d ) x + tan ( tan ( x ) ) sin ( sin ( 9640.4 P r e d ) )
where
C 1 = 0.73 ( 1 + 1 X t t ) + 6.6 X t t R e l + 2.93 X t t exp ( P r l 2 B o ) + 1380.9 + 1211.7 sin ( 0.78 P r l 2 ) R e l
We see that Equation (13) describes a nonlinear correlation, consisting of all affecting dimensionless factors.
To show the performance of the established model for estimating the HTC, the predicted Nusselt number values were compared with the measured values in Figure 2. This result verifies that the GP correlation predictions given by Equation (13) were in the desired range, and most of the data were bounded with an error of less than ± 30%. The calculations showed the suggested correlation estimates of the 3503 data points with an AARD value of 16.87%. In addition, predicted data with an error of less than 20% and 30% for the GP correlation were 70.37% and 84.73%, respectively. These results showed excellent accuracy of the correlation obtained by the GP for approximating the condensation HTC inside multi-port channels.
As noted before, there are various correlation approaches for predicting the condensation HTC. In most of the previous correlations, the authors did not consider the difference between single-port and multi-port channels in the prediction of the HTC. A list of several well-known correlations for estimating the HTC inside single and multi-port channels is presented in Table 3.
For evaluating the capability and generality of the new correlation developed by the GP method, a comparative investigation is presented in this section. Table 4 shows the AARD and AAD values of previous correlations (Table 3) for approximating the condensation HTC as well as the GP correlation for different analyzed data sources.
Based on the results shown in Table 4, the GP correlation (Equation (13)) shows the best results for predicting the condensation HTC in multi-port channels among the available correlation with AARD and AAD values of 16.87% and 2.33%, respectively, for all analyzed data. In addition, the AARD values of the new model for estimating the condensation HTC from most of the analyzed data sources were lower than 20%. These results for estimating the condensation HTC confirm the accuracy and generality of the correlation determined by the GP approach. Among the previous models, the best results were obtained by Kim and Mudawar [52] with a total AARD of 36.94%, which was two times greater than that obtained by the GP correlation. It should be noted that most of the data (2081 of 4045 data points) analyzed by Kim and Mudawar [52] were for multi-port channels. The Dorao and Fernandino [49], Shah (2016) [90], Shah (2019) [57] and Crosser [92] correlations showed almost the same results with total AARD values of 41.54%, 43.39%, 43.45%, and 44.07%, respectively. In addition, the Hosseini et al. [56] model, which was improved based on the experimental data for single port channels, also had fairly big deviations in estimating the HTC inside multi-port channels with an AARD of 44.68%. This observation verified that the HTC in multi-port mini/micro-channels differs from that in single port channels. The Bohdal et al. [93] and Akers et al. [91] had the highest deviations with the experimental data among the previous correlations, with the AARD values of, respectively, 164.97% and 191.19%. Therefore, these correlations did not provide reasonable predictions for multi-port mini/micro-channels. Although the previous models exhibit nice accordance with some data sources, none of the models can be used as a general correlation for predicting the condensation HTC in multi-port mini/micro-channels. The new correlation and all of the previous models result in large deviations from the experimental data reported by Belchi et al. [79] and Pham et al. [85] with AARD values of 52.30% and 42.09%, respectively.
To show the accuracy of the other models, the results estimated by Kim and Mudawar [52], Dorao and Fernandino [49], Shah (2019) [57], Shah (2016) [90], Crosser [92], and Hosseini et al. [56] correlations were examined in contrast to the measured values in Figure 3. This figure confirms the above assertion that the previous models have relatively large deviations from the measured values of the condensation HTC in multi-port mini/micro-channels.
The accuracy evaluation of previous models and our model for estimating the HTC inside multi-port micro and mini-channels based on Kandlikar [19] classification was given in Table 5. This table verifies that GP correlation (Equation (13)) can predict the HTC in both micro and mini-channels reasonably well and exhibits the best agreements with the experimental data among all available models with AARD of 16.60% and 16.91% for micro- mini channels, respectively. In addition, our approach predicts almost 85% of data for both micro- mini channels with an error of less than 30%. The Kim and Mudawar correlation [52] predicts 63.44% of the data for mini-channels with an error of lower than 30%. However, its overall accuracy for mini-channels is not satisfactory, with an AARD of 36.94%. In addition, its deviations for micro-channels are much more significant, and its AARD for micro-channels is 59.10%.
The models developed by Dorao and Fernandino [49], Shah (2016) [90], Shah (2019) [57], and Crosser [92] do not provide acceptable results for multi-port micro and mini-channels, and their AARD values for all cases are more than 35%. Furthermore, similar to Kim and Mudawar [52] model, their deviations for micro-channels are significantly higher than those for mini-channels. The models of Bohdal et al. [93] and Akers [91] show substantial deviations for both micro and mini-channels, and they cannot be used for multi-port channels.
In the condensation of the fluids in multi-port channels, the surface tension force plays a remarkable role in controlling the HTC, and its effect becomes more critical as channel diameter is reduced [94]. The effect of the surface tension force was explicitly considered in the new correlation given by Equation (12) using the Bond number. This dimensionless number (Bo) quantifies the relative importance of surface tension forces compared to the gravitational ones. Therefore, the Bo number is important for condensation HTC modeling of multi-port channels, especially for smaller diameters. However, in most of the previous correlations, there was no factor accounting for the effect of surface tension force.
It should be noted that some comparisons between the measured HTC reported by different sources were conducted at identical conditions in [94]. A high degree of consistency between analyzed experimental data was observed. It means that the accurate intelligent based models obtained for a broad range of operational and geometrical conditions capable of estimating HTC for new independent sources, properly. Moreover, the GP-based models outperform earlier models when examining data samples other than those used for developing GP models, as reported in the previous studies [56,94].
The physical trends of the established model and those of Kim and Mudawar [52], as the most accurate model among the previous correlations, are presented in Figure 4, Figure 5, Figure 6 and Figure 7. Here, the influence of the input parameters on the HTC in multi-port channels, are also discussed.
Figure 4 illustrates the impacts of the vapor quality and flow mass flux on the HTC during the condensation of the R744 in a multi-port channel with a HD of 0.13 mm at the saturation temperature of 15 °C. The experimental data shows that the condensation HTC increased with increasing the vapor quality and mass flux. This was in accordance with Sikora et al. [95] findings for the HFE 7000 refrigerant in microchannels. According to Coleman and Garimella [96] flow patterns, the flow regime changes from slug and bubbly with thick liquid film to annular with thin liquid film by raising the vapor quality. In addition, increasing the mass flux can increase the shear stress at the two phases interface, and the liquid film thickness reduces. Therefore, increasing the mass flux and vapor quality decreases the liquid film thickness and increases the HTC. Figure 4 shows that the GP correlation shows good accordance with the experimental data. However, the correlation of Kim and Mudawar [52] underestimates the measured values.
The predicted HTCs for R134a are examined in contrast to the real data for saturation temperatures of 50 and 60 °C in Figure 5. This result showed that the HTCs for the saturation temperature of 50 °C were higher than those for 60 °C. Table 6 presents the thermophysical characteristics of the R134a at the saturation temperatures of 50 and 60 . Reducing the saturation temperature led to higher liquid density and lower vapor density. Therefore, the vapor velocity was increased, and the liquid velocity was reduced and led to a higher velocity difference at the two phases interface. Therefore, higher interfacial shear stress and thinner liquid film were obtained at the lower saturation temperature, and the HTC increased. In addition, R134a had a higher liquid thermal conductivity at the saturation temperature of 50 °C. Therefore, its thermal resistance in liquid film at this temperature was lower, which resulted in a higher HTC. Figure 5 shows that the GP and Kim and Mudawar [52] correlations showed the same trends for different saturation temperatures. However, the GP correlation led to a much better agreement with the experimental data.
Figure 6 compares the HTC of R744 at the saturation temperature of 0 for two different channel diameters. The experimental data and empirical correlations show that the HTCs of R744 in the channels with 0.68 mm hydraulic diameter was slightly higher than those for the channel with 0.78 mm hydraulic diameters. As was noted previously, the surface tension force plays a more critical role in the smaller channels, and the interactions of the phases increase. Therefore, the liquid film becomes thinner, and the HTC increases. Figure 6 shows that the new GP correlation is consistent with the experimental data, while the correlation of Kim and Mudawar [52] overestimated the HTC.
Figure 7 shows the effect of the working fluids (R32 and R290) on the HTC. As shown in this figure, the condensation HTCs for R290 as the working fluid were higher than that for R32. The thermophysical properties of the R32 and R290 at the constant saturation temperature of 40 °C are compared in Table 7. Accordingly, R290 had lower liquid and vapor densities. Thus, the liquid and vapor velocities for R290 were higher than those for R32 at the same mass flux. Therefore, the shear stress at the interface increased, which resulted in a higher HTC. In addition, the latent heat of vaporization of R290 was higher than that of R32. This information also justifies the higher HTCs for R290. Figure 7 also shows that the GP and Kim and Mudawar correlations predict the same trends for different working fluids. However, the GP correlation results were in closer accordance with the real data.

4. Conclusions

A new general correlation for predicting the condensation HTC in multi-port mini and micro-channels was developed using the method of genetic programming. For validating the established model, 3503 experimental data points were collected from 21 published papers covering a broad range of working fluids and operating conditions. Key conclusions of this study are:
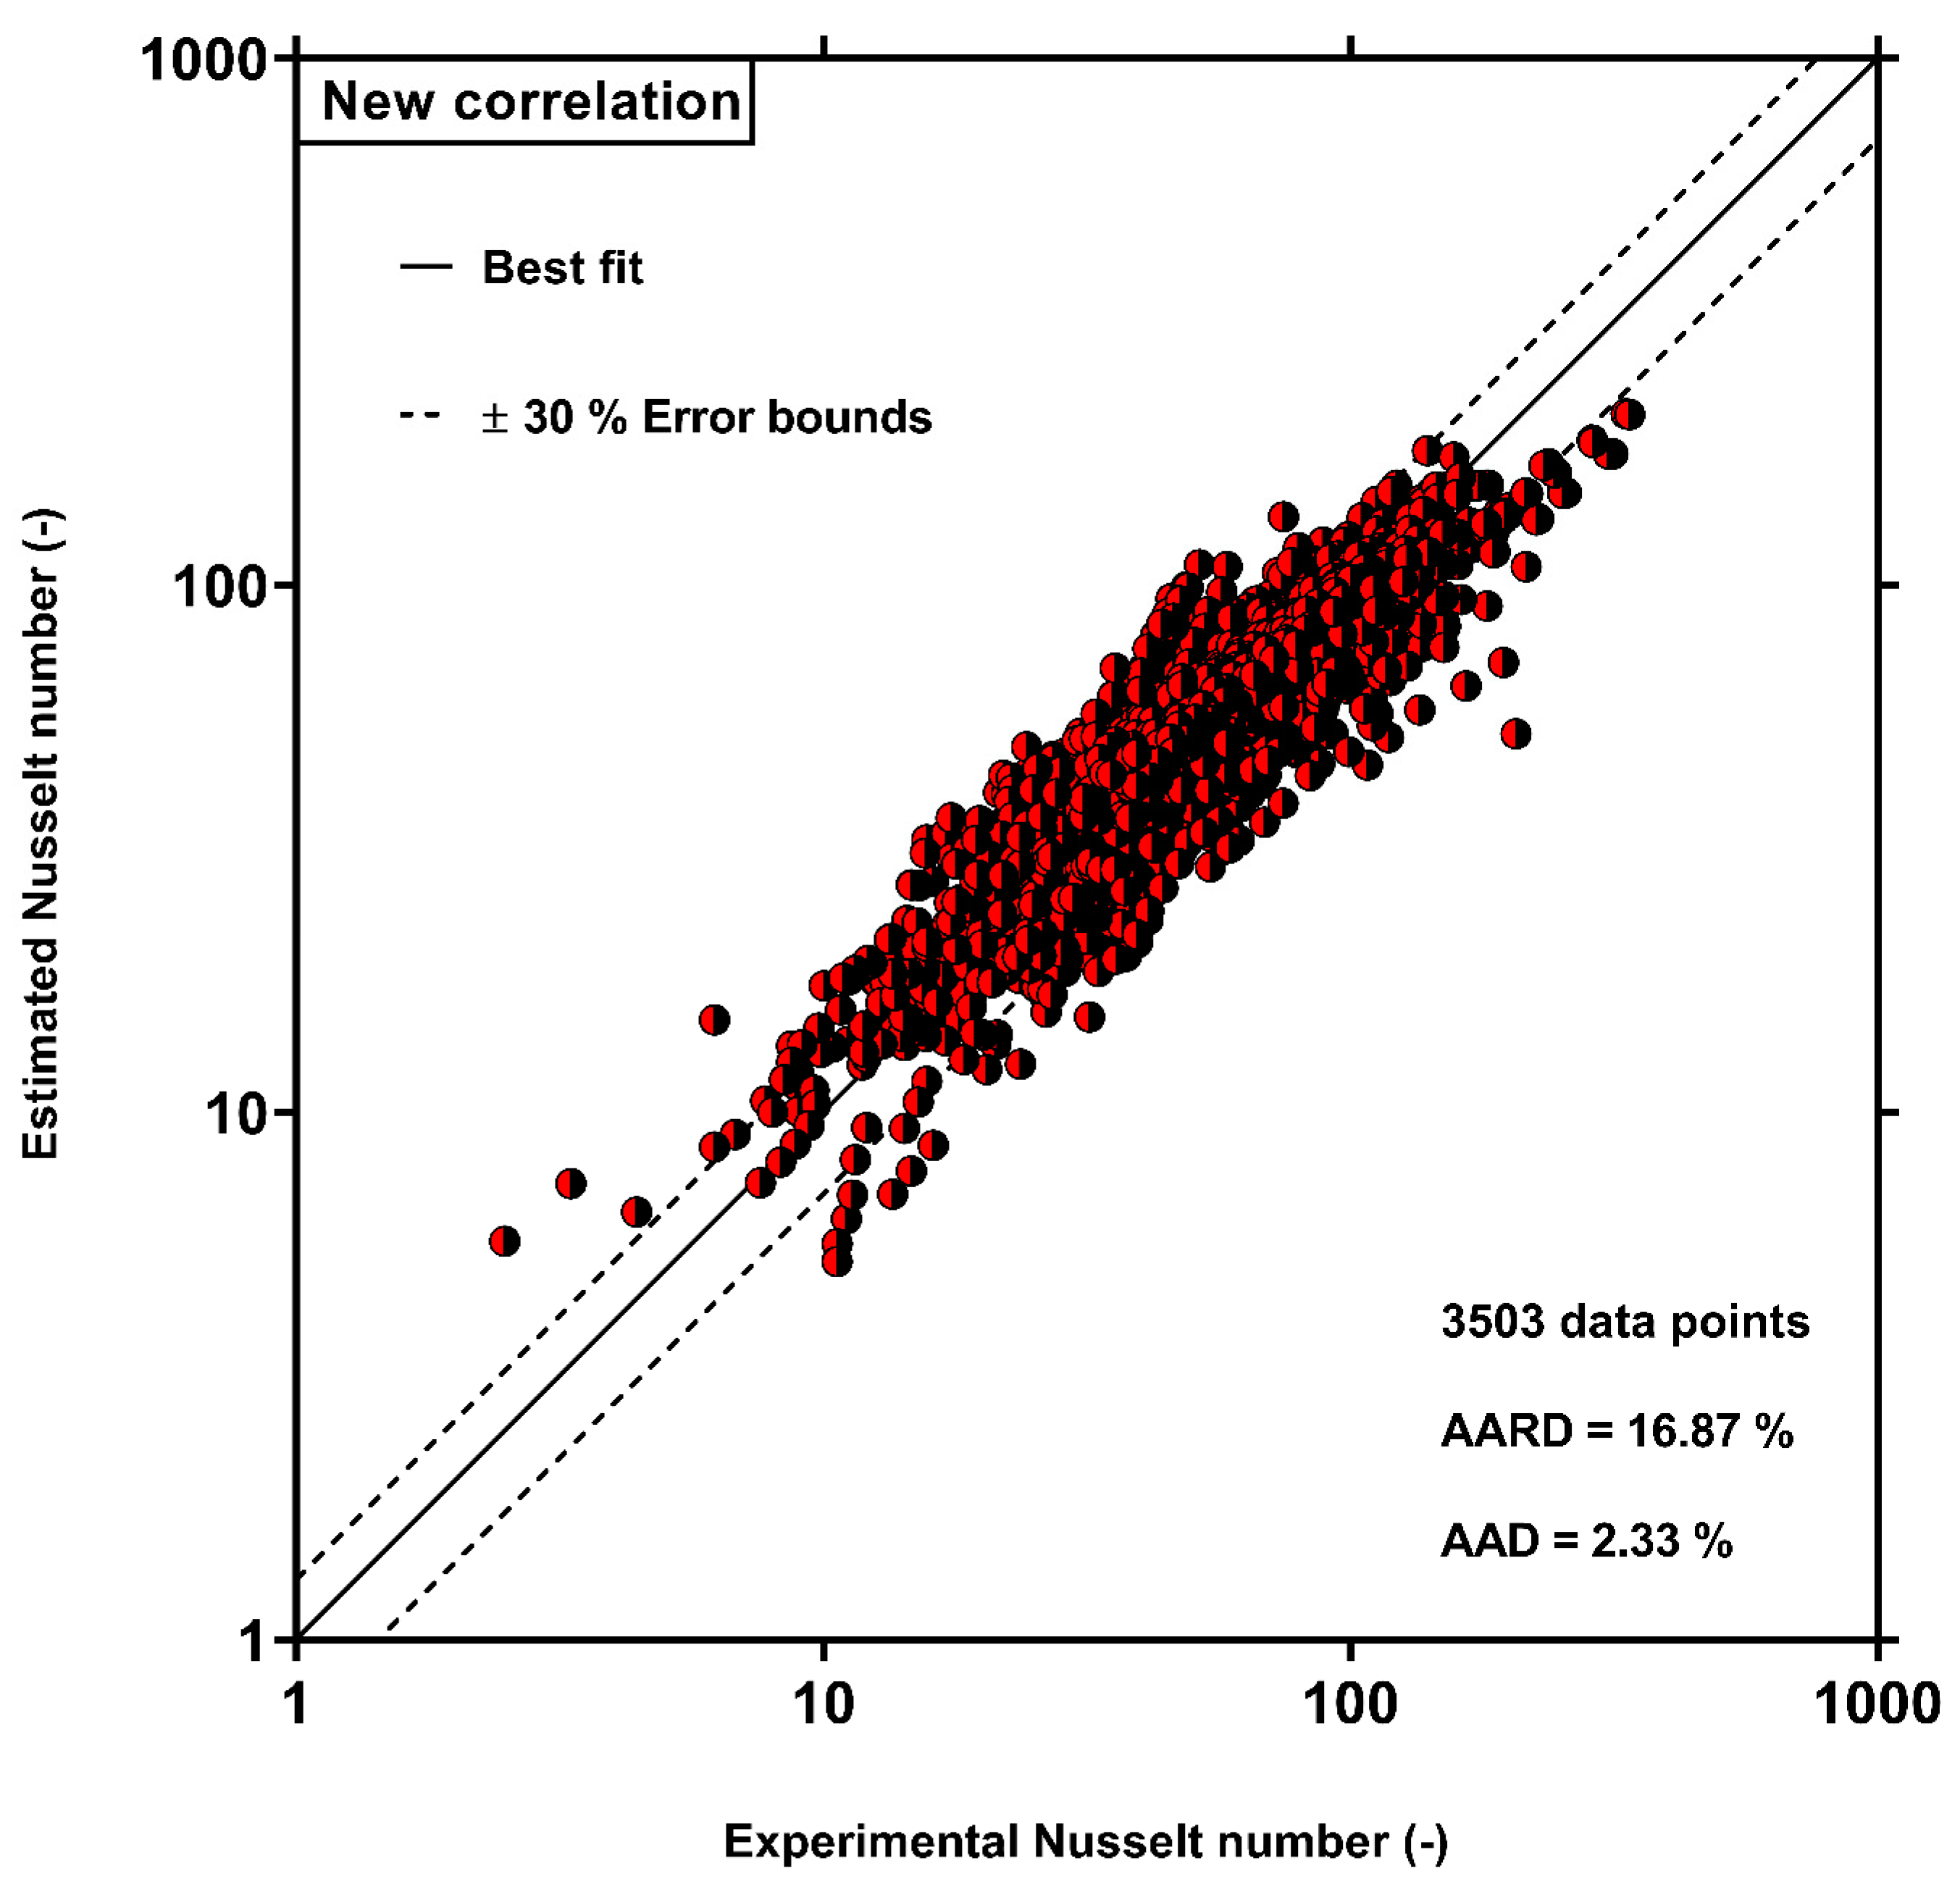
  • The effects of all affecting parameters ( R e l ,   P r l ,   X t t ,   B o ,   x ) on the HTC were considered in the GP correlation. Using these parameters led to a correlation that estimates the condensation HTC with reasonable accuracy. The new correlation estimated the HTC with a total AARD of 16.87% for a broad range of data samples. In addition, the percentages of all data with error lower than 20% and 30% for the new model were 70.04% and 84.43%, respectively.
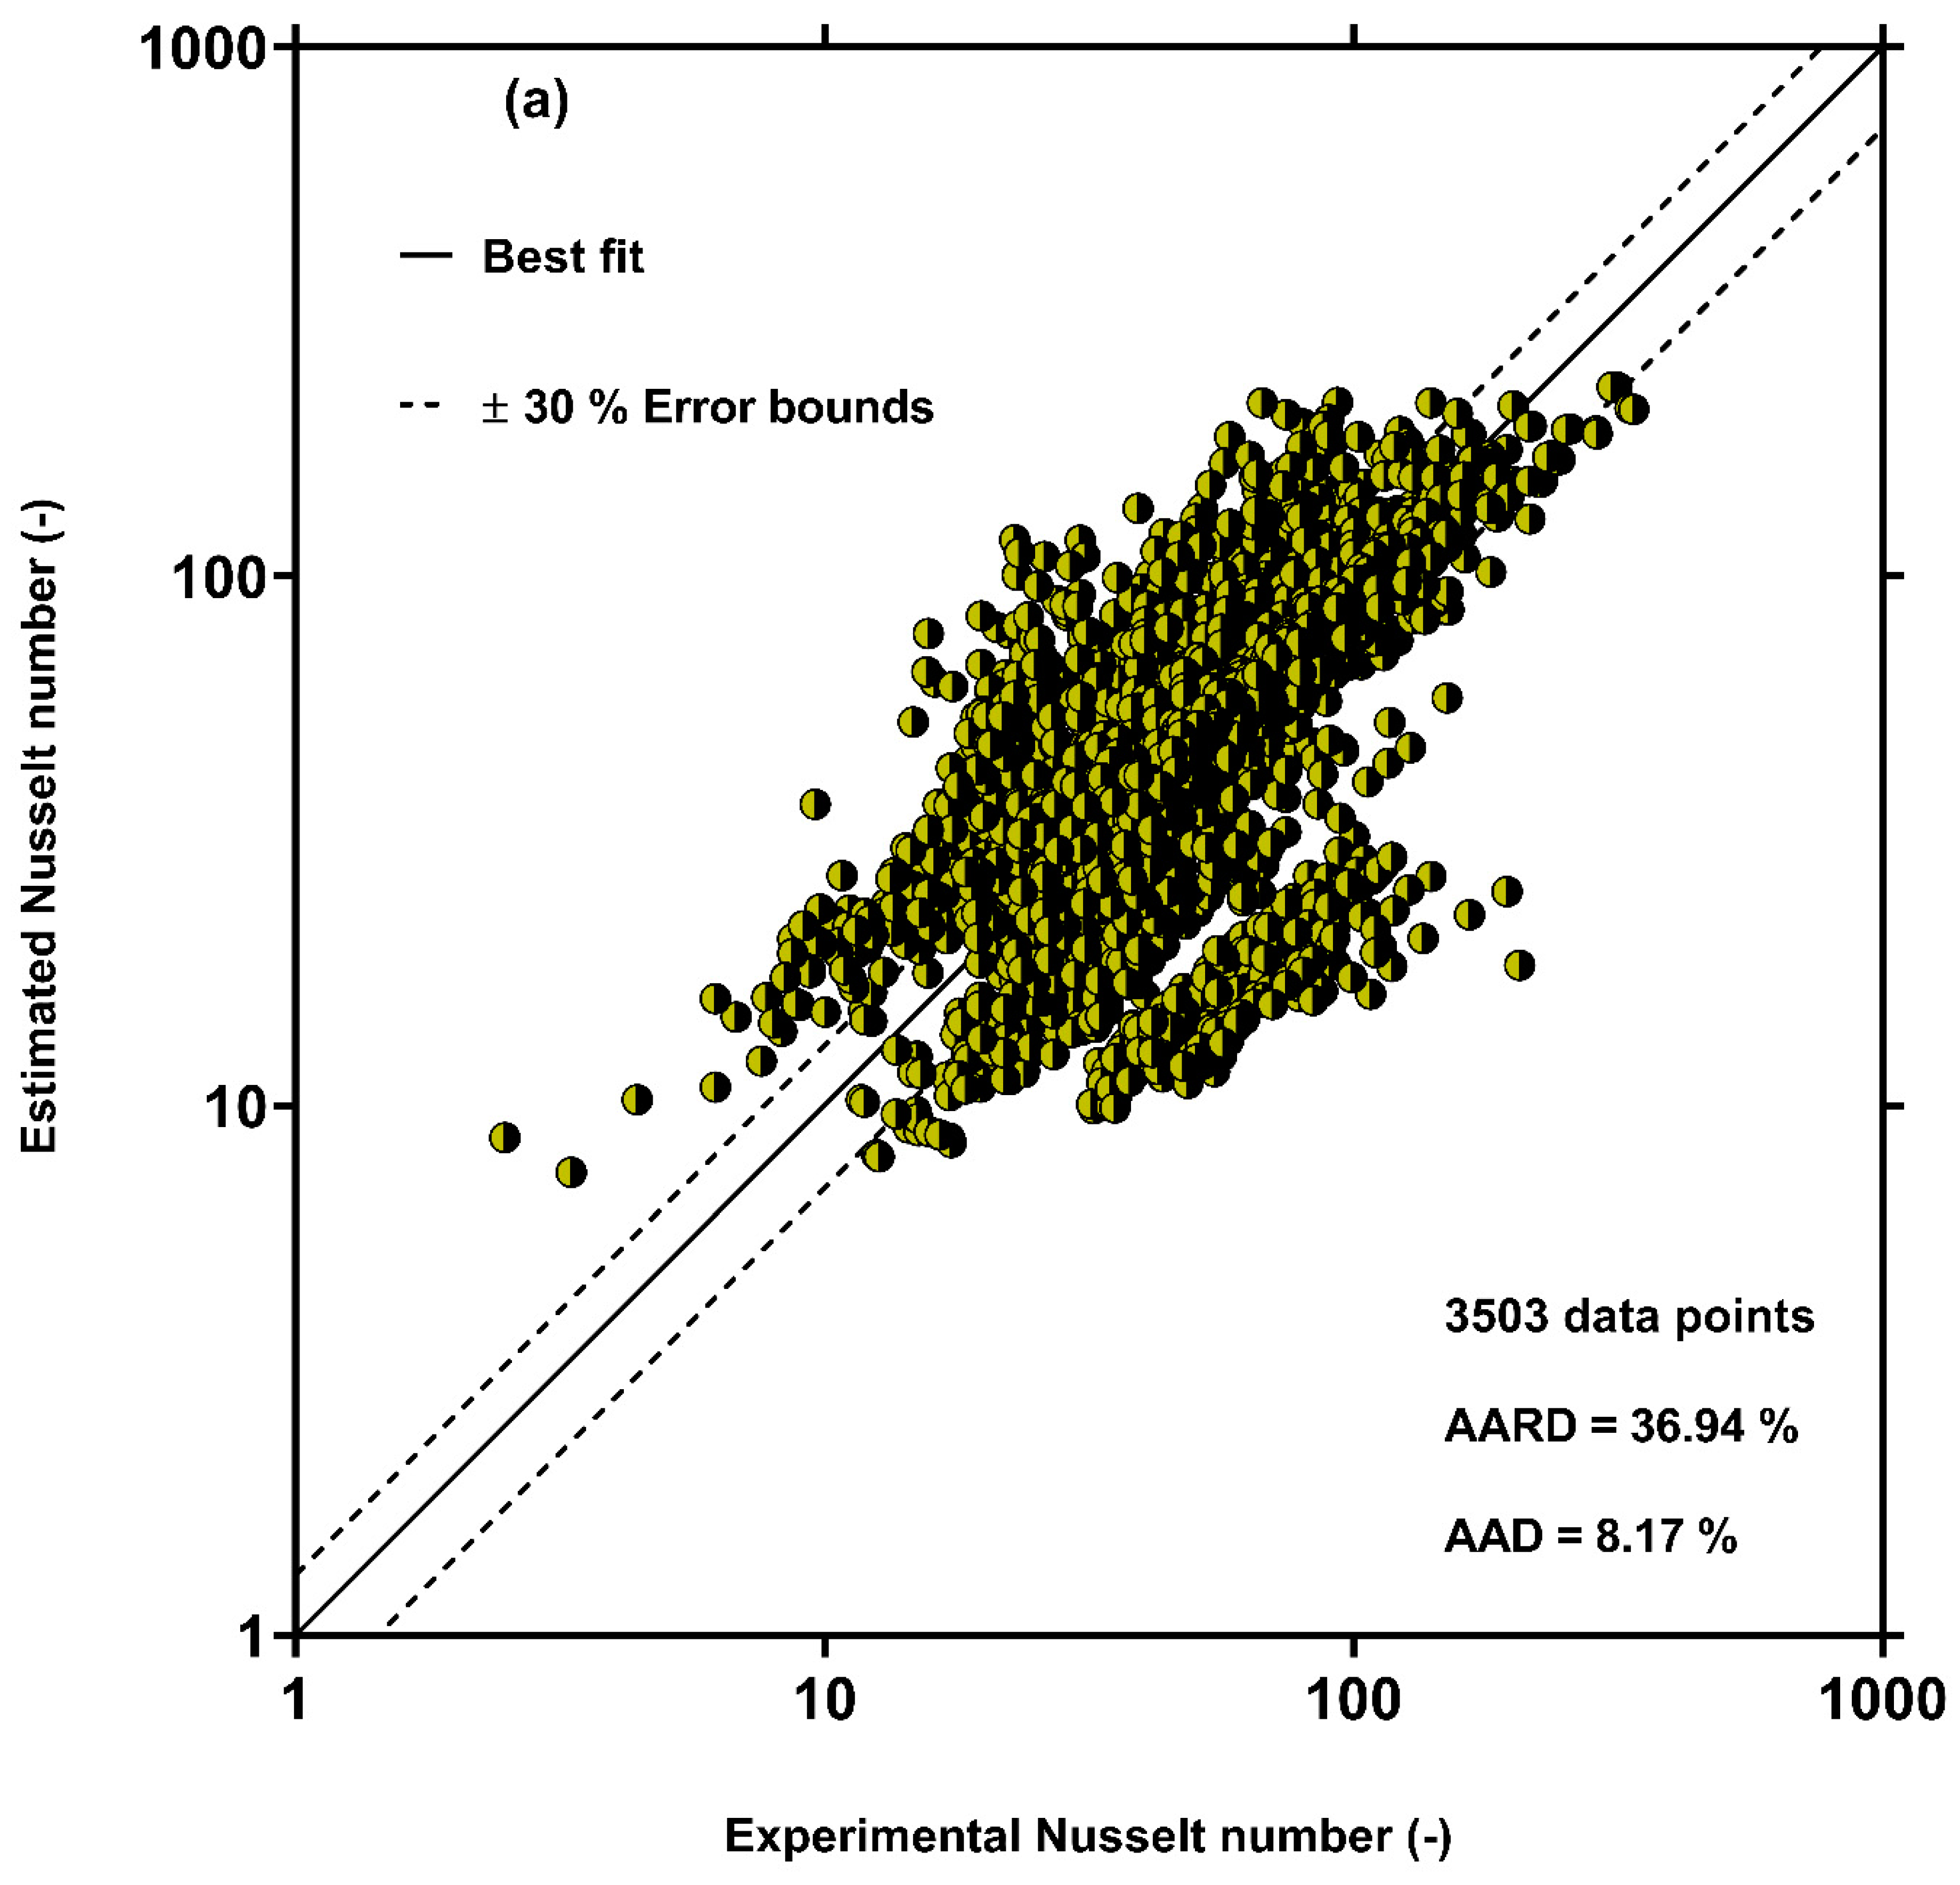
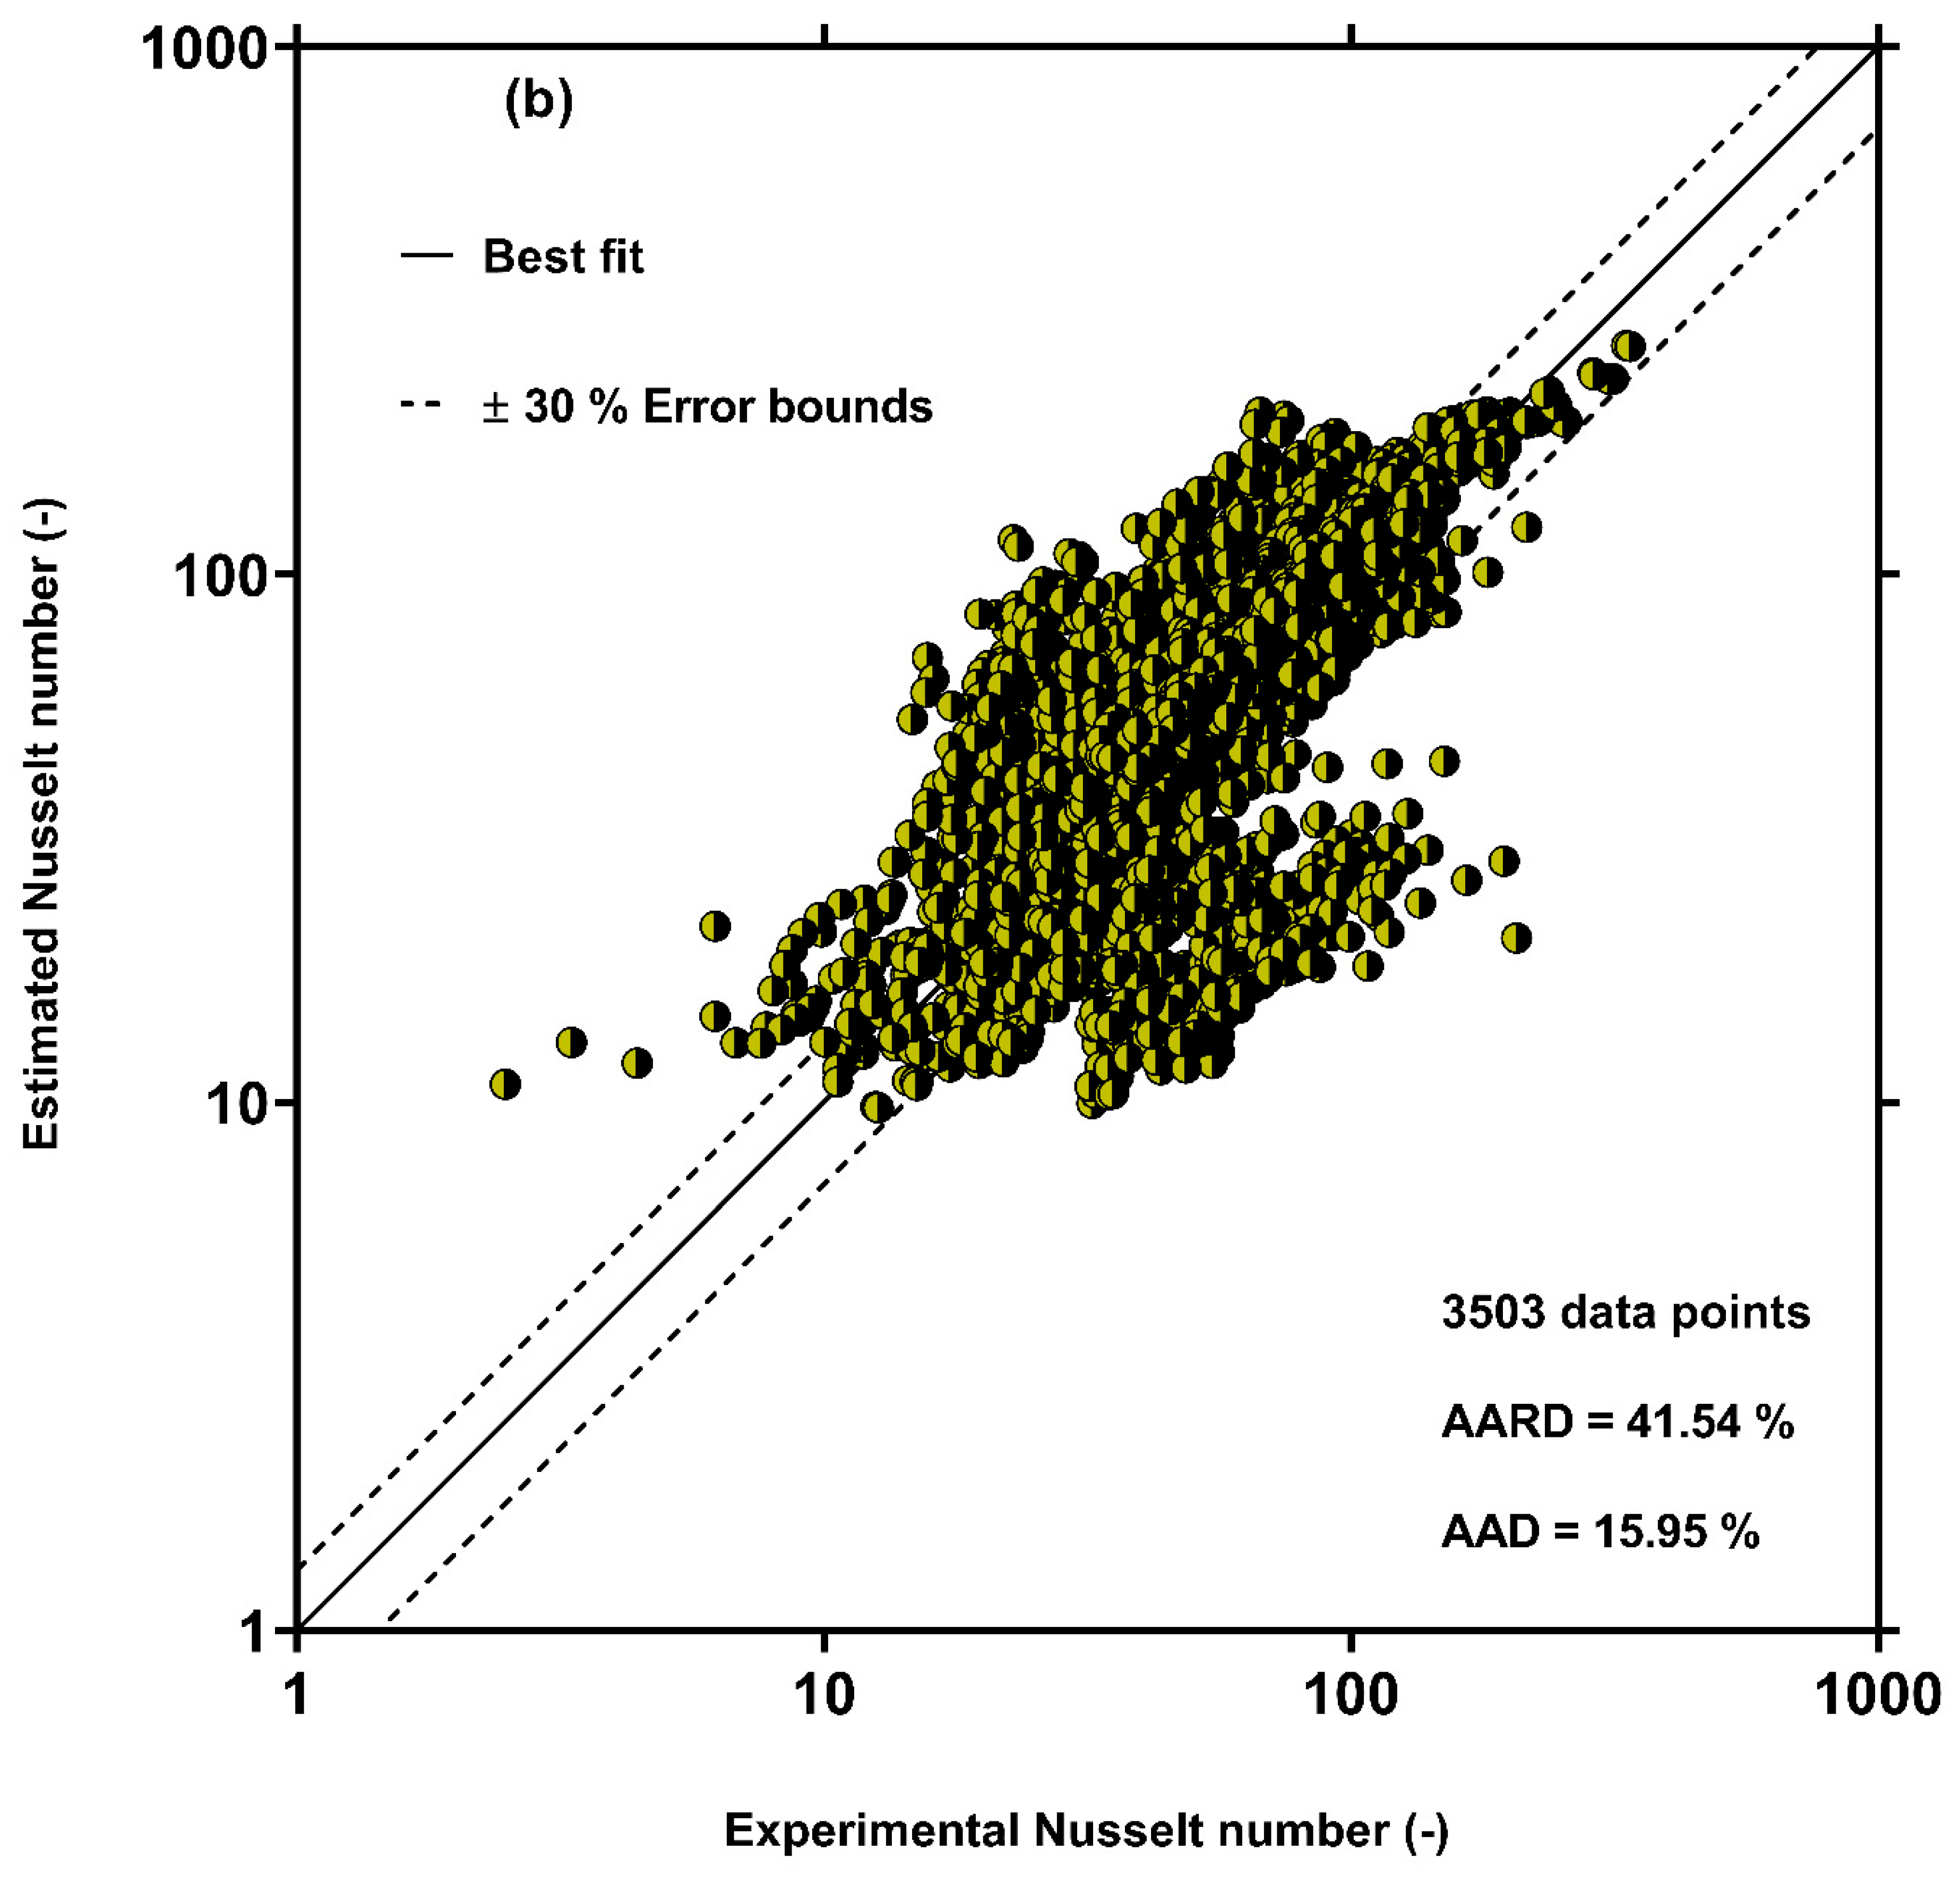
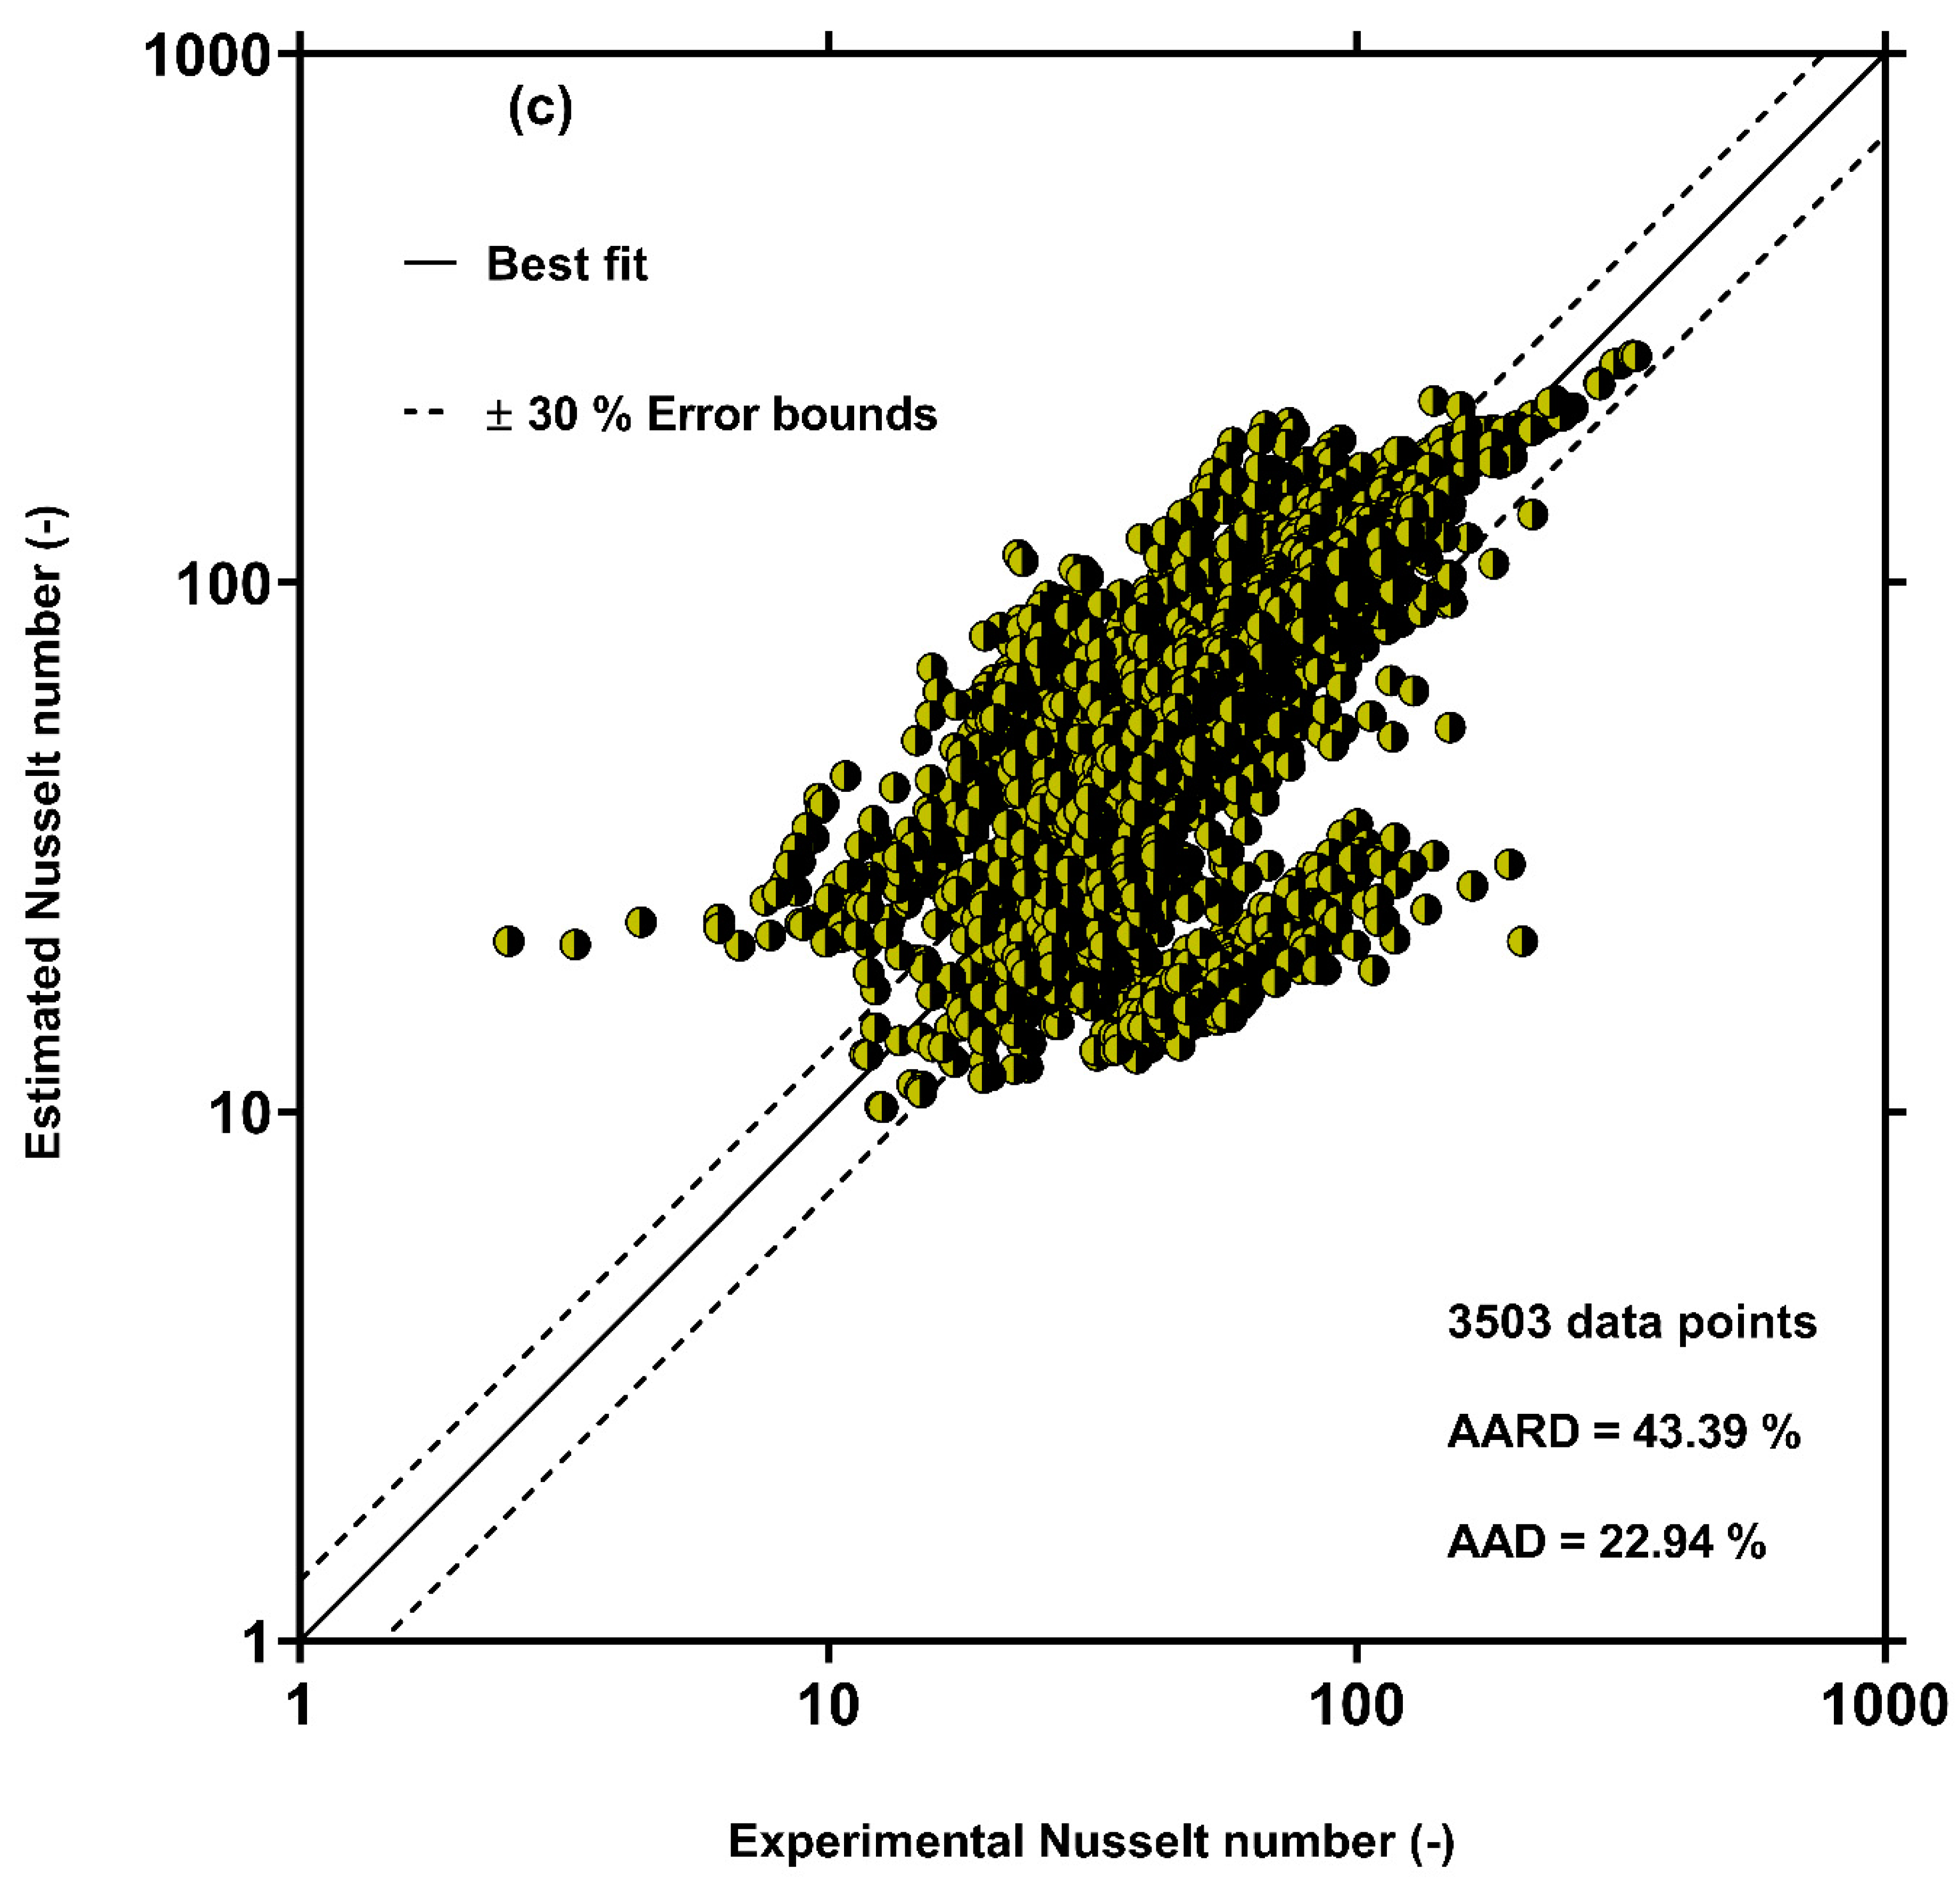
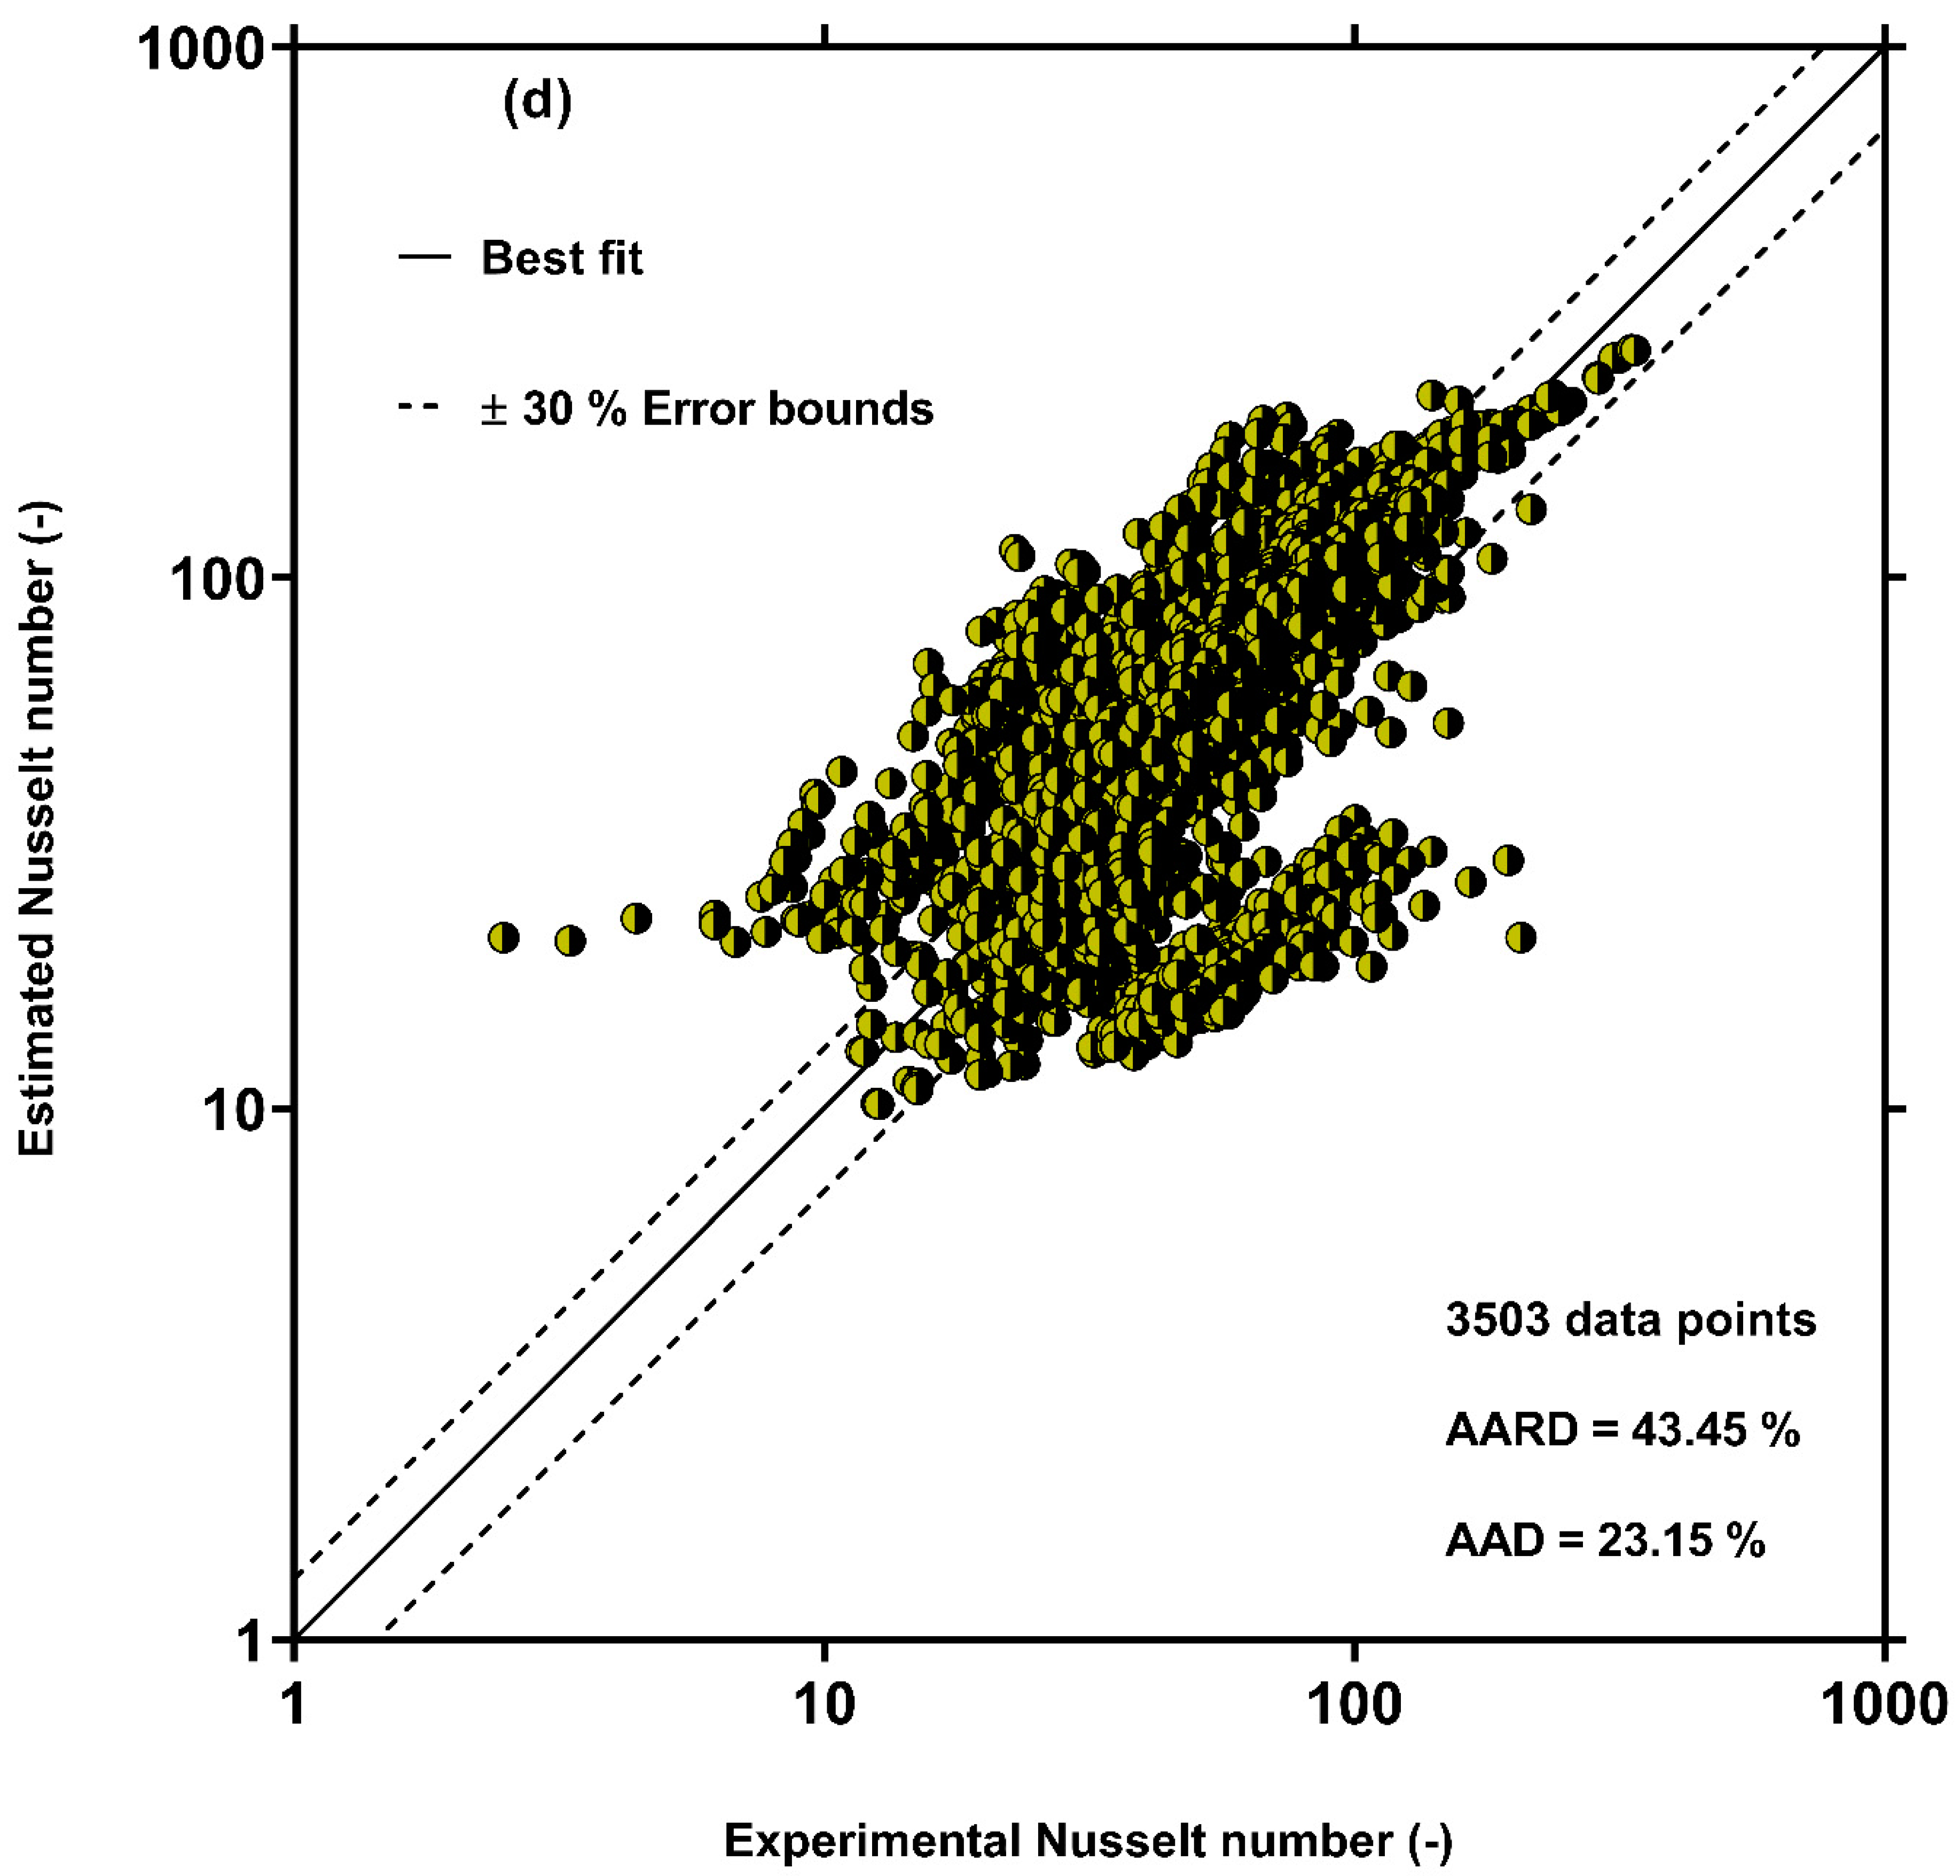
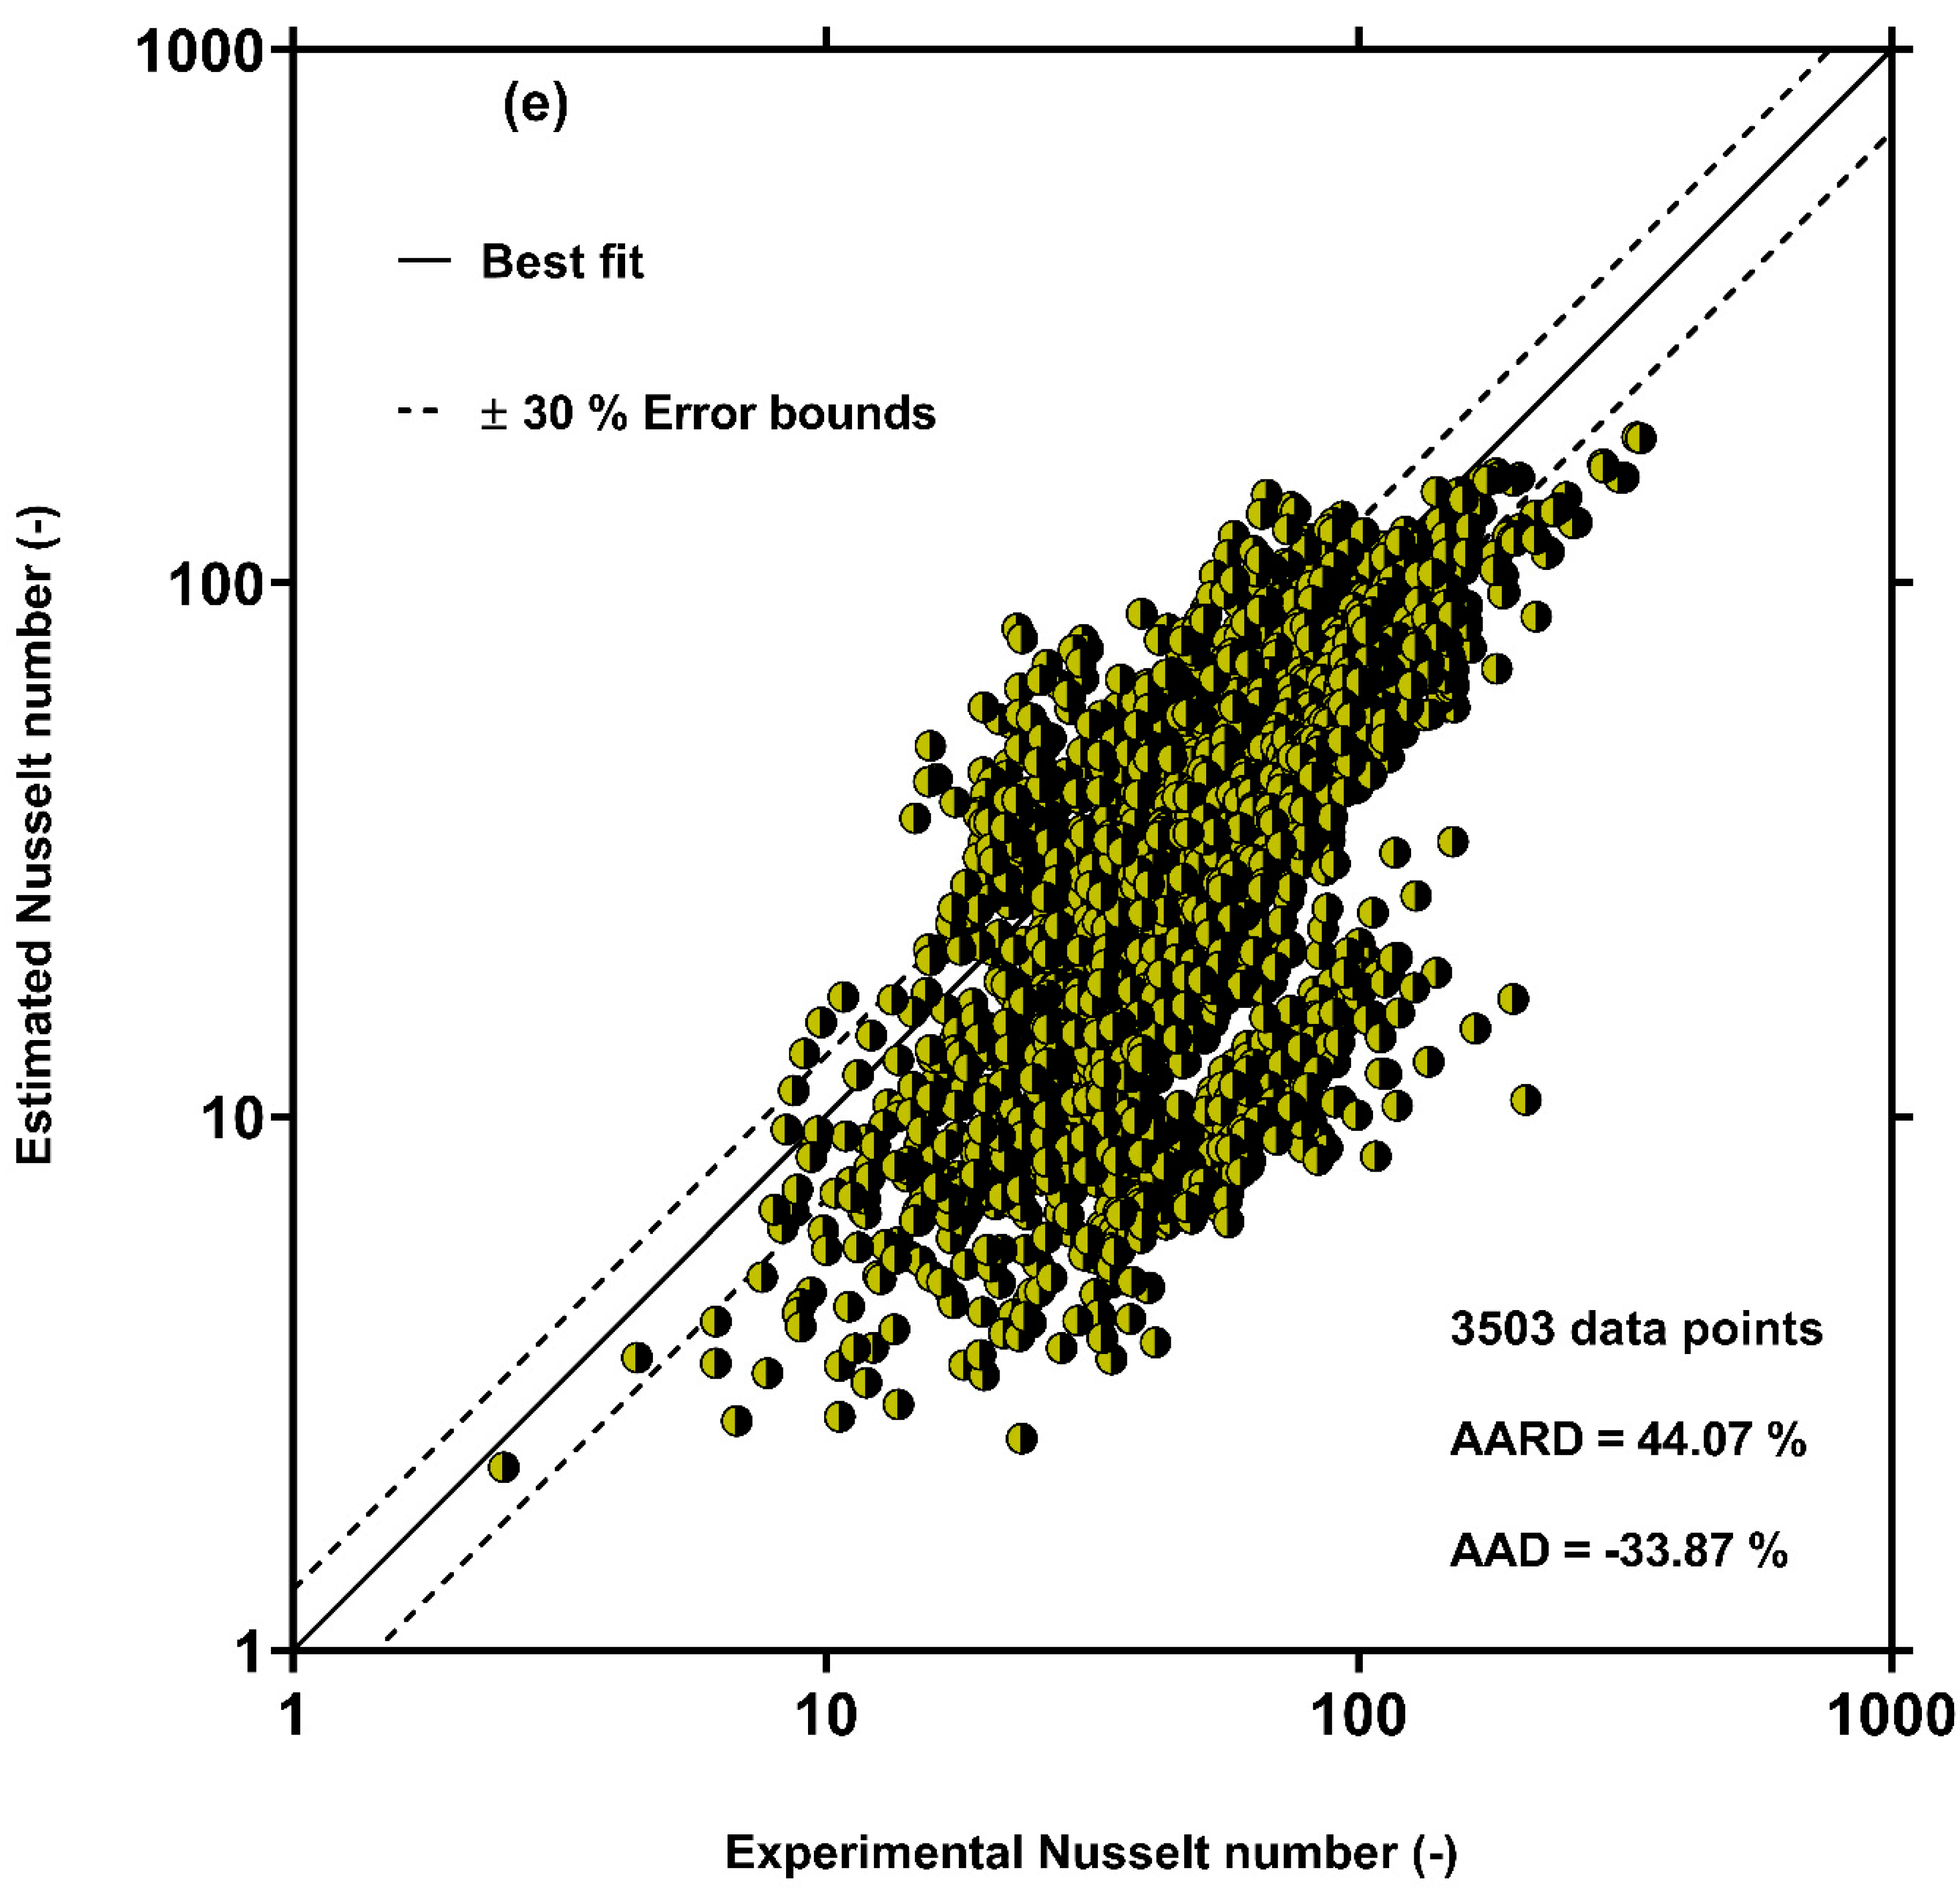
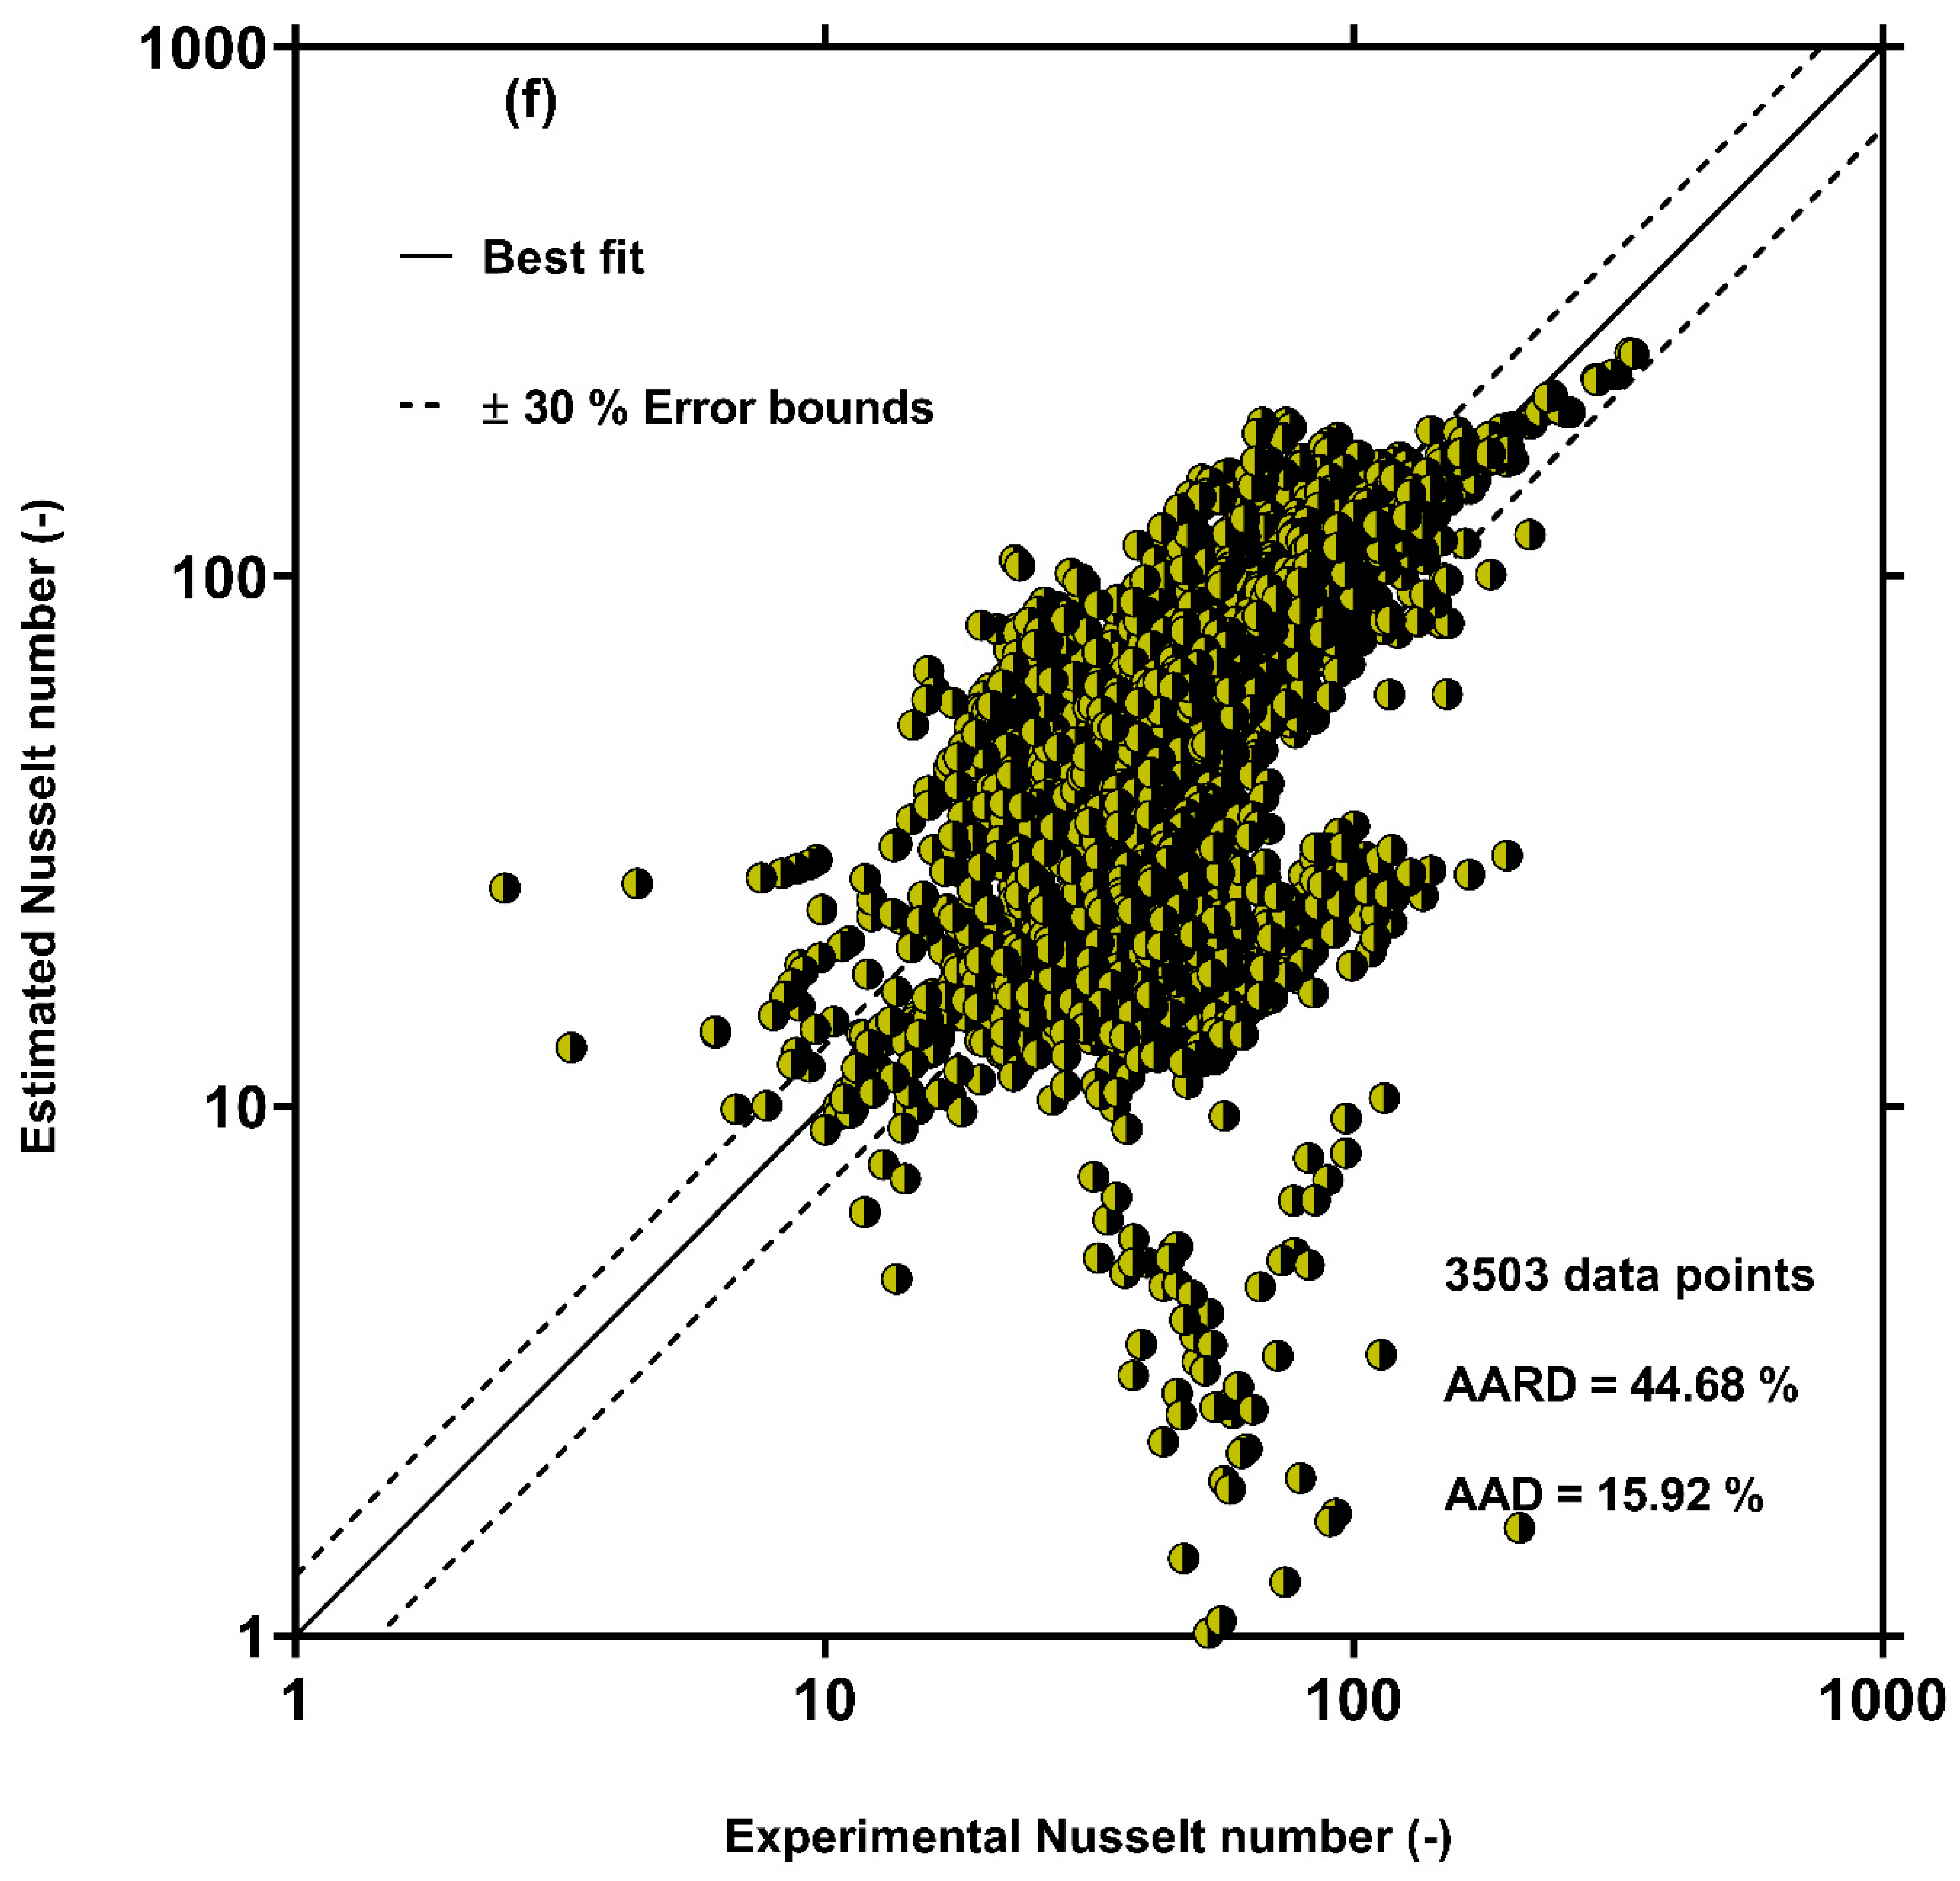
  • The previous models’ predictions of the HTC were also compared to the measured data. The previous correlations showed significantly higher deviations from the experimental data compared to the new correlation. The total AARD values for the correlations of Kim and Mudawar [52], Dorao and Fernandino [49], Shah (2016) [90], Shah (2019) [57], Crosser [92], Hosseini et al. [56], Bohdal et al. [93], and Akers et al. [91] were, respectively, 36.94%, 41.54%, 43.39%, 43.45%, 44.07%, 44.68%, 164.97%, 191.19%. It was found that the previous models can not be considered as general correlations for estimating the condensation HTC in multi-port channels. However, the new GP correlation provides much-improved estimates for the HTCs.
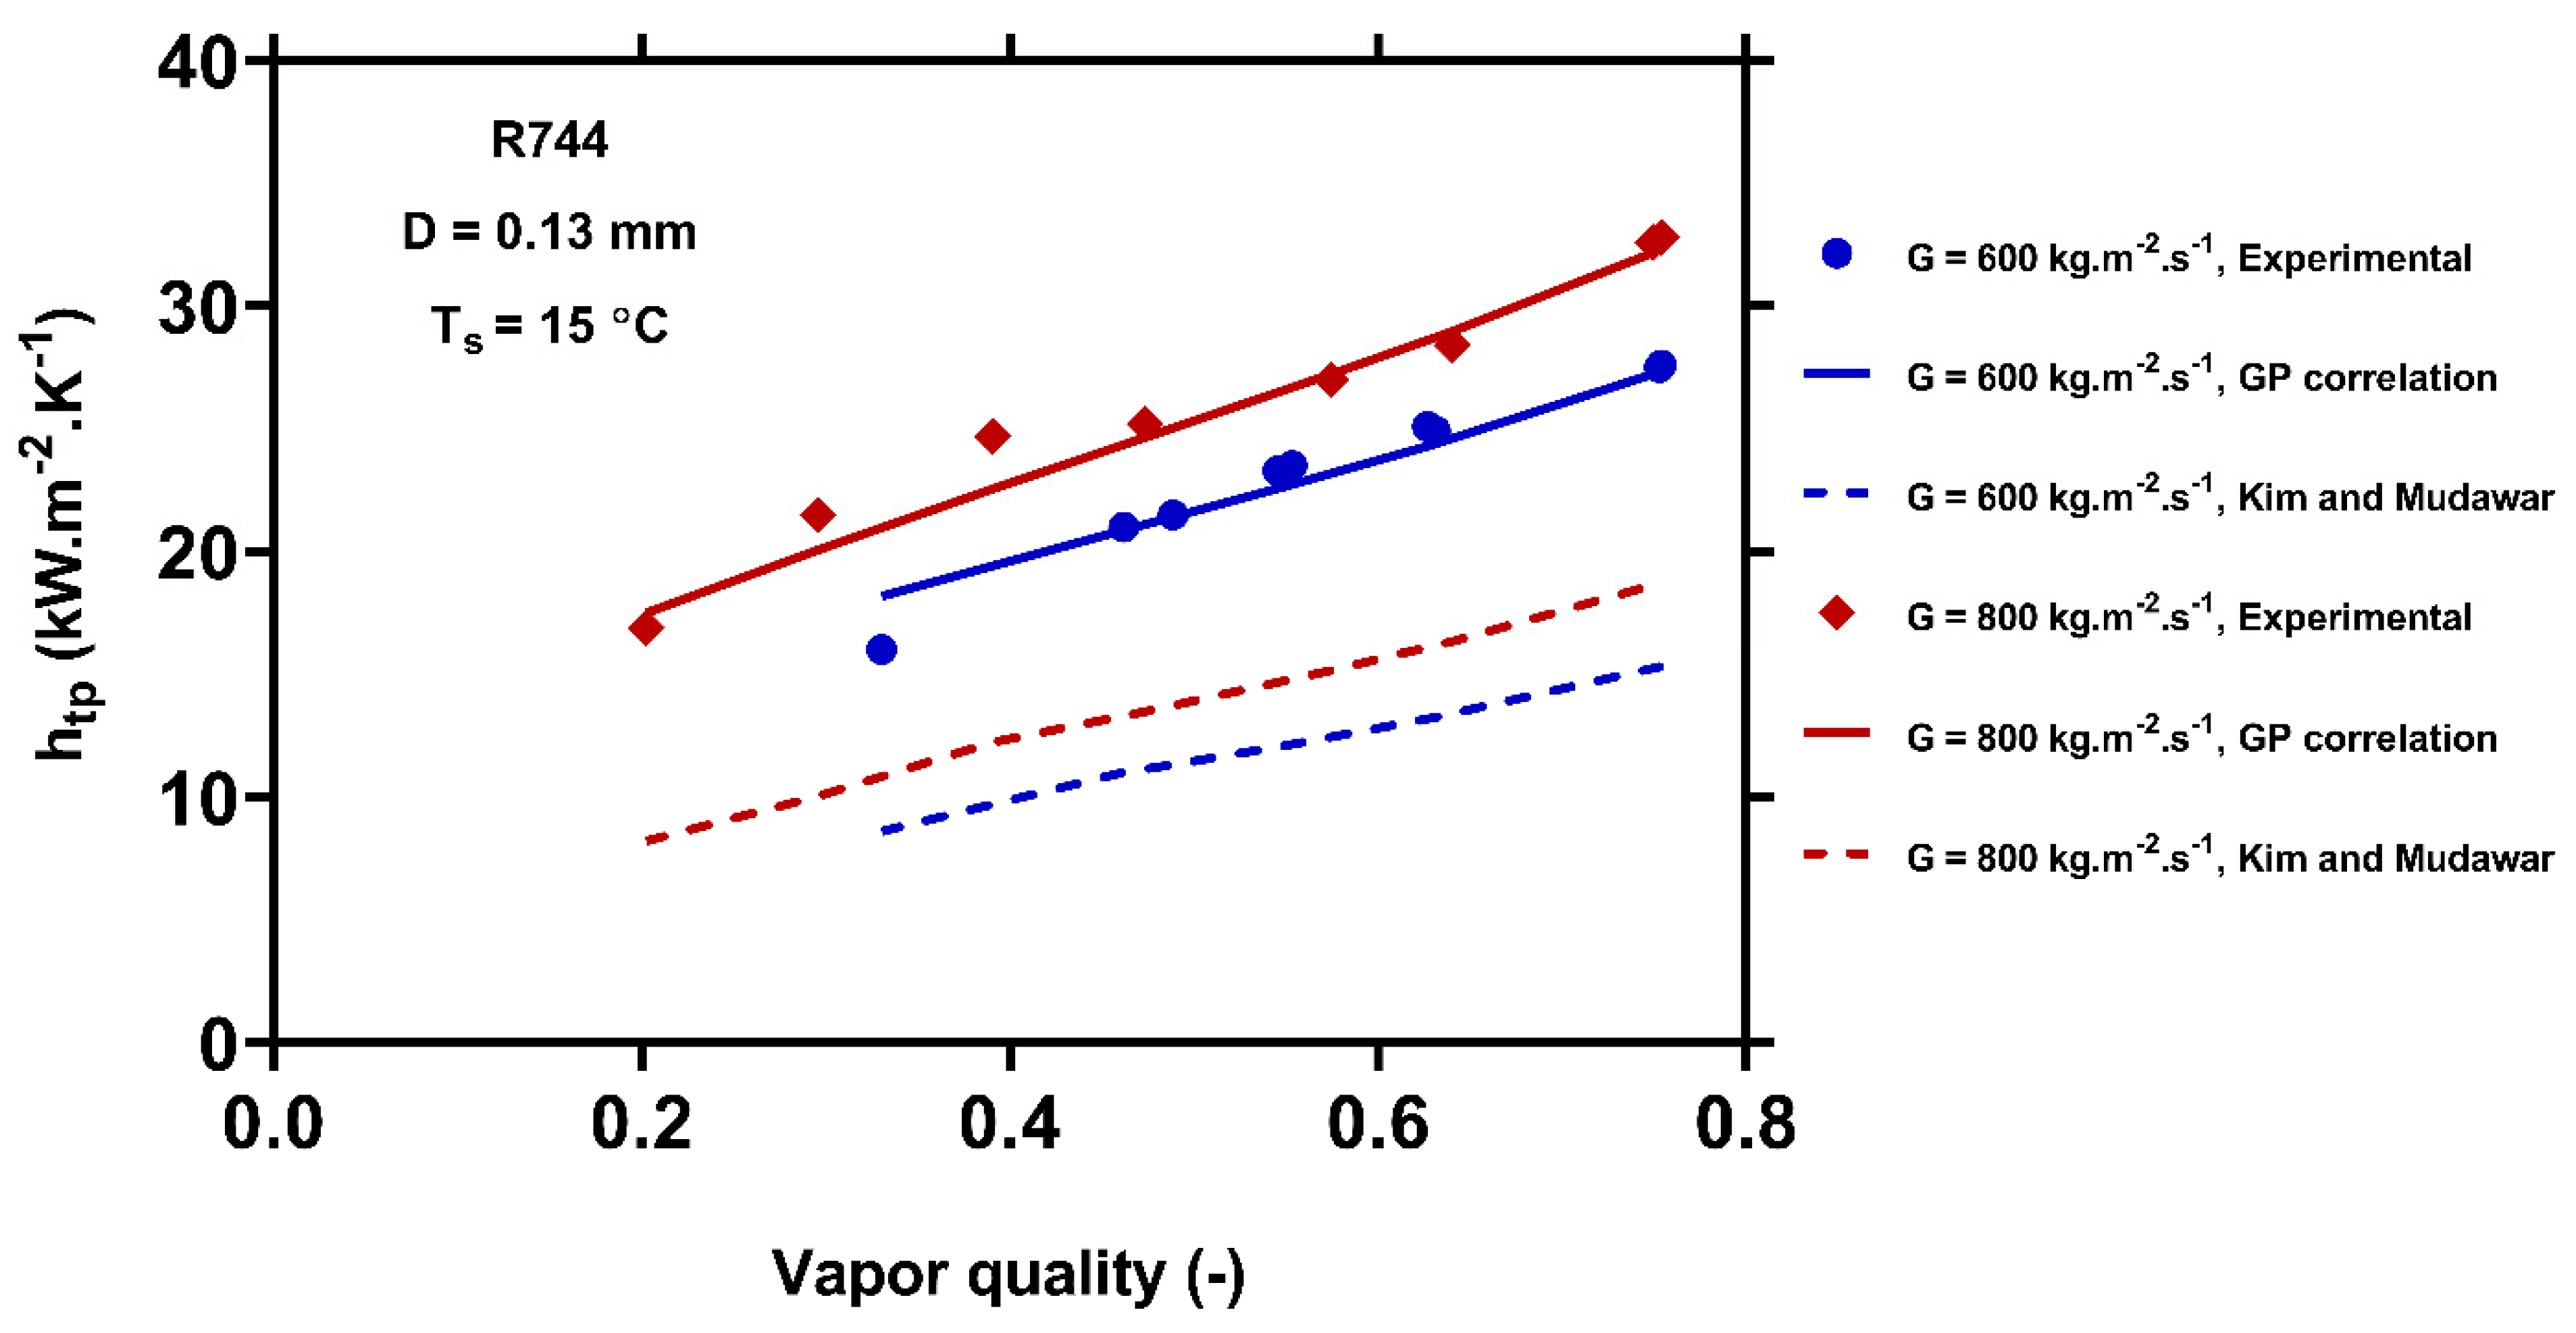
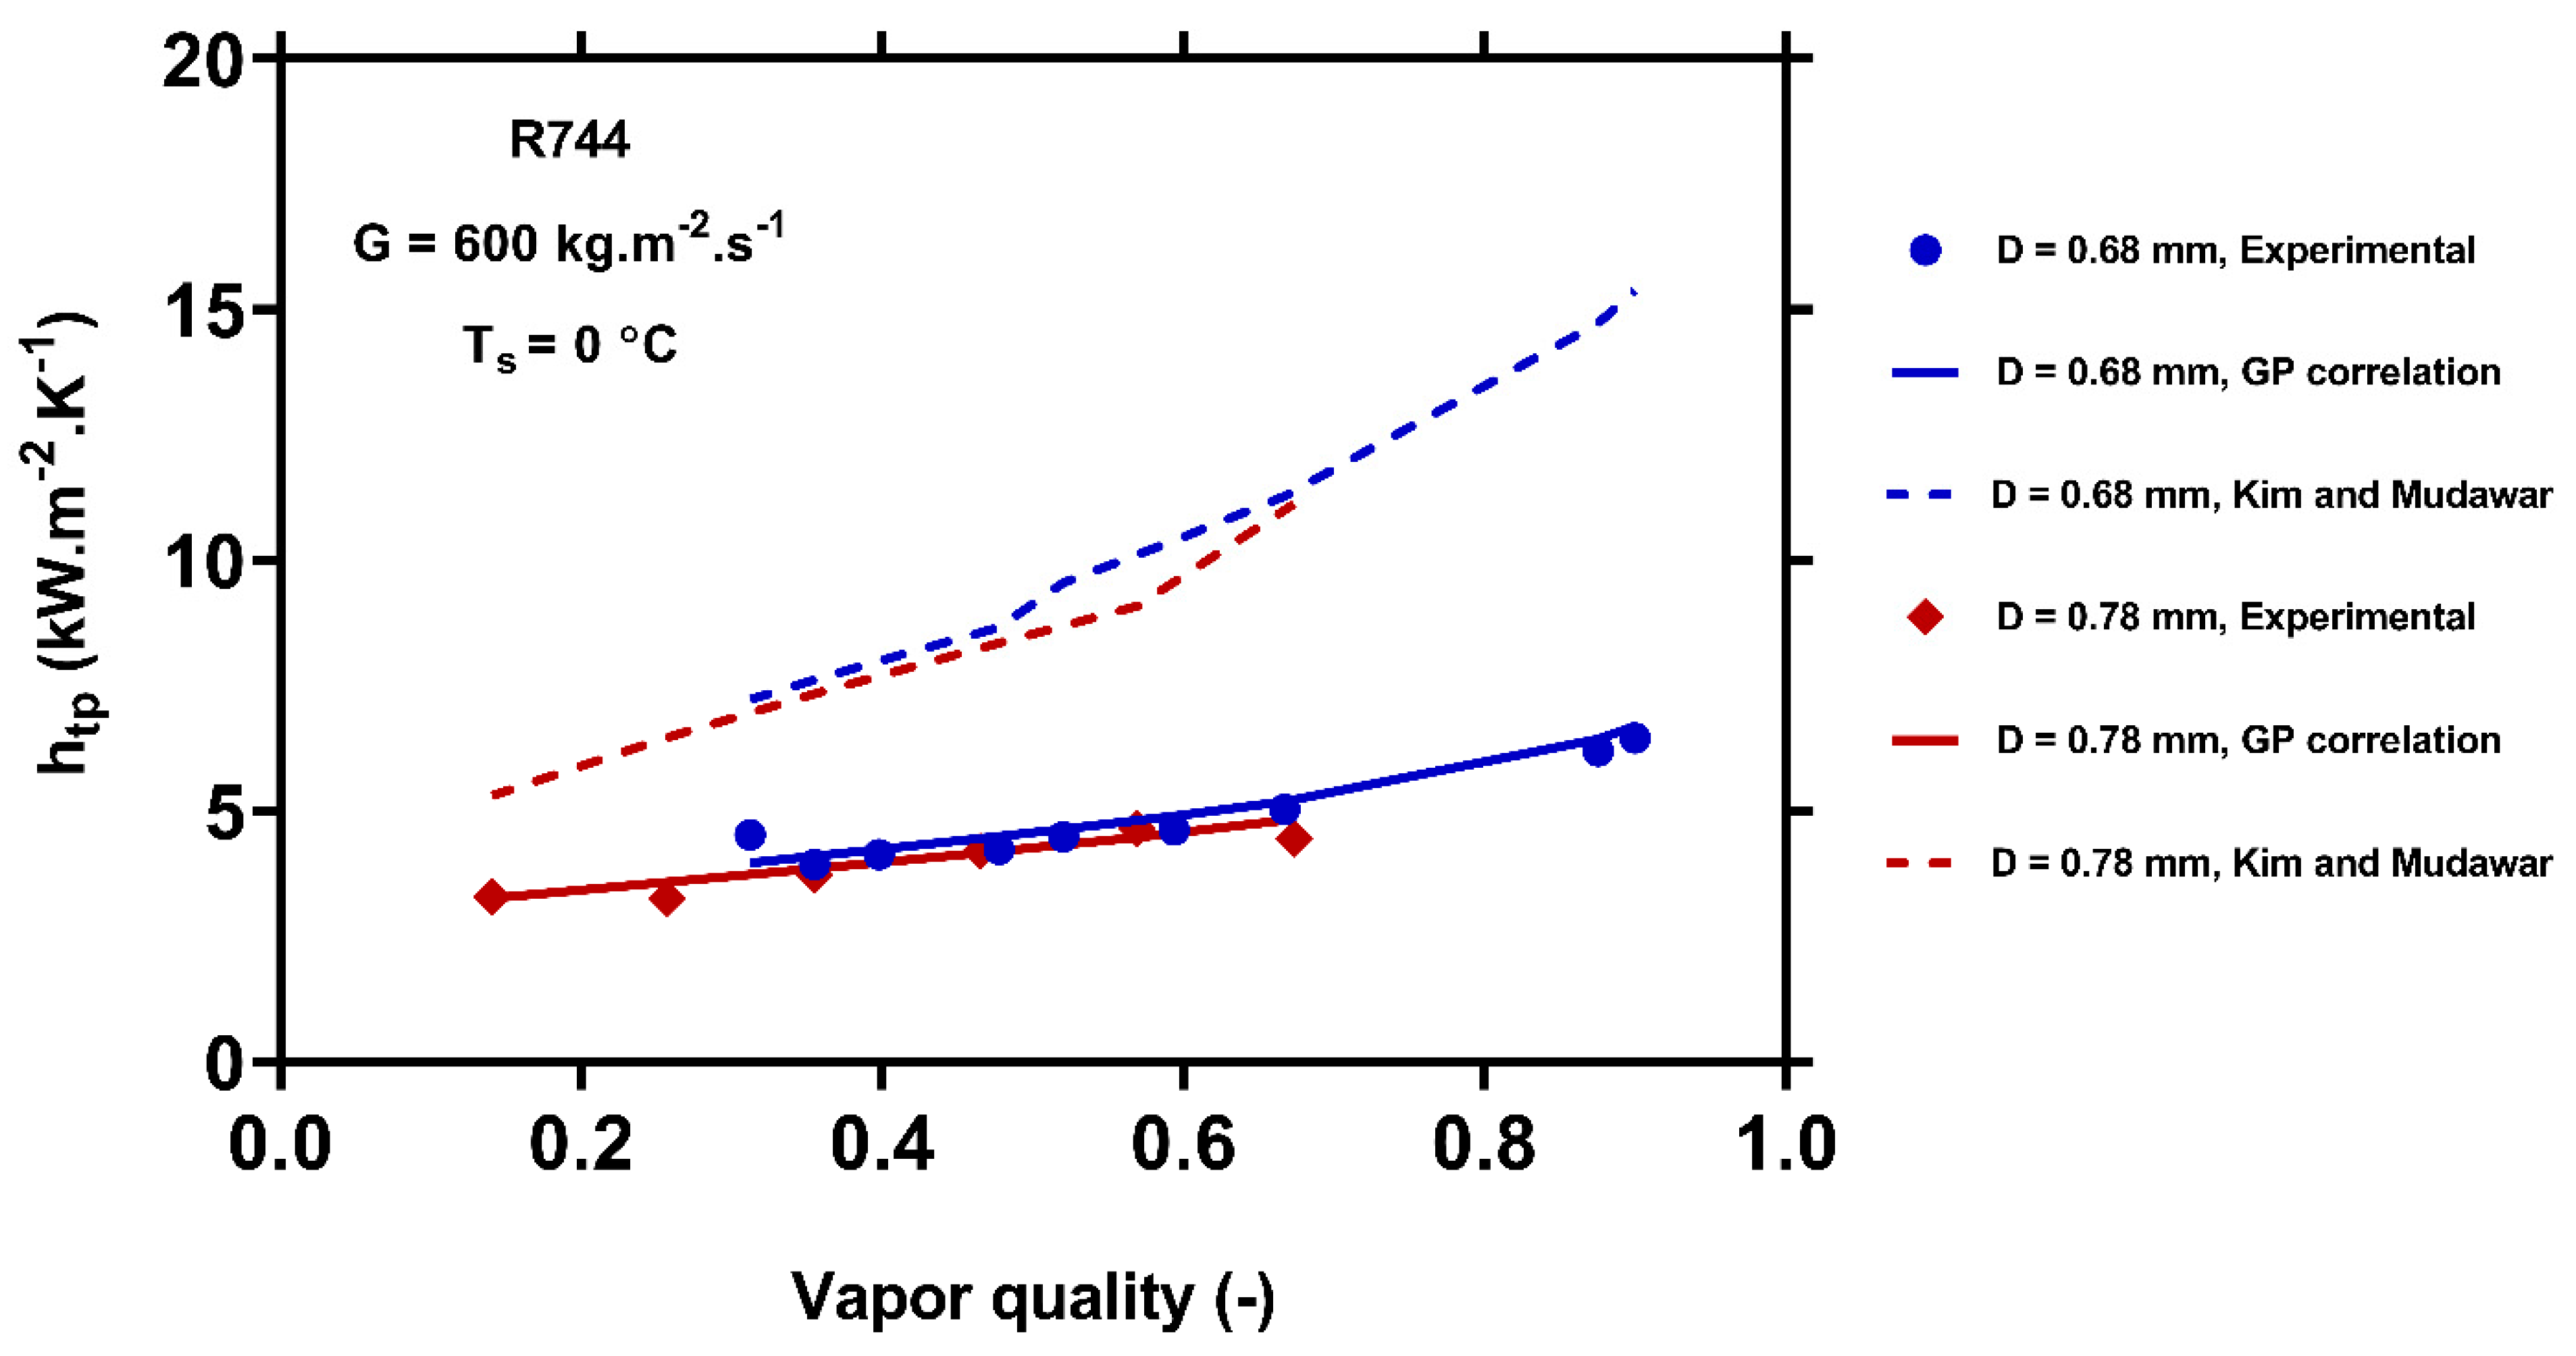
  • The new model and previous correlations were used for estimating the HTC in channels with different sizes. It was shown that the new correlation estimated the data for micro and mini-channels with the AARD of 16.60% and 16.91%, respectively, and was the most accurate for all cases among all correlations. In addition, the new GP correlation estimated more than 80% of all data for both micro and mini-channels with an error of lower than 30%. This is because using the Bond number in the new model explicitly includes the effects of surface tension in different channel sizes. The previous correlations, however, showed relatively large deviations for all cases. Furthermore, their deviations become larger when the channel’s diameter decreases, and all correlations had AARD values of more than 50% for micro-channels.
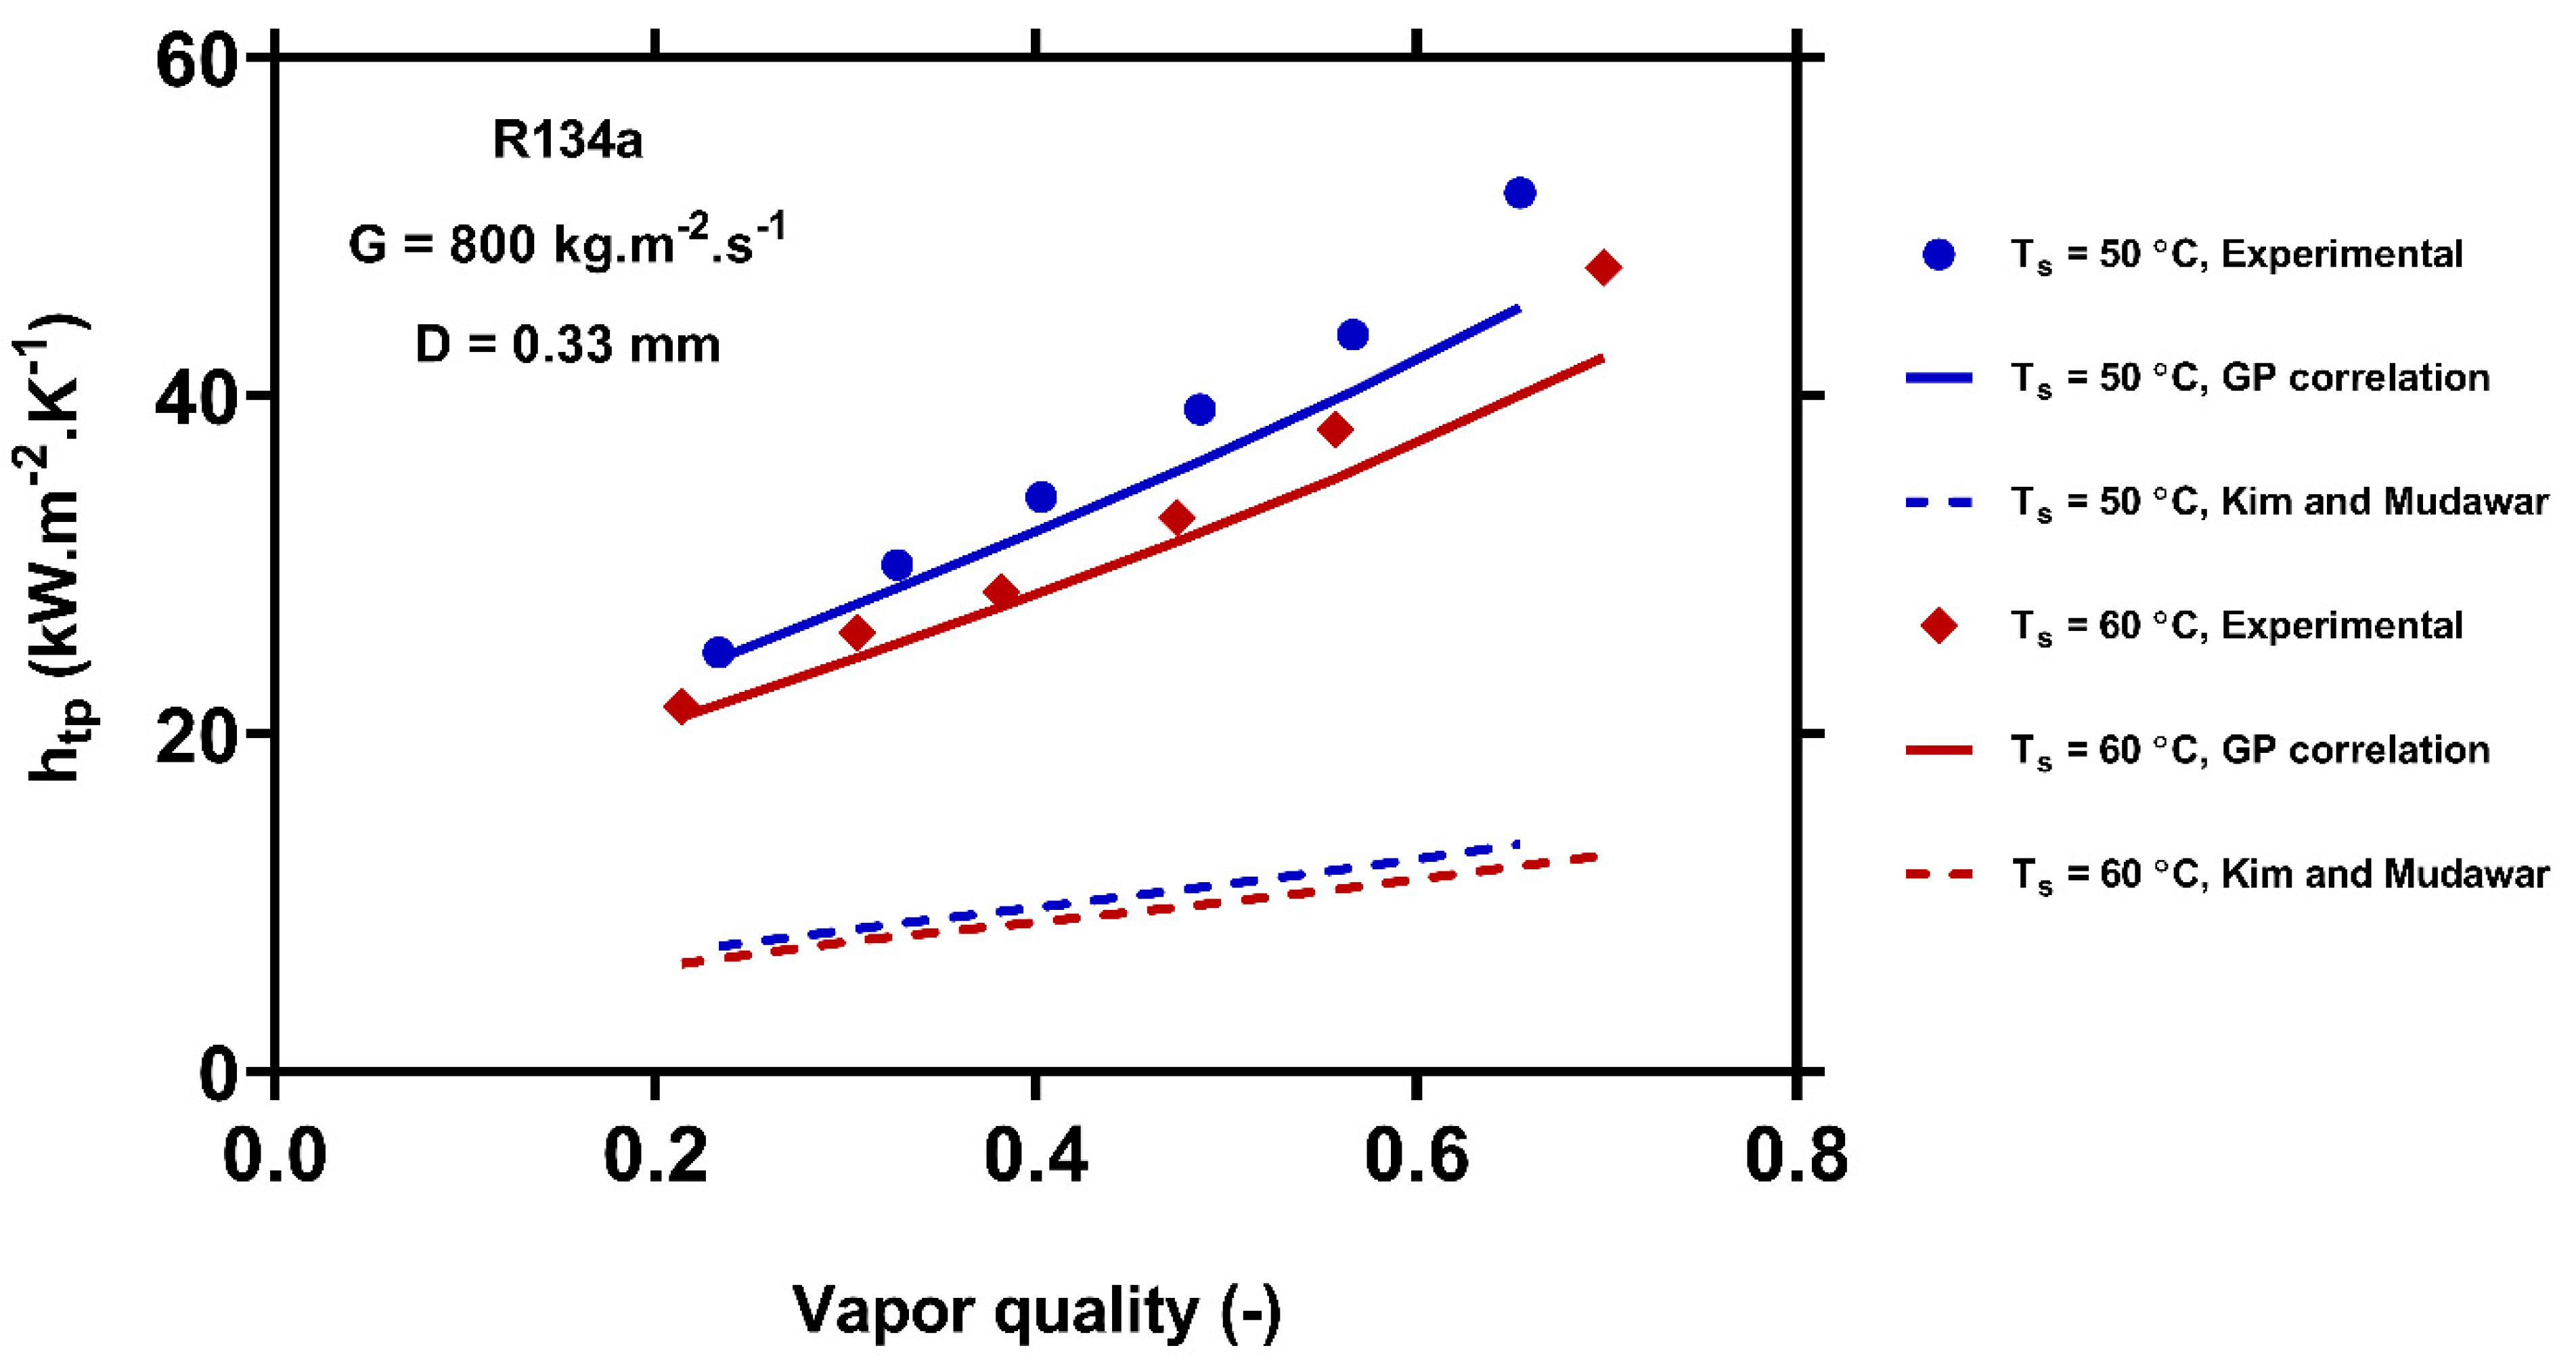
  • The new model developed by GP was shown to be suitable for estimating the condensation HTC in multi-port channels over a broad range of vapor qualities, mass velocities, saturation temperatures, channel diameters, and working fluids.
Knowledge of the parameters of greater effect on the target function is critical for developing further simple and precise correlations. Therefore, performing a Pearson’s correlation coefficient analysis to select the most influential parameters in controlling the condensation of two-phase HTC in multi-port channels and also to determine the weight of each factor in the model is suggested as future work.

Author Contributions

S.H.H., Conceptualization, software, methodology, writing—review and editing; M.A.A., supervision, formal analysis, methodology; A.K., supervision, formal analysis, methodology; M.A.M., writing—original draft preparation, software, validation, data curation; M.J., data curation, investigation; M.P., data curation, investigation; J.T., supervision, methodology, G.A., Conceptualization, writing—review and editing. All authors have read and agreed to the published version of the manuscript.

Funding

This research received no external funding.

Institutional Review Board Statement

Not applicable.

Informed Consent Statement

Not applicable.

Data Availability Statement

The data presented in this study are available on request from the corresponding author.

Conflicts of Interest

The authors declare no conflict of interest.

Nomenclature

hCoefficient of heat transfer, W   m 2   K 1
BoBond Number = g   ( ρ l ρ v )   D 2   σ 1 , (-)
F r l Froude number = G 2   ρ L 2   g 1   D 1 , (-)
GTotal flux, k g     m 2   s 1
J g Dimensionless velocity of vapor
H l v Latent heat, J   Kg 1
P r Prandtl number, (-)
kThermal conductivity, W   m 1   K 1
N u t p Nusselt number = h   D   k l 1 , (-)
P c Critical pressure, Pa
P r e d Reduced pressure = P s   P c 1 , (-)
P s Saturation pressure, Pa
R e v Vapor   Reynolds   number = G   x   D   μ v 1 , (-)
P r t p Prandtl number = P r l ( 1 x ) + x P r v , (-)
R e l Superficial liquid Reynolds number = G   ( 1 x )   D   μ l 1 , (-)
R e l o Liquid Reynolds number = G   D   μ l 1 , (-)
R e t p Flow Reynolds number = R e l + R e v , (-)
S u Suratman Number, (-)
T s Saturation temperature,
W e v o Vapor only Weber number = G 2   D   ρ v 1 σ 1 , (-)
xVapor quality, (-)
X t t Martinelli   parameter = ( μ l / μ v ) 0.1   ( ρ v / ρ l ) 0.5   ( [ 1 x ] / x ) 0.9 , (-)
xVapor quality, (-)

References

  1. Tokgoz, N. Experimental and numerical investigation of flow structure in a cylindrical corrugated channel. Int. J. Mech. Sci. 2019, 157–158, 787–801. [Google Scholar] [CrossRef]
  2. Velasco, F.; Illán-Gómez, F.; García-Cascales, J. Energy efficiency evaluation of the use of R513A as a drop-in replacement for R134a in a water chiller with a minichannel condenser for air-conditioning applications. Appl. Therm. Eng. 2021, 182, 115915. [Google Scholar] [CrossRef]
  3. Sharifi, N. Numerical study of non-equilibrium condensing supersonic steam flow in a jet-pump based on supersaturation theory. Int. J. Mech. Sci. 2020, 165, 105221. [Google Scholar] [CrossRef]
  4. Salilih, E.M.; Birhane, Y.T.; Abu-Hamdeh, N.H. Performance prediction of a solar refrigeration system under various operating pressure of evaporator and condenser. Sol. Energy 2020, 209, 485–492. [Google Scholar] [CrossRef]
  5. Azzouzi, D.; Kelkouli, M.; Amaryoucef, F. Parametric study of the wire-on-tube condenser subcooling effect on the performance of vapor compression refrigeration system. Appl. Therm. Eng. 2017, 122, 528–534. [Google Scholar] [CrossRef]
  6. Petrucci, M.; Faghri, A. Multiple evaporator and condenser loop thermosyphon system for passive cooling of liquid-fuel molten salt nuclear reactors. Nucl. Eng. Des. 2020, 370, 110936. [Google Scholar] [CrossRef]
  7. Gong, M.; Peng, M.; Zhu, H. Research of parameter distributing simulation and modeling for the condenser in nuclear power plant. Ann. Nucl. Energy 2019, 133, 313–326. [Google Scholar] [CrossRef]
  8. Golubev, G.; Eremeev, I.; Makaev, S.; Shalygin, M.; Vasilevsky, V.; He, T.; Drioli, E.; Volkov, A. Thin-film distillation coupled with membrane condenser for brine solutions concentration. Desalination 2021, 503, 114956. [Google Scholar] [CrossRef]
  9. Eiamsa-Ard, S.; Wongcharee, K. Convective heat transfer enhancement using Ag-water nanofluid in a micro-fin tube combined with non-uniform twisted tape. Int. J. Mech. Sci. 2018, 146–147, 337–354. [Google Scholar] [CrossRef]
  10. Knipper, P.; Bertsche, D.; Gneiting, R.; Wetzel, T. Experimental investigation of heat transfer and pressure drop during condensation of R134a in multiport flat tubes. Int. J. Refrig. 2019, 98, 211–221. [Google Scholar] [CrossRef]
  11. Knipper, P.; Arnsberg, J.; Bertsche, D.; Gneiting, R.; Wetzel, T. Modelling of condensation pressure drop for R134a and R134a-lubricant-mixtures in multiport flat tubes. Int. J. Refrig. 2020, 113, 239–248. [Google Scholar] [CrossRef]
  12. Boeng, J.; Rametta, R.S.; Melo, C.; Hermes, C.J. Thermal-hydraulic characterization and system-level optimization of microchannel condensers for household refrigeration applications. Therm. Sci. Eng. Prog. 2020, 20, 100479. [Google Scholar] [CrossRef]
  13. Zhang, P.; Dong, W.; Wang, L.; Sun, W.; Liu, B.; Yang, Z.; Liu, G. Failure analysis of micro-channel condenser of air source heat pump water heater. Eng. Fail. Anal. 2021, 122, 105250. [Google Scholar] [CrossRef]
  14. Tosun, M.; Doğan, B.; Öztürk, M.M.; Erbay, L.B. Integration of a mini-channel condenser into a household refrigerator with regard to accurate capillary tube length and refrigerant amount. Int. J. Refrig. 2019, 98, 428–435. [Google Scholar] [CrossRef]
  15. Wei, L. Study on comprehensive performance evaluation for condensation heat transfer inside the micro-fin tube. Adv. Mech. Eng. 2020, 12. [Google Scholar] [CrossRef]
  16. Nalbandian, H.; Yang, C.-Y.; Chen, K.-T. Effect of channel size and shape on condensation heat transfer of refrigerants HFO-1234yf and HFC-134a in rectangular microchannels. Int. J. Heat Mass Transf. 2020, 161, 120314. [Google Scholar] [CrossRef]
  17. Kruzel, M.; Bohdal, T.; Sikora, M. Heat transfer and pressure drop during refrigerants condensation in compact heat exchangers. Int. J. Heat Mass Transf. 2020, 161, 120283. [Google Scholar] [CrossRef]
  18. Kandlikar, S.G.; Grande, W.J. Evolution of Microchannel Flow Passages—Thermohydraulic Performance and Fabrication Technology Evolution of Microchannel Flow Passages—Thermohydraulic Performance and fabrication technology. Heat Transf. Eng. 2003, 24, 3–17. [Google Scholar] [CrossRef]
  19. Kandlikar, S.G. Fundamental issues related to flow boiling in minichannels and microchannels. Exp. Therm. Fluid Sci. 2002, 26, 389–407. [Google Scholar] [CrossRef]
  20. Kandlikar, S.G. Heat Transfer Mechanisms during Flow Boiling in Microchannels. J. Heat Transf. 2004, 126, 8–16. [Google Scholar] [CrossRef]
  21. Cheng, P.; Wu, H. Mesoscale and Microscale Phase-Change Heat Transfer. Adv. Heat Transf. 2006, 39, 461–563. [Google Scholar] [CrossRef]
  22. Ong, C.L. Macro-to-Microchannel Transition in Two-Phase Flow and Evaporation. Ph.D. Thesis, École Polytechnique Fédérale de Lausanne, Lausanne, Switzerland, 2010. [Google Scholar]
  23. Kew, P.A.; Cornwell, K. Correlations for the prediction of boiling heat transfer in small-diameter channels. Appl. Therm. Eng. 1997, 17, 705–715. [Google Scholar] [CrossRef]
  24. Li, W.; Wu, Z. A general criterion for evaporative heat transfer in micro/mini-channels. Int. J. Heat Mass Transf. 2010, 53, 1967–1976. [Google Scholar] [CrossRef]
  25. Triplett, K.; Ghiaasiaan, S.; Abdel-Khalik, S.; Sadowski, D. Gas–liquid two-phase flow in microchannels Part I: Two-phase flow patterns. Int. J. Multiph. Flow 1999, 25, 377–394. [Google Scholar] [CrossRef]
  26. Mehendale, S.S.; Jacobi, A.; Shah, R.K. Fluid Flow and Heat Transfer at Micro- and Meso-Scales with Application to Heat Exchanger Design. Appl. Mech. Rev. 2000, 53, 175–193. [Google Scholar] [CrossRef]
  27. Brauner, N.; Ullmann, A. The prediction of flow boiling maps in minichannels. In Proceedings of the 4th Japanese–European Two-Phase Flow Group Meeting, Kyoto, Japan, 24–28 September 2006. [Google Scholar] [CrossRef]
  28. Shah, M.M. Applicability of Correlations for Boiling/Condensing in Macrochannels to Minichannels. Heat Mass Transf. Res. J. 2018, 2, 22–32. [Google Scholar]
  29. Liu, N.; Li, J.M.; Sun, J.; Wang, H.S. Heat transfer and pressure drop during condensation of R152a in circular and square microchannels. Exp. Therm. Fluid Sci. 2013, 47, 60–67. [Google Scholar] [CrossRef]
  30. Liu, N.; Xiao, H.; Li, J. Experimental investigation of condensation heat transfer and pressure drop of propane, R1234ze(E) and R22 in minichannels. Appl. Therm. Eng. 2016, 102, 63–72. [Google Scholar] [CrossRef]
  31. Del Col, D.; Bortolato, M.; Bortolin, S. Comprehensive experimental investigation of two-phase heat transfer and pressure drop with propane in a minichannel. Int. J. Refrig. 2014, 47, 66–84. [Google Scholar] [CrossRef]
  32. Del Col, D.; Bisetto, A.; Bortolato, M.; Torresin, D.; Rossetto, L. Experiments and updated model for two phase frictional pressure drop inside minichannels. Int. J. Heat Mass Transf. 2013, 67, 326–337. [Google Scholar] [CrossRef]
  33. Del Col, D.; Bortolato, M.; Azzolin, M.; Bortolin, S. Condensation heat transfer and two-phase frictional pressure drop in a single minichannel with R1234ze(E) and other refrigerants. Int. J. Refrig. 2015, 50, 87–103. [Google Scholar] [CrossRef]
  34. Cavallini, A.; Censi, G.; Del Col, D.; Doretti, L.; Longo, G.A.; Rossetto, L. Experimental investigation on condensation heat transfer and pressure drop of new HFC refrigerants in a horizontal smooth tube  rimentale sur le transfert de chaleur lors de la Etude expe condensation et sur la chute de pression des nouveaux frigorige da. Int. J. Refrig. 2001, 24, 73–87. [Google Scholar] [CrossRef]
  35. Del Col, D.; Bortolin, S.; Censi, G.; Da Riva, E. Impact of two-phase distribution systems on the performance of a microchannel evaporator. Sci. Technol. Built Environ. 2015, 21, 1047–1058. [Google Scholar] [CrossRef]
  36. Garimella, S.; Agarwal, A.; Fronk, B.M. Condensation heat transfer in rectangular microscale geometries. Int. J. Heat Mass Transf. 2016, 100, 98–110. [Google Scholar] [CrossRef]
  37. Fronk, B.M.; Garimella, S. Condensation of carbon dioxide in microchannels. Int. J. Heat Mass Transf. 2016, 100, 150–164. [Google Scholar] [CrossRef] [Green Version]
  38. Jige, D.; Inoue, N.; Koyama, S. Condensation of refrigerants in a multiport tube with rectangular minichannels. Int. J. Refrig. 2016, 67, 202–213. [Google Scholar] [CrossRef]
  39. Cavallini, A.; Zecchin, R. A Dimensionless Correlation for Heat Transfer in Forced Convection Condensation. In International Heat Transfer Conference Digital Library; Begell House: Danbury, CT, USA, 1974. [Google Scholar] [CrossRef]
  40. Haraguchi, H.; Koyama, S.; Fujii, T. Condensation of Refrigerants HCFC 22, HFC 134a and HCFC 123 in a Horizontal Smooth Tube. 2nd Report, Proposals of Empirical Expressions for Local Heat Transfer Coefficient. Trans. Jpn. Soc. Mech. Eng. Ser. B 1994, 60, 2117–2124. [Google Scholar] [CrossRef] [Green Version]
  41. Dobson, M.K.; Chato, J.C. Condensation in Smooth Horizontal Tubes. J. Heat Transf. 1998, 120, 193–213. [Google Scholar] [CrossRef]
  42. Wang, H.S.; Rose, J.W. Theory of heat transfer during condensation in microchannels. Int. J. Heat Mass Transf. 2011, 54, 2525–2534. [Google Scholar] [CrossRef]
  43. Koyama, S.; Kuwahara, K.; Nakashita, K. Condensation of Refrigerant in a Multi-Port Channel. In Proceedings of the 1st International Conference on Microchannels and Minichannels, Rochester, NY, USA, 24–25 April 2003; pp. 193–205. [Google Scholar]
  44. Dittus, F.W.; Boelter, L.M.K. Heat transfer in automobile radiators of the tubular type. Int. Commun. Heat Mass Transf. 1985, 12, 3–22. [Google Scholar] [CrossRef]
  45. Shah, M. A general correlation for heat transfer during film condensation inside pipes. Int. J. Heat Mass Transf. 1979, 22, 547–556. [Google Scholar] [CrossRef]
  46. Cavallini, A.; Del Col, D.; Doretti, L.; Matkovic, M.; Rossetto, L.; Zilio, C.; Censi, G. Condensation in Horizontal Smooth Tubes: A New Heat Transfer Model for Heat Exchanger Design. Heat Transf. Eng. 2006, 27, 31–38. [Google Scholar] [CrossRef]
  47. Shah, M.M. An Improved and Extended General Correlation for Heat Transfer During Condensation in Plain Tubes. HVAC&R Res. 2009, 15, 889–913. [Google Scholar] [CrossRef]
  48. Shah, M.M. General correlation for heat transfer during condensation in plain tubes: Further development and verification. ASHRAE Trans. 2013, 119, 3–11. [Google Scholar]
  49. Dorao, C.A.; Fernandino, M. Simple and general correlation for heat transfer during flow condensation inside plain pipes. Int. J. Heat Mass Transf. 2018, 122, 290–305. [Google Scholar] [CrossRef]
  50. Moser, K.W.; Webb, R.L.; Na, B. A New Equivalent Reynolds Number Model for Condensation in Smooth Tubes. J. Heat Transf. 1998, 120, 410–417. [Google Scholar] [CrossRef]
  51. Dorao, C.A.; Fernandino, M. Dominant dimensionless groups controlling heat transfer coefficient during flow condensation inside pipes. Int. J. Heat Mass Transf. 2017, 112, 465–479. [Google Scholar] [CrossRef]
  52. Kim, S.-M.; Mudawar, I. Universal approach to predicting heat transfer coefficient for condensing mini/micro-channel flow. Int. J. Heat Mass Transf. 2013, 56, 238–250. [Google Scholar] [CrossRef]
  53. Soliman, H. The mist-annular transition during condensation and its influence on the heat transfer mechanism. Int. J. Multiph. Flow 1986, 12, 277–288. [Google Scholar] [CrossRef]
  54. Derby, M.; Lee, H.J.; Peles, Y.; Jensen, M.K. Condensation heat transfer in square, triangular, and semi-circular mini-channels. Int. J. Heat Mass Transf. 2012, 55, 187–197. [Google Scholar] [CrossRef]
  55. Wang, W.-W.W.; Radcliff, T.D.; Christensen, R.N. A condensation heat transfer correlation for millimeter-scale tubing with flow regime transition. Exp. Therm. Fluid Sci. 2002, 26, 473–485. [Google Scholar] [CrossRef]
  56. Hosseini, S.; Moradkhani, M.; Valizadeh, M.; Zendehboudi, A.; Olazar, M. A general heat transfer correlation for flow condensation in single port mini and macro channels using genetic programming. Int. J. Refrig. 2020, 119, 376–389. [Google Scholar] [CrossRef]
  57. Shah, M.M. Improved correlation for heat transfer during condensation in conventional and mini/micro channels. Int. J. Refrig. 2019, 98, 222–237. [Google Scholar] [CrossRef]
  58. Qiblawey, Y.; Tahir, A.; Chowdhury, M.; Khandakar, A.; Kiranyaz, S.; Rahman, T.; Ibtehaz, N.; Mahmud, S.; Maadeed, S.; Musharavati, F.; et al. Detection and Severity Classification of COVID-19 in CT Images Using Deep Learning. Diagnostics 2021, 11, 893. [Google Scholar] [CrossRef]
  59. Rahman, T.; Al-Ishaq, F.A.; Al-Mohannadi, F.S.; Mubarak, R.S.; Al-Hitmi, M.H.; Islam, K.R.; Khandakar, A.; Hssain, A.A.; Al-Madeed, S.; Zughaier, S.M.; et al. Mortality Prediction Utilizing Blood Biomarkers to Predict the Severity of COVID-19 Using Machine Learning Technique. Diagnostics 2021, 11, 1582. [Google Scholar] [CrossRef]
  60. Rahman, T.; Khandakar, A.; Hoque, E.; Ibtehaz, N.; Kashem, S.B.; Masud, R.; Shampa, L.; Hasan, M.M.; Islam, M.T.; Al-Maadeed, S.; et al. Development and Validation of an Early Scoring System for Prediction of Disease Severity in COVID-19 Using Complete Blood Count Parameters. IEEE Access 2021, 9, 120422–120441. [Google Scholar] [CrossRef]
  61. Cao, Y.; Kamrani, E.; Mirzaei, S.; Khandakar, A.; Vaferi, B. Electrical efficiency of the photovoltaic/thermal collectors cooled by nanofluids: Machine learning simulation and optimization by evolutionary algorithm. Energy Rep. 2021, 8, 24–36. [Google Scholar] [CrossRef]
  62. Chowdhury, M.; Rahman, T.; Khandakar, A.; Ayari, M.; Khan, A.; Khan, M.; Al-Emadi, N.; Reaz, M.; Islam, M.; Ali, S. Automatic and Reliable Leaf Disease Detection Using Deep Learning Techniques. AgriEngineering 2021, 3, 294–312. [Google Scholar] [CrossRef]
  63. Zhou, L.; Garg, D.; Qiu, Y.; Kim, S.-M.; Mudawar, I.; Kharangate, C.R. Machine learning algorithms to predict flow condensation heat transfer coefficient in mini/micro-channel utilizing universal data. Int. J. Heat Mass Transf. 2020, 162, 120351. [Google Scholar] [CrossRef]
  64. Zhang, X.; Yu, T.; Zhao, J. An analytical approach on stochastic model for cutting force prediction in milling ceramic matrix composites. Int. J. Mech. Sci. 2020, 168, 105314. [Google Scholar] [CrossRef]
  65. Hosseini, S.; Rezaei, M.J.; Bag-Mohammadi, M.; Karami, M.; Moradkhani, M.A.; Panahi, M.; Olazar, M. Estimation of the minimum spouting velocity in shallow spouted beds by intelligent approaches: Study of fine and coarse particles. Powder Technol. 2019, 354, 456–465. [Google Scholar] [CrossRef]
  66. Qiu, Y.; Garg, D.; Zhou, L.; Kharangate, C.R.; Kim, S.-M.; Mudawar, I. An artificial neural network model to predict mini/micro-channels saturated flow boiling heat transfer coefficient based on universal consolidated data. Int. J. Heat Mass Transf. 2020, 149, 119211. [Google Scholar] [CrossRef]
  67. Kunwar, A.; Hektor, J.; Nomoto, S.; Coutinho, Y.A.; Moelans, N. Combining multi-phase field simulation with neural network analysis to unravel thermomigration accelerated growth behavior of Cu6Sn5 IMC at cold side Cu–Sn interface. Int. J. Mech. Sci. 2020, 184, 105843. [Google Scholar] [CrossRef]
  68. Moradkhani, M.; Hosseini, S.; Valizadeh, M.; Zendehboudi, A.; Ahmadi, G. A general correlation for the frictional pressure drop during condensation in mini/micro and macro channels. Int. J. Heat Mass Transf. 2020, 163, 120475. [Google Scholar] [CrossRef]
  69. Hosseini, S.; Moradkhani, M.; Shah, M.M.; Edalati, M. General equation for flow condensation heat transfer coefficient in different orientations of helical coils of smooth tubes using genetic programming. Int. Commun. Heat Mass Transf. 2020, 119, 104916. [Google Scholar] [CrossRef]
  70. Hosseini, S.; Moradkhani, M.; Valizadeh, M.; Ahmadi, G. Applying genetic programming in estimation of frost layer thickness on horizontal and vertical plates at ultra-low temperature. Int. J. Refrig. 2021, 125, 113–121. [Google Scholar] [CrossRef]
  71. Lemmon, E.W.; Huber, M.L.; McLinden, M.O. Reference fluid thermodynamic and transport properties—REFPROP. NIST Stand. Ref. Database 2002, 23, v7. [Google Scholar]
  72. Fronk, B.M.; Garimella, S. Heat Transfer and Pressure Drop during Condensation of Ammonia in Microchannels. In Proceedings of the ASME 3rd Micro/Nanoscale Heat and Mass Transfer International Conference, Atlanta, GA, USA, 3–6 March 2012. [Google Scholar]
  73. López-Belchí, A.; Illán, F.; García-Cascales, J.R.; Vera-García, F. Condensing two-phase pressure drop and heat transfer coefficient of propane in a horizontal multiport mini-channel tube: Experimental measurements. Int. J. Refrig. 2016, 68, 59–75. [Google Scholar] [CrossRef]
  74. Lopez-Belchi, A.; Illán-Gómez, F. Evaluation of a condenser based on mini-channels technology working with R410A and R32. Experimental data and performance estimate. Appl. Energy 2017, 202, 112–124. [Google Scholar] [CrossRef]
  75. Agarwal, A.; Bandhauer, T.M.; Garimella, S. Measurement and modeling of condensation heat transfer in non-circular microchannels. Int. J. Refrig. 2010, 33, 1169–1179. [Google Scholar] [CrossRef]
  76. López-Belchí, A.; Illán, F.; García-Cascales, J.R.; Vera-García, F. R32 and R410A condensation heat transfer coefficient and pressure drop within minichannel multiport tube. Experimental technique and measurements. Appl. Therm. Eng. 2016, 105, 118–131. [Google Scholar] [CrossRef]
  77. Bandhauer, T.M.; Agarwal, A.; Garimella, S. Measurement and Modeling of Condensation Heat Transfer Coefficients in Circular Microchannels. J. Heat Transf. 2006, 128, 1050–1059. [Google Scholar] [CrossRef]
  78. Cavallini, A.; Del Col, D.; Doretti, L.; Matkovic, M.; Rossetto, L.; Zilio, C. Condensation Heat Transfer and Pressure Gradient Inside Multiport Minichannels. Heat Transf. Eng. 2005, 26, 45–55. [Google Scholar] [CrossRef]
  79. López-Belchí, A. Assessment of a mini-channel condenser at high ambient temperatures based on experimental measurements working with R134a, R513A and R1234yf. Appl. Therm. Eng. 2019, 155, 341–353. [Google Scholar] [CrossRef]
  80. Belchí, A.L.; Gómez, F.I.; Cascales, J.R.G.; García, F.V. Heat transfer coefficient during condensation inside a minichannel multiport tube with R32 and R410A as working fluids. Sci. Technol. Built Environ. 2015, 21, 535–544. [Google Scholar] [CrossRef]
  81. Andresen, U. Supercritical Gas Cooling and Near-Critical-Pressure Condensation of Refrigerant Blends in Microchannels. Ph.D. Thesis, Georgia Institute of Technology, Atlanta, GA, USA, May 2007. [Google Scholar]
  82. Heo, J.; Park, H.; Yun, R. Comparison of condensation heat transfer and pressure drop of CO2 in rectangular microchannels. Int. J. Heat Mass Transf. 2013, 65, 719–726. [Google Scholar] [CrossRef]
  83. Illán-Gómez, F.; López-Belchí, A.; García-Cascales, J.R.; Vera-García, F. Experimental two-phase heat transfer coefficient and frictional pressure drop inside mini-channels during condensation with R1234yf and R134a. Int. J. Refrig. 2015, 51, 12–23. [Google Scholar] [CrossRef]
  84. Park, J.; Vakili-Farahani, F.; Consolini, L.; Thome, J. Experimental study on condensation heat transfer in vertical minichannels for new refrigerant R1234ze(E) versus R134a and R236fa. Exp. Therm. Fluid Sci. 2010, 35, 442–454. [Google Scholar] [CrossRef]
  85. Pham, Q.V.; Choi, K.-I.; Oh, J.-T. Condensation heat transfer characteristics and pressure drops of R410A, R22, R32, and R290 in a multiport rectangular channel. Sci. Technol. Built Environ. 2019, 25, 1325–1336. [Google Scholar] [CrossRef]
  86. Park, C.Y.; Hrnjak, P. CO2 flow condensation heat transfer and pressure drop in multi-port microchannels at low temperatures. Int. J. Refrig. 2009, 32, 1129–1139. [Google Scholar] [CrossRef]
  87. Li, M.; Guo, Q.; Lv, J.; Li, D. Research on condensation heat transfer characteristics of R447A, R1234ze, R134a and R32 in multi-port micro-channel tubes. Int. J. Heat Mass Transf. 2018, 118, 637–650. [Google Scholar] [CrossRef]
  88. Rahman, M.M.; Kariya, K.; Miyara, A. An experimental study and development of new correlation for condensation heat transfer coefficient of refrigerant inside a multiport minichannel with and without fins. Int. J. Heat Mass Transf. 2018, 116, 50–60. [Google Scholar] [CrossRef]
  89. Kim, S.-M.; Mudawar, I. Universal approach to predicting two-phase frictional pressure drop for adiabatic and condensing mini/micro-channel flows. Int. J. Heat Mass Transf. 2012, 55, 3246–3261. [Google Scholar] [CrossRef]
  90. Shah, M.M. A correlation for heat transfer during condensation in horizontal mini/micro channels. Int. J. Refrig. 2016, 64, 187–202. [Google Scholar] [CrossRef]
  91. Akers, W.W.; Deans, H.; Crosser, O. Condensing heat transfer within horizontal tubes. Chem. Eng. Prog. Symp. 1955, 54, 89–90. [Google Scholar]
  92. Crosser, O. Condensing Heat Transfer within Horizontal Tubes. Ph.D. Thesis, Rice University, Houston, TX, USA, 1955. [Google Scholar]
  93. Bohdal, T.; Charun, H.; Sikora, M. Comparative investigations of the condensation of R134a and R404A refrigerants in pipe minichannels. Int. J. Heat Mass Transf. 2011, 54, 1963–1974. [Google Scholar] [CrossRef]
  94. Moradkhani, M.; Hosseini, S.; Song, M. Robust and general predictive models for condensation heat transfer inside conventional and mini/micro channel heat exchangers. Appl. Therm. Eng. 2021, 201, 117737. [Google Scholar] [CrossRef]
  95. Sikora, M.; Bohdal, T.; Formela, K. Experimental Study of HFE 7000 Refrigerant Condensation in Horizontal Pipe Minichannels. Materials 2021, 14, 6886. [Google Scholar] [CrossRef]
  96. Coleman, J.W.; Garimella, S. Two-phase flow regimes in round, square and rectangular tubes during condensation of refrigerant R134a. Int. J. Refrig. 2003, 26, 117–128. [Google Scholar] [CrossRef]
Figure 1. The present genetic programming flowchart.
Processes 10 00243 g001
Figure 2. Comparison between the Nusselt number estimated by Equation (13) and the measured data. The solid points represent the outcomes of Equation (13). The solid line represents the best fitting between experimental and estimated data, and the dash lines represent the ± 30 % error bounds.
Processes 10 00243 g002
Figure 3. Comparison of predictions of the previous condensation HTC models with all 3503 experimental data points: (a) Kim and Mudawar [52], (b) Dorao and Fernandino [49], (c) Shah (2016) [90], (d) Shah (2019) [57], (e) Crosser [92] and (f) Hosseini et al. [56]. The solid points represent the outcomes of different models. The solid line represents the best fitting between experimental and estimated data, and the dash lines represent the ± 30 % error bounds.
Processes 10 00243 g003aProcesses 10 00243 g003bProcesses 10 00243 g003cProcesses 10 00243 g003dProcesses 10 00243 g003eProcesses 10 00243 g003f
Figure 4. Comparison of the predictions of the GP correlation (Equation (13)) and the model of Kim and Mudawar [52] with the experimental data [37] for R744 condensing at the saturation temperature of 15 inside a 0.13 mm channel under different vapor qualities and mass fluxes. Blue and red points represent the G = 600 kg . m 2 · s 1 and G = 800 kg · m 2 . s 1 , respectively. The solid points, solid lines, and dash lines represent the experimental values, GP outcomes, and Kim and Mudawar [52] outcomes.
Processes 10 00243 g004
Figure 5. Comparison of the predictions of the GP correlation (Equation (13)) and the model of Kim and Mudawar [52] with the experimental data [72] for R134a condensing at the mass flux of 800   kg . m 2 . s 1 inside a 0.33 mm channel under different saturation temperatures. Blue and red points represent the T s = 50   ° C and T s = 60   ° C , respectively. The solid points, solid lines, and dash lines represent the experimental values, GP outcomes and Kim and Mudawar [52] outcomes.
Processes 10 00243 g005
Figure 6. Comparisons of the predictions of the GP correlation (Equation (13)) and the model of Kim and Mudawar [52] with the experimental data [82] for R744 condensing at the mass flux of 800   kg · m 2 · s 1 and saturation temperature of 0 °C inside different channel diameters. Blue and red points represent the D = 68 mm and D = 78 mm, respectively. The solid points, solid lines, and dash lines represent the experimental values, GP outcomes and Kim and Mudawar [52] outcomes.
Processes 10 00243 g006
Figure 7. Comparison of the predictions of the GP correlation (Equation (13)) and the model of Kim and Mudawar [52] with the experimental data [73,76] for R290 and R32 condensing at the mass flux of 350   kg · m 2 · s 1 and saturation temperature of 40 inside a 1.16 mm channel. Blue and red points represent the R290 and R32, respectively. The solid points, solid lines, and dash lines represent the experimental values, GP outcomes, and Kim and Mudawar [52] outcomes, respectively.
Processes 10 00243 g007
Table 1. The database sources for the HTC in multi-port mini/micro-channels.
ReferencesFluidChannel GeometryHydraulic Diameter
(mm)
Mass Flux
( k g   m 2 s 1 )
Reduced Pressure
(-)
Number of Points
Agarwal [72]R134aRectangular, Square0.1 to 0.16300 to 8000.19 to 0.42291
Belchi et al. [73]R290Square1.16175 to 3500.25 to 0.40100
Belchi et al. [74]R32, R410ASquare1.16470 to 7100.33 to 0.63163
Agarwal et al. [75]R134aBarrel, N-shape, Rectangular, Square, Triangular0.424 to 0.839150 to 7500.37152
Belchi et al. [76]R32, R410ASquare1.16350 to 8000.33 to 0.63515
Fronk and Garimella [37]R744Rectangular0.1 to 0.16400 to 8000.69 to 0.87189
Bandhauer et al. [77]R134aCircular0.506 to 1.524150 to 7500.41128
Cavallini et al. [78]R134a, R410ACircular 1.4200 to 14000.25 to 0.561
Belchi [79]R1234yf, R134aSquare1.16470 to 7100.25 to 0.4981
Belchi et al. [80]R32, R410ASquare 1.164750.38 to 0.4988
Derby et al. [54]R134aSquare175 to 4500.2280
Andresen [81]R410ACircular 0.76 to 1.52200 to 8000.80 to 0.90198
Heo and Yun [82]R744Rectangular0.68 to 1.5400 to 8000.41 to 0.54203
Gomez et al. [83]R1234yfSquare1.16350 to 9450.23 to 0.43162
Jige et al. [38]R1234ze(E), R134a, R32Rectangular0.76 to 1.06100 to 4000.21 to 0.43323
Park et al. [84]R1234ze(E), R134a, R236faRectangular1.45100 to 2600.13 to 0.4497
Pham et al. [85]R22, R290, R32, R410ARectangular0.8350 to 5000.37 to 0.6079
Park and Hrnjak [86]R744Rectangular0.89200 to 8000.23 to 0.40112
Li et al. [87]R1234ze(E), R134a, R32, R32/R134a (24.5/75/5%), R32/R134a (51/49%)Circular0.86100 to 3000.18 to 0.42151
Wang et al. [55]R134aCircular1.46150 to 7500.45279
Rahman et al. [88]R134aRectangular0.8150 to 2000.19 to 0.2251
Total 3503
Table 2. Operating conditions, geometric dimensions, and the range of dimensionless factors used in the present study.
ParameterType of Refrigerant/Operating Conditions/Channel Geometry/Dimensionless Factors
FluidsR744, R1234yf, R1234ze(E), R134a, R22, R236fa, R290, R32, R32/R134a (24.5/75.5%), R32/R134a (51/49%) and R410A
G ,   ( k g   m 2 s 1 )50–1400
D ,   ( m m ) 0.1–1.524
Channel geometryRectangular, circular, square, barrel, N-shaped and Triangular mini/micro channels
Reduced pressure, (-)0.13–0.90
Vapor quality, x, (-)0.002–0.978
R e l , (-)11–16886
P r l , (-)1.75–4.69
X t t , (-)0.0088–105.26
B o , (-)0.015–31.36
Table 3. Correlations for predicting the HTC during condensation.
Reference(s)CorrelationRemarks
Kim and Mudawar [52]   f o r   a n n u l a r   f l o w   ( W e * < 7 X t t ) :
N u t p = 0.048 ( R e l ) 0.69 ( P r l ) 0.34 ϕ v X t t
f o r   s l u g   a n d   b u b b l y   f l o w     ( W e * > 7 X t t ) :
N u t p = [ ( 0.048 ( R e l ) 0.69 ( P r l ) 0.34 ϕ v X t t ) 2 + ( 3.2 × 10 7 ( R e l ) 0.38 ( S u v o ) 1.39 ) 2 ] 0.5
W e * = 2.45 R e v 0.64 S u v o 0.3 ( 1 + 1.09 X t t 0.039 ) 0.4         f o r   R e l 1250
W e * = 0.85 R e v 0.79 X t t 0.157 S u v o 0.3 ( 1 + 1.09 X t t 0.039 ) 0.4 [ ( ρ l ρ v ) ( μ v μ l ) 2   ] 0.084         f o r   R e l > 1250
ϕ v = 1 + C X + X 2                     S u v o = ρ v σ D μ v 2
C and X are calculated by Kim and Mudawar [89] method.
General correlations for condensation in mini/micro-channels.
Dorao and Fernandino [49] N u t p = ( N u I 9 + N u I I 9 ) 1 9
N u I = 0.023   R e t p 0.8   P r t p 0.3
N u I I = 41.5   D 0.6   R e t p 0.4   P r t p 0.3
General correlations for condensation in horizontal tubes.
Shah (2016) [90] h t p = h I               F o r       J g 0.98 ( ( 1 x 1 ) 0.8 P r e d 0.4 + 0.263 ) 0.62 a n d       W e v o 100
h t p = h N u           F o r         J g 0.95 ( 2.27 ( ( 1 x 1 ) 0.8 P r e s 0.4 ) 1.249 + 1.254 ) 1
h t p = h N u + h I           F o r     o t h e r   r e g i m e s
h I = 0.023 R e l o 0.8 P r l 0.4 [ 1 + 1.128 x 0.8170 ( ρ l ρ g ) 0.3685 ( μ l μ g ) 0.2363 × ( 1 μ g μ l ) 2.144 P r l 0.100 ] ( k l D )
h N u = 1.32 R e l 1 3   [   ρ l ( ρ l ρ v ) g k l 3 μ l 2   ] 1 3
J g = x G ( g D ρ v ( ρ l ρ v ) ) 0.5               W e v o = G 2 D ρ v σ
General correlations for condensation in horizontal mini/micro-tubes.
Shah (2019) [57] F o r     J g 0.98 ( ( 1 x 1 ) 0.8 P r e d 0.4 + 0.263 ) 0.62 , F r l > 0.012   a n d   W e v o 100 :
h t p = h I            
F o r         J g 0.95 ( 2.27 ( ( 1 x 1 ) 0.8 P r e s 0.4 ) 1.249 + 1.254 ) 1 a n d   F r l > 0.012  
h t p = h N u        
F o r     o t h e r   r e g i m e s   :
h t p = h N u + h I
F r L = G 2 ρ l 2 g D
h I ,   h N u ,   J g   and     W e v o are calculated by Shah (2016) method.
Akers et al. [91] N u t p = CPr l 1 3 { G [ ( 1 x ) + x ( ρ l ρ V ) 0.5 ] D μ l } n
C = 0.026 ,   n = 0.8   for   Re eq > 50000
C = 5.3 ,   n = 1 3   for   Re eq < 50000
R e e q = G [ ( 1 x ) + x ( ρ l ρ v ) 0.5 ] ( D μ l )
Condensations for horizontal plain tubes
Crosser [92] N u t p = 0.0265 P r l 1 3   ( G ( x ( ρ l ρ v ) 0.5 ) D μ l ) n
n = 0.8           f o r         G x μ l > 60000
n = 0.2           f o r         G x μ l < 60000
Bohdal et al. [93] N u t p = 25.084   R e l 0.258 P r l 0.495   P r e s 0.288 ( x 1 x ) 0.266 R134a and R410A condensation in mini-channels
Hosseini et al. [56] For   G 200   k g   m 2 s 1 :
N u t p = 0.0022 × R e t p × ( ρ l ρ v ρ l ) + 0.0342 × W e v o × ( ρ l ρ v ρ l ) 2 + S i n ( 39.8963 × P r e d ) L n ( W e v o ) 0.0298 0.2203 × F r l P r t p  
For   G > 200   k g   m 2 s 1 :
N u t p = A B S ( 0.0169 R e t p 0.8620 0.00146 R e t p P r t p ( ρ l ρ v ρ l ) + 0.0036 + 0.0171 W e v o F r l + 17.9480 sin ( 0.0036 + 0.0171 W e v o F r l ) + tan ( 27.6370106546243 ( ρ l ρ v ρ l ) ) tan ( 369.8572 + sin ( 0.0036 + 0.01712 W e v o F r l ) ) )
General correlations for condensation in single-port horizontal plain tubes
Table 4. AARD and AAD analysis of different correlations for various data sources.
Model
A A R D   %
A A D   %
ReferencesAkers et al. [91]Crosser [92]Bohdal et al.
[93]
Shah (2016)
[90]
Shah (2019)
[57]
Dorao and Fernandino [49]Hosseini et al. [56]Kim and Mudawar [52]GP correlation
Agarwal [72]44.06
41.63
83.56
−83.56
40.09
36.40
68.35
−68.35
68.35
−68.35
70.93
−70.93
76.33
−76.33
72.94
−72.94
17.91
−4.55
Belchi et al. [73]144.97
144.97
30.61
−30.48
128.72
128.72
21.23
18.65
21.23
18.65
15.00
10.95
24.72
1.19
16.38
11.37
17.54
−7.91
Belchi et al. [74]184.29
184.29
20.74
−5.72
190.63
190.63
60.45
60.45
60.45
60.45
59.83
59.83
63.26
63.26
41.05
41.05
16.41
14.16
Agarwal et al. [75]143.40
143.25
47.80
−47.80
100.93
100.27
22.77
−1.92
22.77
−1.92
23.80
−4.88
24.78
−5.76
23.85
−14.58
22.59
−4.98
Belchi et al. [76]153.28
153.28
26.62
−20.03
170.31
170.31
35.13
34.54
35.13
34.54
34.78
34.16
39.60
39.50
23.50
21.82
9.96
−2.49
Fronk and Garimella [37]273.45
273.45
57.49
−57.49
170.52
170.52
31.09
−30.41
31.09
−30.41
30.72
−30.44
34.61
−34.27
37.78
−37.78
14.59
2.43
Bandhauer et al. [77]129.60
129.60
40.92
−40.92
87.58
86.65
12.08
5.42
12.08
5.42
11.94
3.60
15.61
4.01
12.66
−8.10
17.72
−4.01
Cavallini et al. [78]63.59
57.97
43.90
−43.90
53.81
44.01
8.91
−4.03
8.91
−4.03
9.82
−5.27
12.25
1.68
19.04
−17.93
25.98
−25.98
Belchi [79]315.23
315.23
34.81
21.10
224.80
224.80
117.50
117.50
117.50
117.50
105.43
105.43
122.73
122.73
92.85
92.85
52.30
51.82
Belchi et al. [80]177.70
177.70
26.17
−25.28
200.52
200.52
32.07
32.07
32.07
32.07
31.03
31.03
38.50
38.50
22.41
21.95
8.00
−4.25
Derby et al. [54]182.16
182.16
55.93
−55.93
149.56
149.56
11.79
9.57
11.79
9.57
14.55
−11.18
35.33
1.75
13.38
−11.13
17.07
16.75
Andresen [81]201.77
201.77
17.66
−11.44
91.15
90.09
39.38
39.28
39.38
39.28
40.96
40.96
17.46
0.43
22.03
19.10
21.31
11.21
Heo and Yun [82]384.25
384.25
55.87
42.53
382.29
382.29
132.05
132.05
132.05
132.05
134.14
134.13
123.45
123.38
116.22
116.22
21.74
10.60
Gomez et al. [83]84.08
84.08
44.40
−44.33
43.28
43.28
7.65
−1.02
7.65
−1.02
10.42
−8.00
6.52
−0.57
15.81
13.42
13.46
−12.03
Jige et al. [38]147.22
147.22
57.47
−57.47
123.73
123.73
17.26
−7.32
17.26
−7.32
30.92
−23.76
30.87
−18.22
26.94
−21.78
14.50
0.25
Park et al. [84]244.99
244.99
42.44
−42.44
173.49
173.49
27.50
20.80
27.72
23.84
22.14
20.59
34.50
23.67
21.13
18.64
14.06
−0.97
Pham et al. [85]652.27
652.27
46.23
1.14
680.51
680.51
179.40
179.40
179.40
179.40
103.09
102.63
116.14
102.92
111.40
111.22
42.09
28.05
Park and Hrnjak [86]232.11
232.11
33.01
−33.01
251.06
251.06
38.77
38.77
38.77
38.77
27.22
23.67
34.06
33.46
24.47
24.04
13.07
−11.26
Li et al. [87]338.36
338.36
31.81
−29.64
353..18
353.18
57.92
57.03
57.92
57.03
30.78
25.07
37.10
27.87
40.40
37.87
15.73
6.26
Wang et al. [55]167.58
167.58
49.10
−49.10
89.72
89.72
17.11
11.22
17.67
12.87
15.43
12.93
28.34
19.57
9.90
−5.32
10.36
8.29
Rahman et al. [88]108.70
107.50
72.09
−72.09
99.34
98.03
24.01
−21.90
24.01
−21.90
47.80
−47.80
49.91
−49.56
38.66
−38.42
20.98
−2.42
Total191.19
190.87
44.07
−33.87
164.97
164.35
43.39
22.94
43.45
23.15
41.54
15.95
44.68
15.92
36.94
8.17
16.87
2.33
Table 5. Comparison of the accuracy of the available models for estimating the HTC in multi-port micro and mini-channels.
Channel DiameterMicro-Channels
( D 0.2   m m ) ,
480 Data Points
Mini-Channels
( 0.2 < D < 3   m m ) ,
3023 Data Points
All Data,
3503 Data Points
ModelsPercentage of Data within the AARD of 20%Percentage of Data within the AARD of 30%AARD (%)Percentage of Data within the AARD of 20%Percentage of Data within the AARD of 30%AARD (%)Percentage of Data within the AARD of 20%Percentage of Data within the AARD of 30%AARD (%)
Akers et al. [91]14.3620.83134.391.361.72200.213.144.34191.19
Crosser [92]0.000.0073.3122.2336.0939.4319.1831.1444.07
Bohdal et al. [93]16.8625.8391.454.306.55176.645.999.19164.97
Shah (2016) [90]10.2116.6753.6840.1355.9441.7636.0350.5643.39
Shah (2019) [57]10.2116.6753.6839.9355.7141.8235.8650.3643.45
Dorao and Fernandino [49]10.0016.2555.0940.4656.1739.3936.2850.7041.54
Hosseini et al. [56]9.3813.9659.9132.0949.4942.2728.9844.6244.68
Kim and Mudawar [52]4.177.2959.1049.1963.4433.4243.0555.7536.94
New Correlation68.7584.5816.6070.6684.7516.9170.3784.7316.87
Table 6. Thermophysical characteristics of R134a at 50 and 60 °C.
T s   ( ) ρ l   ( k g   m 3 ) ρ v   ( k g   m 3 ) k l   ( w   m 1 K 1 )
501102.366.270.070427
601052.987.380.066091
Table 7. Thermophysical properties of R290 and R32.
Fluids T s   ( ) ρ l   ( k g   m 3 ) ρ v   ( k g   m 3 ) H l v   ( k J   K g 1 )
R29040467.4630.165307.06
R3240893.0473.268237.10
Publisher’s Note: MDPI stays neutral with regard to jurisdictional claims in published maps and institutional affiliations.

