
A New 12-Lead ECG Signals Fusion Method Using Evolutionary CNN Trees for Arrhythmia Detection


1
Department of Computer Engineering and Information Technology, Razi University, Kermanshah 6714414971, Iran
2
Department of Applied Data Science, Noroff University College, 4612 Kristiansand, Norway
*
Author to whom correspondence should be addressed.
Mathematics 2022, 10(11), 1911; https://doi.org/10.3390/math10111911
Submission received: 12 April 2022
/
Revised: 27 May 2022
/
Accepted: 30 May 2022
/
Published: 2 June 2022
(This article belongs to the Special Issue Deep Learning and Machine Learning Mathematical Models for Computer Assisted Diagnostic Systems)
Abstract
:The 12 leads of electrocardiogram (ECG) signals show the heart activities from different angles of coronal and axial planes; hence, the signals of these 12 leads have functional dependence on each other. This paper proposes a novel method for fusing the data of 12-lead ECG signals to diagnose heart problems. In the first phase of the proposed method, the time-frequency transform is employed to fuse the functional data of leads and extract the frequency data of ECG signals in 12 leads. After that, their dependence is evaluated through the correlation analysis. In the second phase, a structural learning method is adopted to extract the structural data from these 12 leads. Moreover, deep convolutional neural network (CNN) models are coded in this phase through genetic programming. These trees are responsible for learning deep structural features from functional data extracted from 12 leads. These trees are upgraded through the execution of the genetic programming (GP) algorithm to extract the optimal features. These two phases are used together to fuse the leads of ECG signals to diagnose various heart problems. According to the test results on ChapmanECG, including the signals of 10,646 patients, the proposed method enjoys the mean accuracy of 97.60% in the diagnosis of various types of arrhythmias in the Chapman dataset. It also outperformed the state-of-the-art methods.
1. Introduction
Electrocardiogram (ECG) sensors measure the electrical activities of cardiac muscles in the supraventricular and ventricular areas. However, the functions of different muscles might sometimes adversely be affected by various factors, such as high levels of blood lipids, which causes arrhythmia in the electrical performance of the heart. For instance, emergence of cardiac problems in the walls of ventricles is a factor of arrhythmia. Another complication is the supraventricular problem in the upper walls of the ventricles called atria, which leads to arrhythmia in the electrical signal of the heart [1,2]. In particular, there are 11 types of arrhythmias in these two categories: sinus bradycardia, sinus rhythm, atrial fibrillation, sinus tachycardia, atrial flutter, sinus irregularity, supraventricular tachycardia, atrial tachycardia, atrioventricular node reentrant tachycardia, atrioventricular reentrant tachycardia, and sinus atrium to atrial wandering rhythm. According to the statistics, adults aged 35–90 years old experience nearly one-third of lethal factors, such as cardiac complications [3]. Thus, researchers have tried to introduce efficient methods for the early diagnosis and classification of irregularities in ECG signals by using smart computer systems. The 12-lead ECG signals show the heart activities from different angles of coronal and axial planes; hence, the signals of these 12 leads have functional dependence on each other. In addition, the simultaneous applications of these data between leads resulted in the emergence of latent medical variables, which cannot be measured only through single leads [4,5].
Fusion is a suitable approach for improving the performance of ECG-based detection algorithms and generally takes place at the hardware and software levels [6,7]. At the hardware level, fusion improves data measurement operations [8]. In ECG signals, heart information is obtained from multiple equal leads instead of one. Fusing the information obtained from these leads will provide a better assessment of heart function [9]. Generally, there are chest leads and limb leads, and each lead views the heart from a particular angle. At the software level, fusion improves the quality of the collected data. The goal is a better knowledge-extraction process from data. The first category of software fusions is feature-based fusion algorithms [10,11]. Algorithms, such as feature correlation, ranking, and frequency conversions, are used to fuse different classes. Inter-class algorithms fuse different features from different classes. In intra-class fusion, however, the features belonging to one class are fused to extract knowledge. As mentioned in [12], traditional fusion algorithms are for extracting suitable features from ECG signals (in both fiducial and non-fiducial groups) to fuse a specialized engineering process which requires knowledge about the signal. Therefore, hand craft feature generation eliminates the generalization feature and does not help in designing an efficient system. Deep-learning models, such as convolutional neural network (CNN) [5,13,14] and long short-term memory (LSTM) [15], have recently been used for software fusion. Deep-learning methods, such as CNN, present a hybrid view of raw data in multiple processing layers, which leads to automatic learning from the data. Given CNN’s abilities, it has been used extensively in ECG detection and has led to superior operations. Although CNN-based feature generation methods are very accurate and have significantly improved biometric detection in ECG, the architectural parameters of CNN models (as explained), including the number and type of layers, are designed through trial and error. This solution is time-consuming and requires domain knowledge, and the complexity of the designed model is directly correlated to its designer’s knowledge [14,16,17,18]. In this paper, we propose a novel method for fusing the data of 12-lead ECG signals to diagnose heart problems.
This paper consists of the following sections. ECG data is described in detail in Section 2. The proposed method is described thoroughly in detail in Section 3, whereas the results are presented in Section 4 that also evaluates the parameters of the proposed method in comparison with other techniques. Finally, Section 5 presents the discussion and draws a conclusion.
2. ECG Data
The ECG dataset used in this article was collected by Chapman University and Shaoxing People’s Hospital (Chapman ECG in short) [19]. This dataset comprises eight types of arrhythmia atrial flutter (AF) with 112 samples, Sinus bradycardia (SB) with 3889 samples, supraventricular tachycardia (SVT) with 587 samples, sinus tachycardia (ST) with 1568 samples, sinus rhythm (SR) with 1826 samples, atrial fibrillation (AFIB) with 1780 samples, and sinus irregularity (SI) with 399 samples. The signals for each person were recorded within several days and during different sessions by ECG sensors. In this dataset, the 12-lead ECG signals were recorded from 10,646 people with a frequency higher than 500 Hz. Each ECG signal in 12-lead is a 10-s strip. In addition, an initial pre-processing was applied to this dataset to smooth the ECG signals using the Butterworth filter and the non-local means technique. All samples of this dataset are classified into three sections, validation, train, and test, bearing the shares of 70%, 15%, and 15%, respectively.
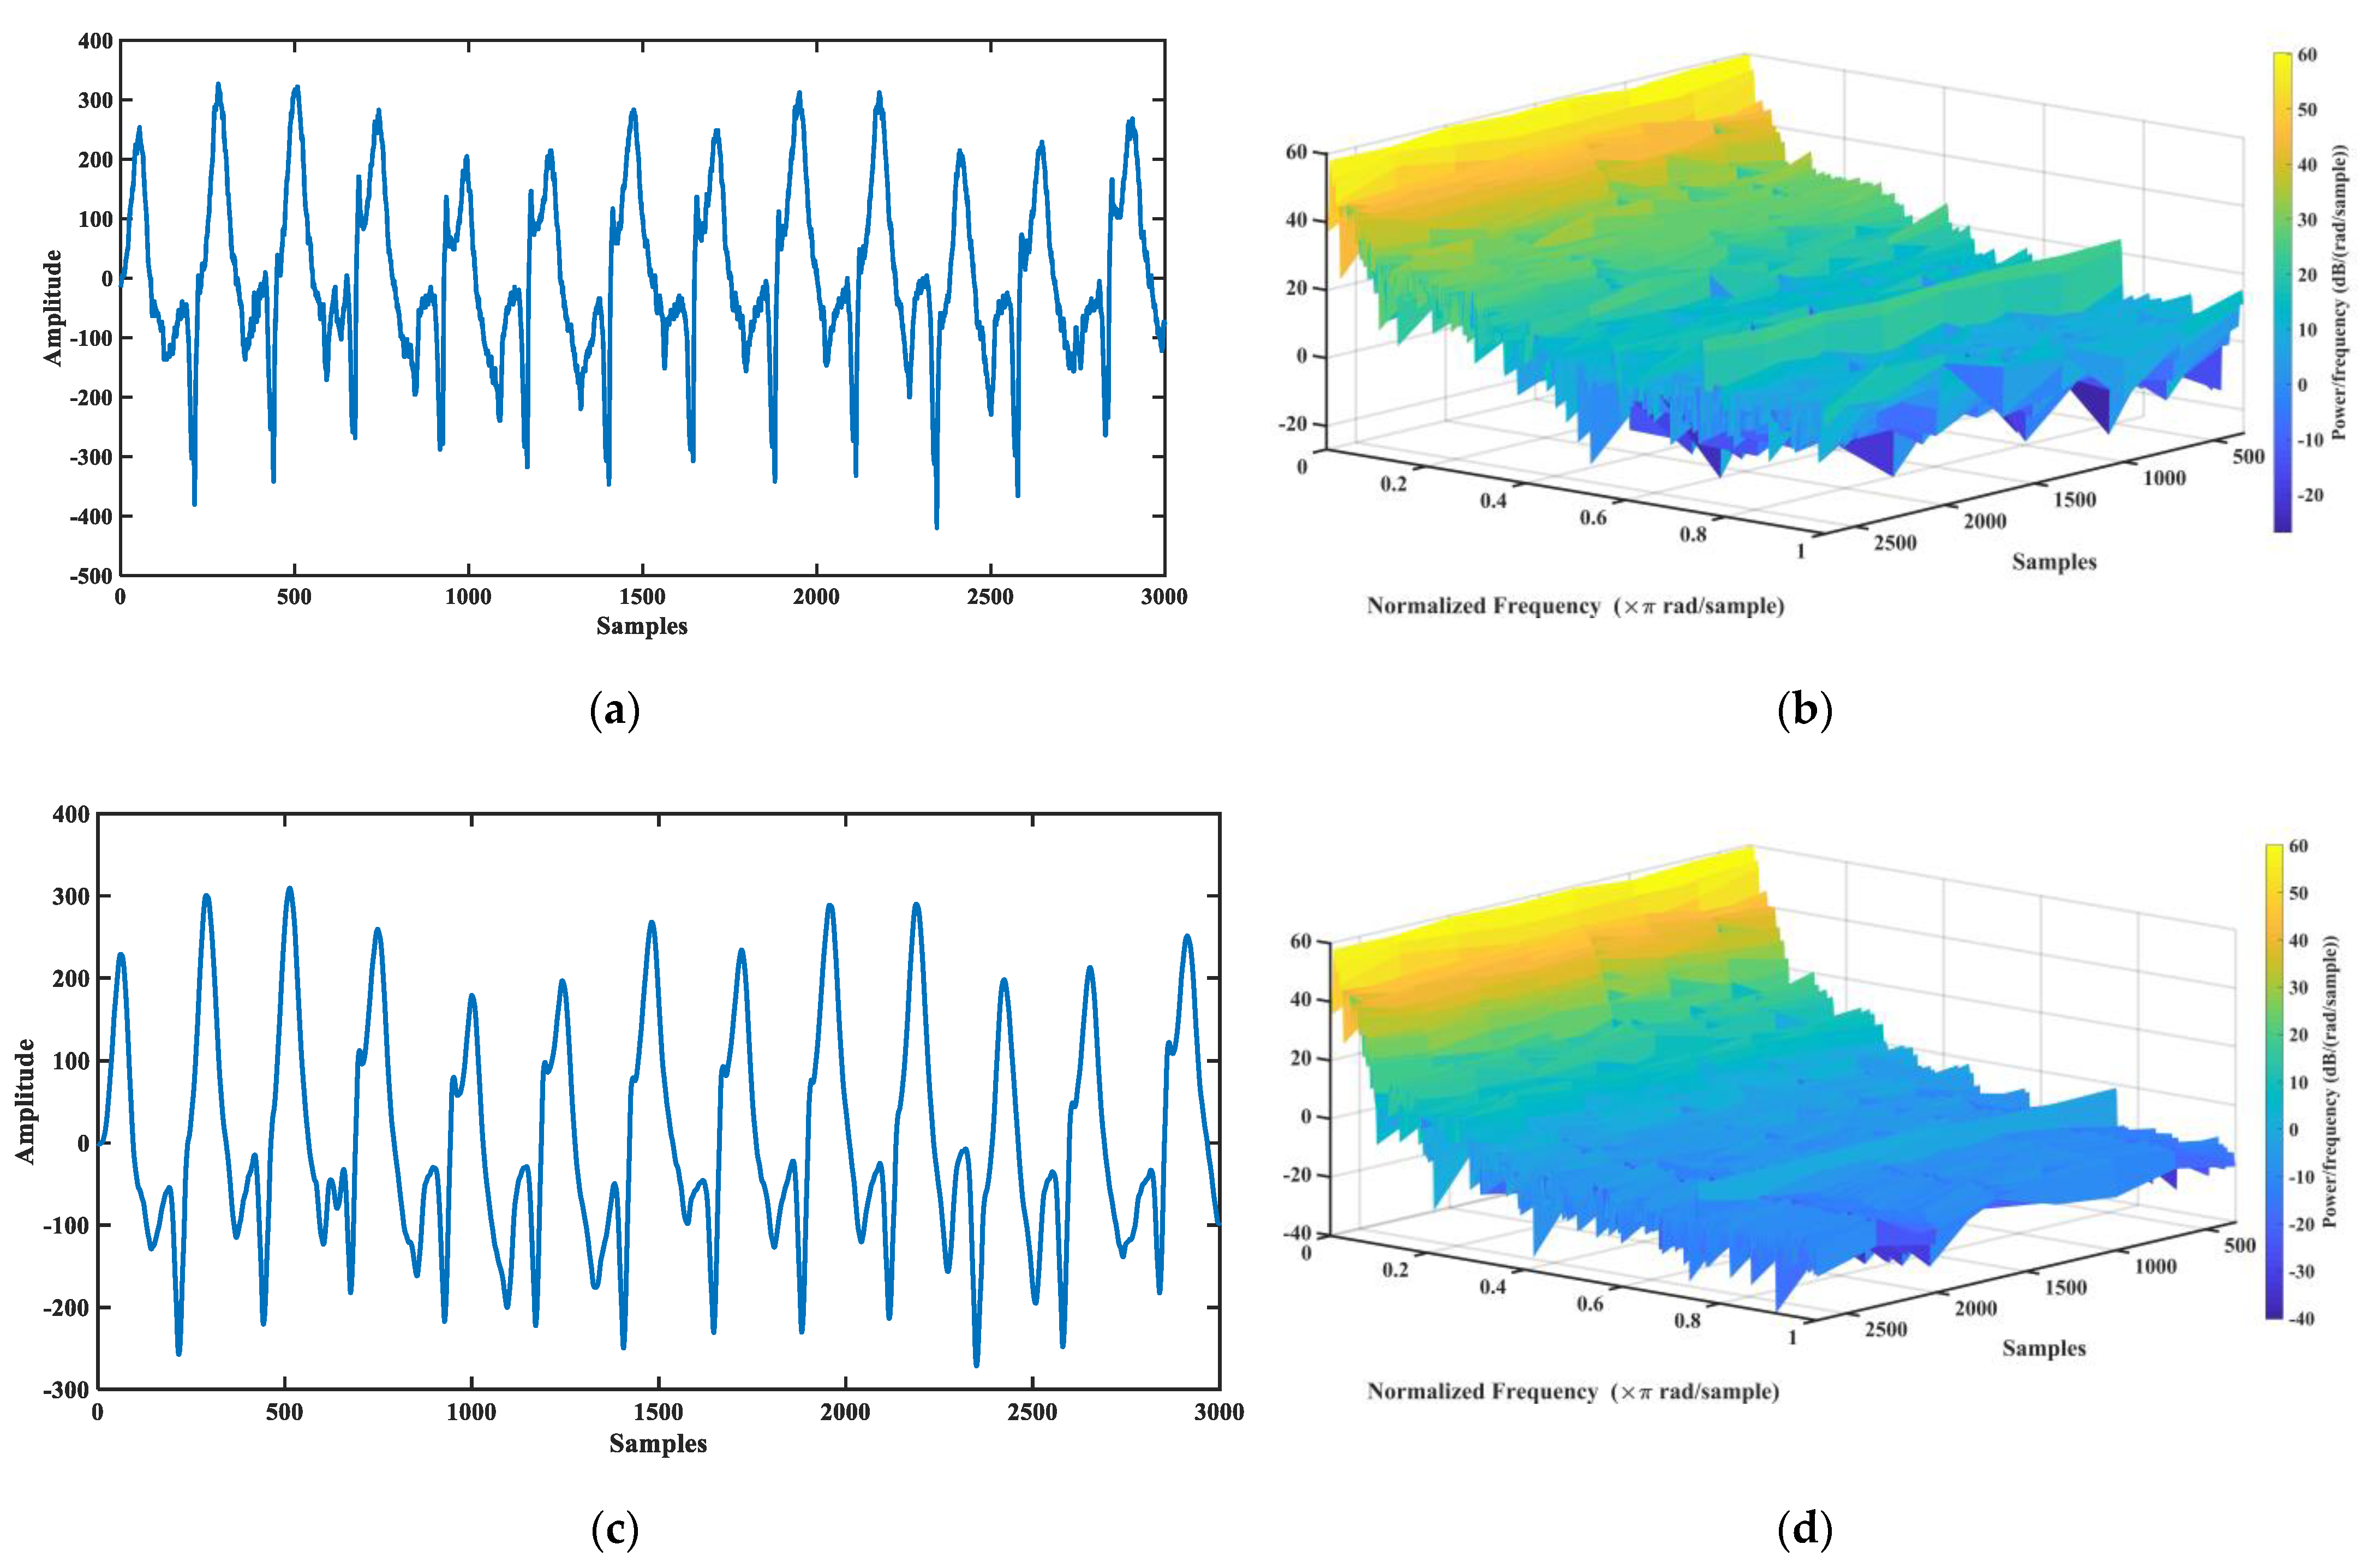
Figure 1 shows an ECG signal that has undergone the smoothing operation. Figure 1a shows the raw ECG signal with the domain of −500 mV to 400 mV. Figure 1b shows the 3D spectrogram of this raw signal. Figure 1c manifests the smoothed signal with a domain of −300 mV to 300 mV. Additionally, Figure 1d shows the spectrogram of the smooth signal, which revealed that the higher frequencies are decreased in it. The pre-processing will be quite effective in reducing the complexity of the model through the normalization of the numbers.
3. The Proposed Method
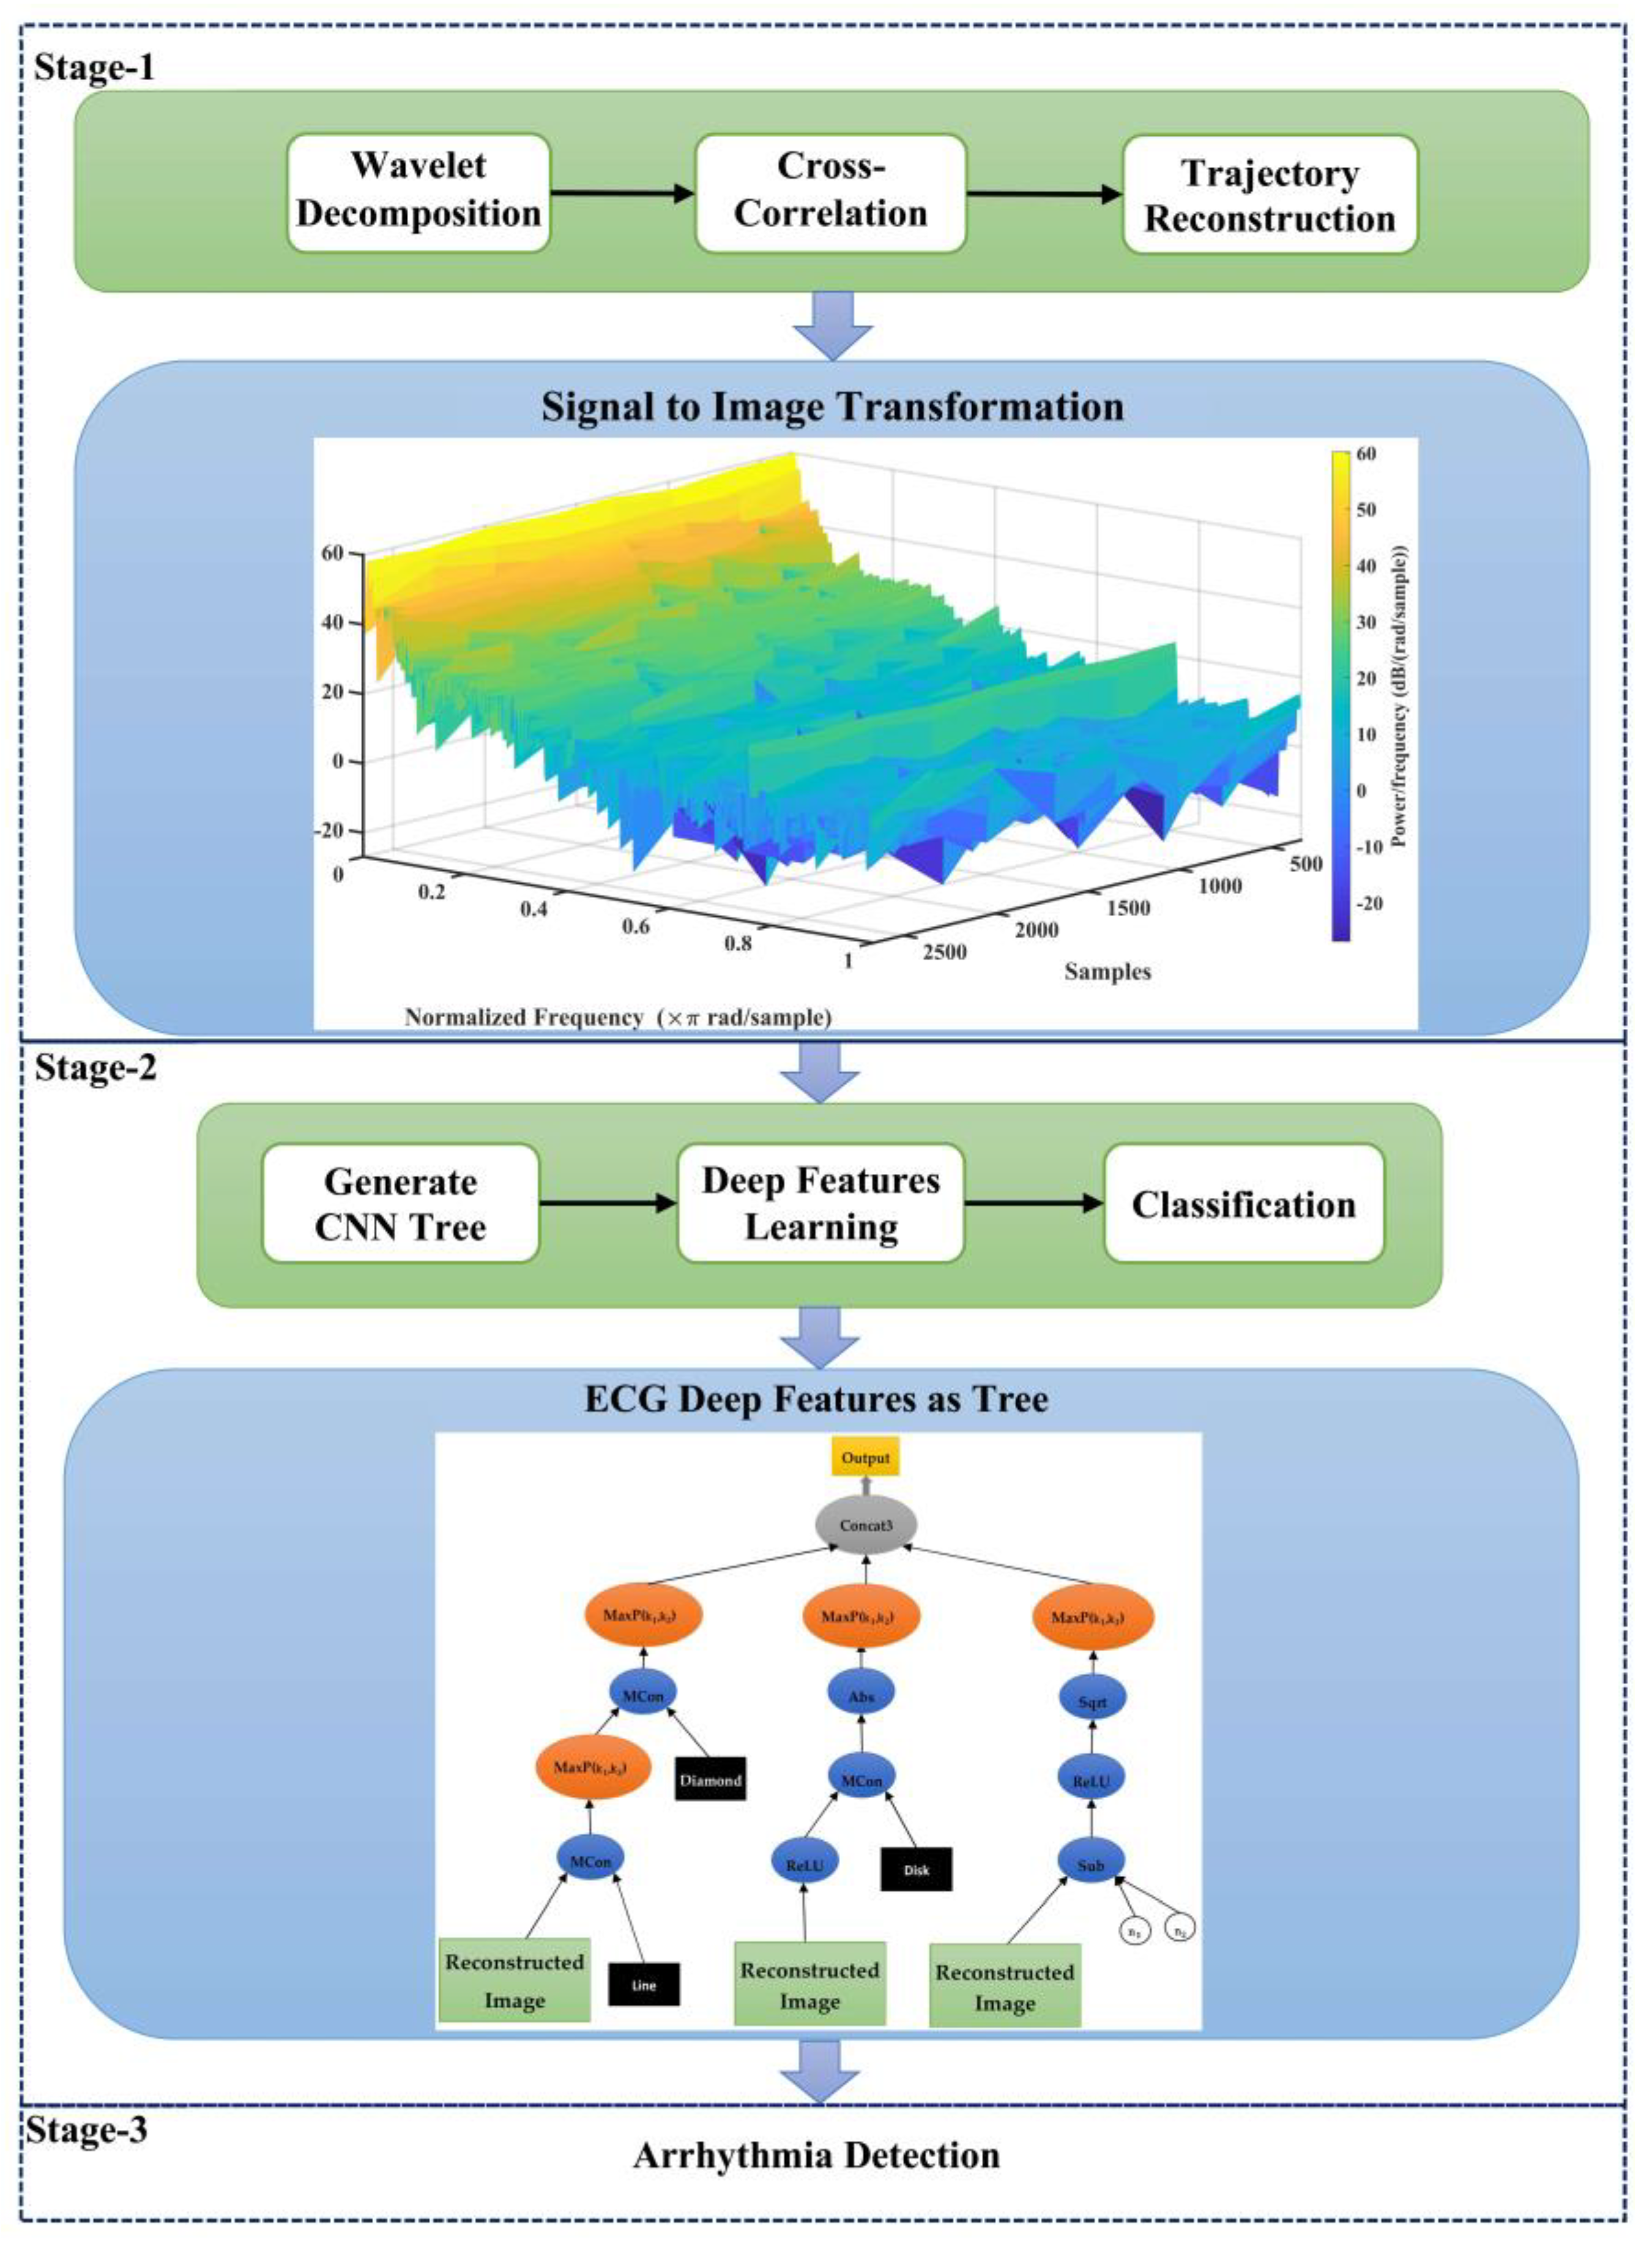
This paper introduces an ECG signal detection system based on deep fusion. First, genetic programming-based evolutionary programming was used to solve problems with deep-learning fusion algorithms. In the proposed method, the CNN models used for fusion are coded as genetic programming (GP) programs [18]. These programs are binary trees whose nodes have embedded deep operators, such as convolution for fusion of ECG leads. During the evolutionary process, these trees evolve and the best variants for fusing ECG lead information are calculated at the software level. Finally, the best sample for fusing leads is extracted. To create an ECG-based detection system, this thesis conducts a full analysis of the ECG signal to maintain the system’s generalization. To this end, the signal’s frequency information is obtained via wavelet frequency conversion, and the similar information is calculated. Because CNN has a convolution filter, it is a model made for images; thus, in this paper, a method for converting the raw ECG signal to an image is presented. Then, signals are converted into images using a mixed conversion and given to CNN trees as frequency information. The proposed system’s performance was evaluated on a dataset of 10,000 arrhythmia patients (Chapman) [19]. This dataset includes 11 different types of arrhythmias, which are measured with a 500 Hz frequency.
Finally, the main contributions of this paper are as follows:
- Employing the approach of trajectory image creation at ECG signals instead of raw signals to increment the integration of the proposed model;
- Proposing a genetic programming-based model to learn deep features at ECG signals and employing several genes at GP to fusion these features.
The flowchart of the proposed method is shown in Figure 2. The innovation of the proposed method to diagnosis arrhythmia using the ECG signal of individuals is based on drawing a trajectory as a figure for each 12-ECG signal leads. Since the ECG signal is periodic, frequency analysis on it can give useful information about this signal. For this, frequency analysis was performed using the wavelet packet transform on each of the 12-ECG signal leads. Then, cross-correlation was calculated between leads 1 to 12 to describe relations between various leads. To extract the ECG signal trajectory, a repetitive pre-processing was calculated on 12 cross-correlation signals, and their spectrogram was extracted. Finally, a trajectory was drawn for these 12 signals, and the output of the trajectory was saved as a figure. These figures are used to produce features as input to the CNN tree. The CNN tree is then developed based on the GP paradigm.
For this purpose, a set of the initial population is first randomly formed. Every sample of this population is a CNN tree (Section 3.4). The CNN hierarchical tree samples are used in each generation of the GP algorithm to extract features from dataset records. Samples from the CNN tree are used in each generation of the GP algorithm to extract features from dataset records. The SVM model is then taught to calculate the fit of each tree using the created features. Then, the SVM model classification error value is considered as the tree fit. The trees keep evolving until the end of generations by repeating this process. Eventually, the best sample in the population with the highest quality feature producer is selected under the name CNN tree.
3.1. Wavelet Decomposition of ECG Signal
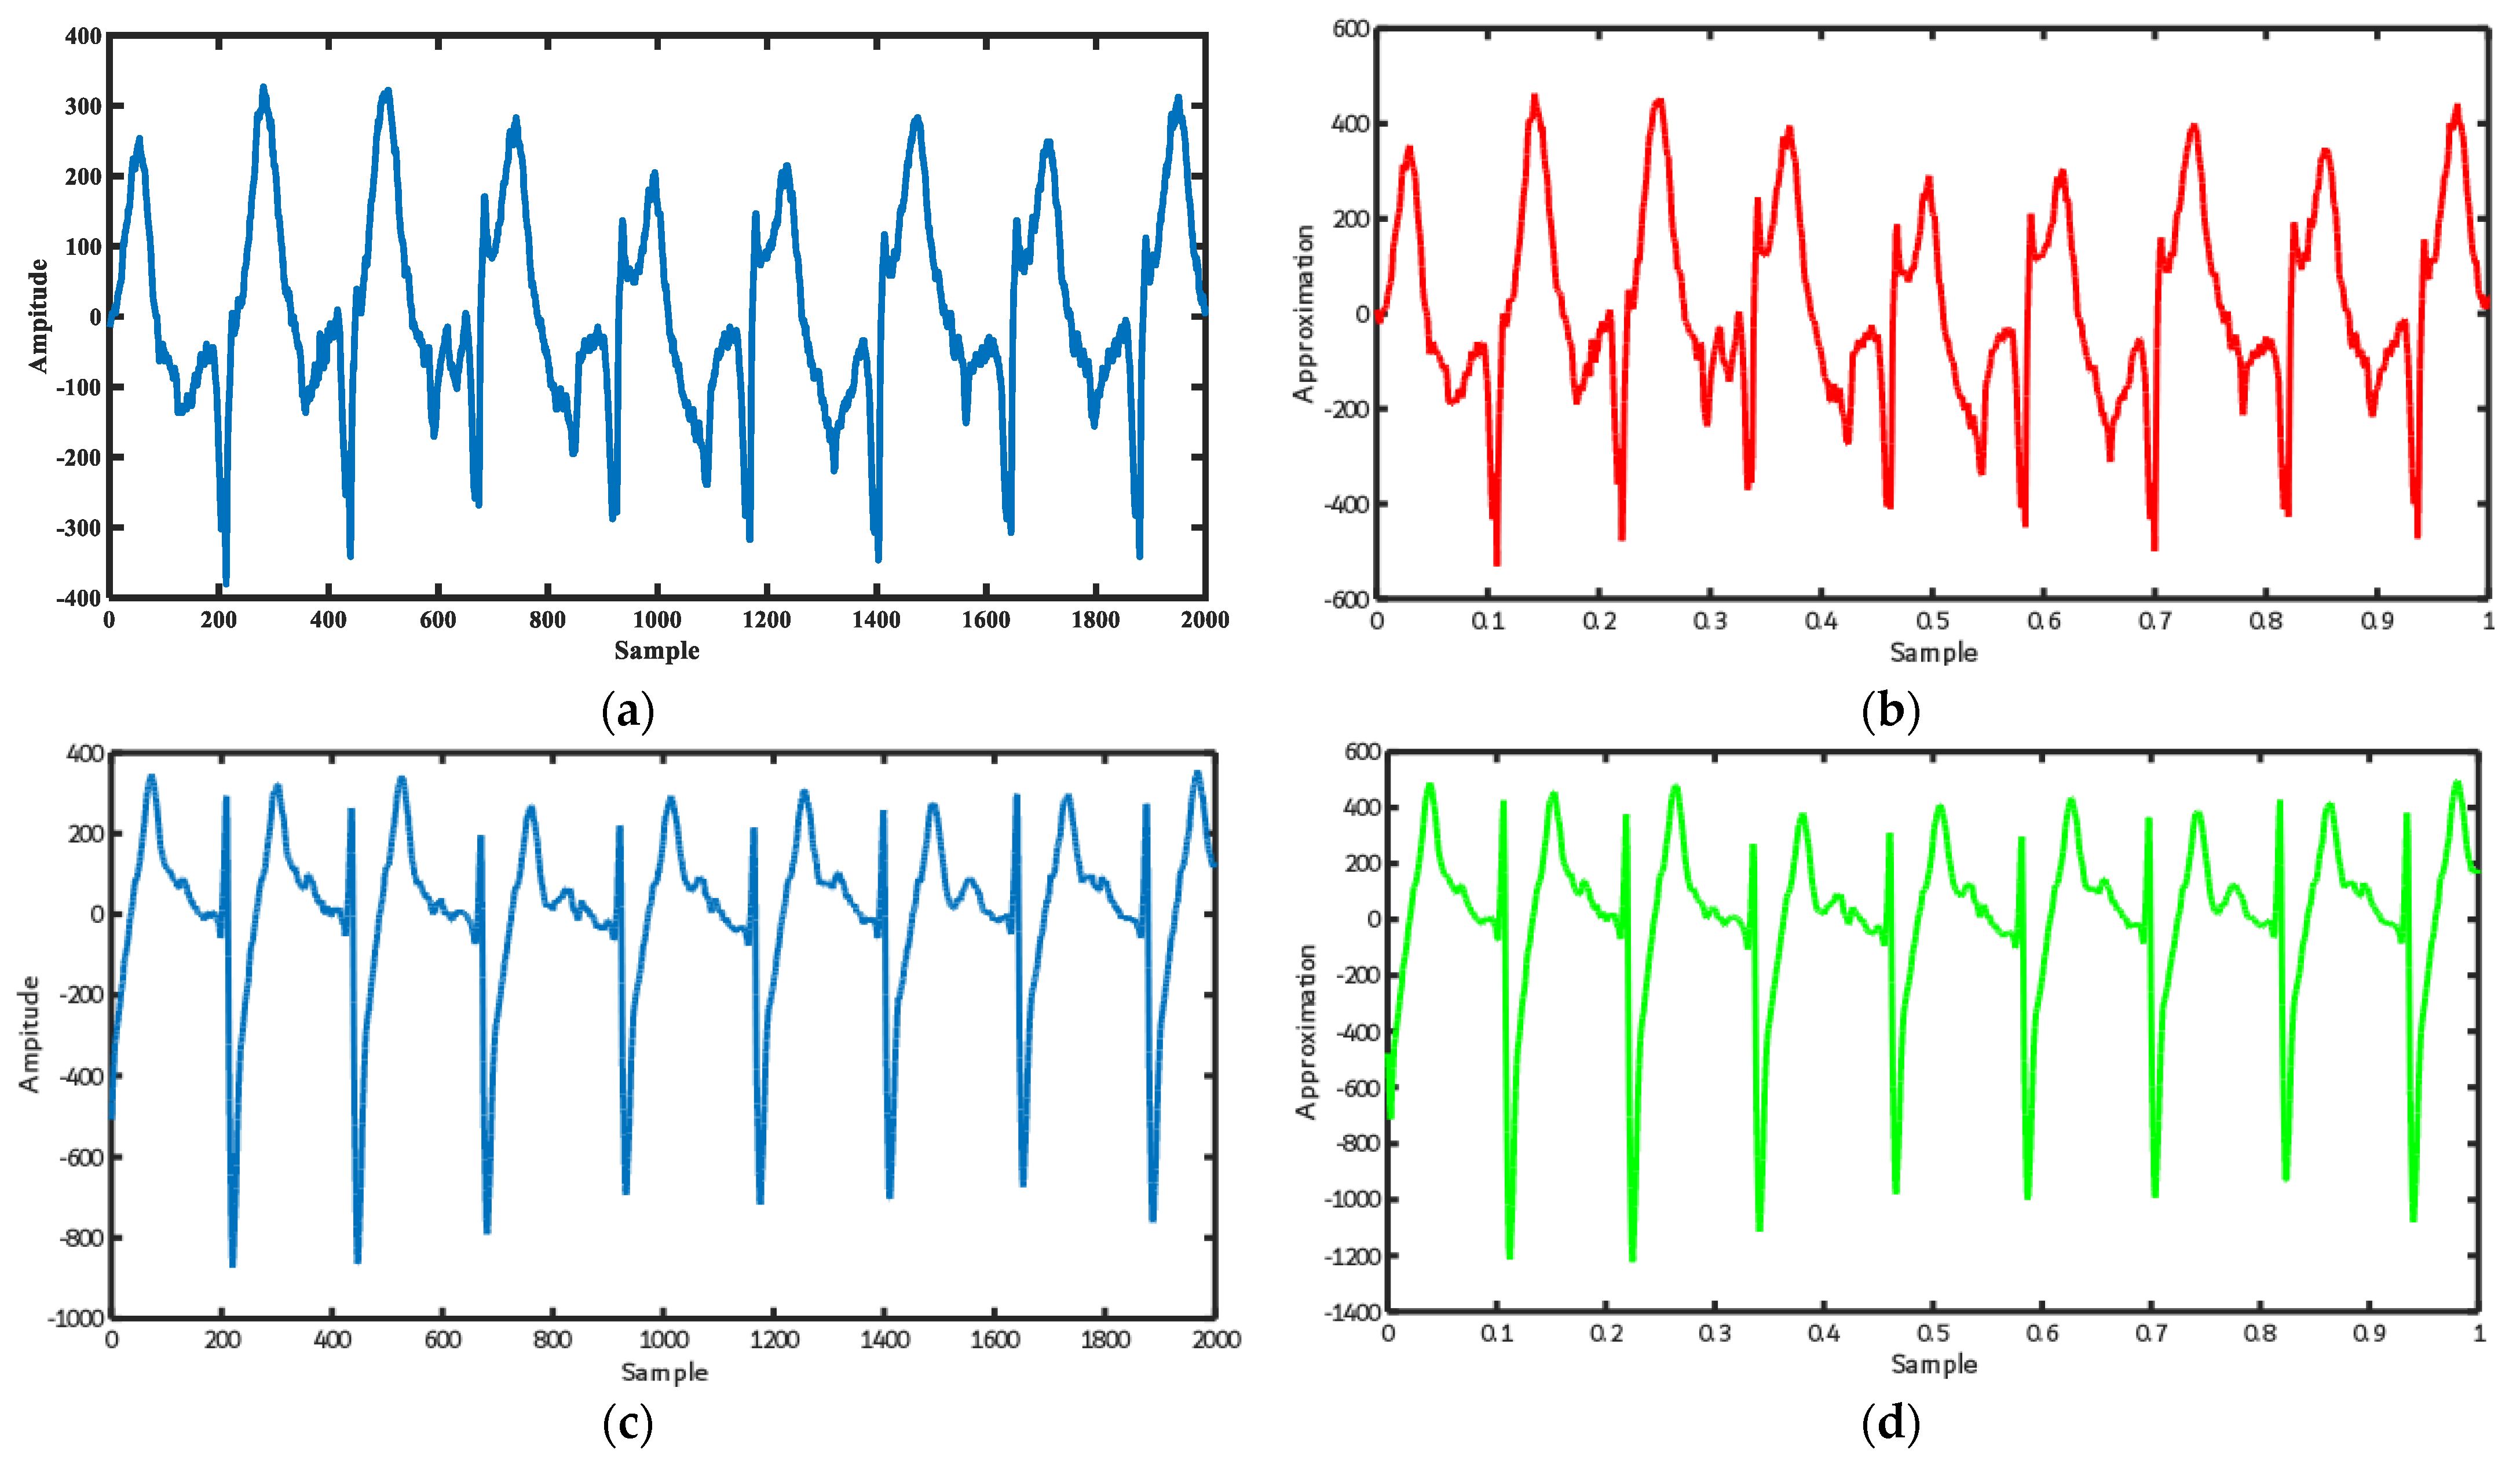
Here, a wavelet packet analysis was performed to extract details and approximate the ECG signal. To decompose the ECG signal, a five-order wavelet of Daubechies type was used in the decomposition of ECG signal wavelet. Given the fewer details in the ECG signal, signal decomposition was performed only up to the first level of the tree. In this equation, and are respective details and approximation signals. Figure 3 shows the output of the frequency analysis of the ECG signal with the wavelet packet transform.
3.2. Calculate Cross-Correlation between 12-Lead ECG
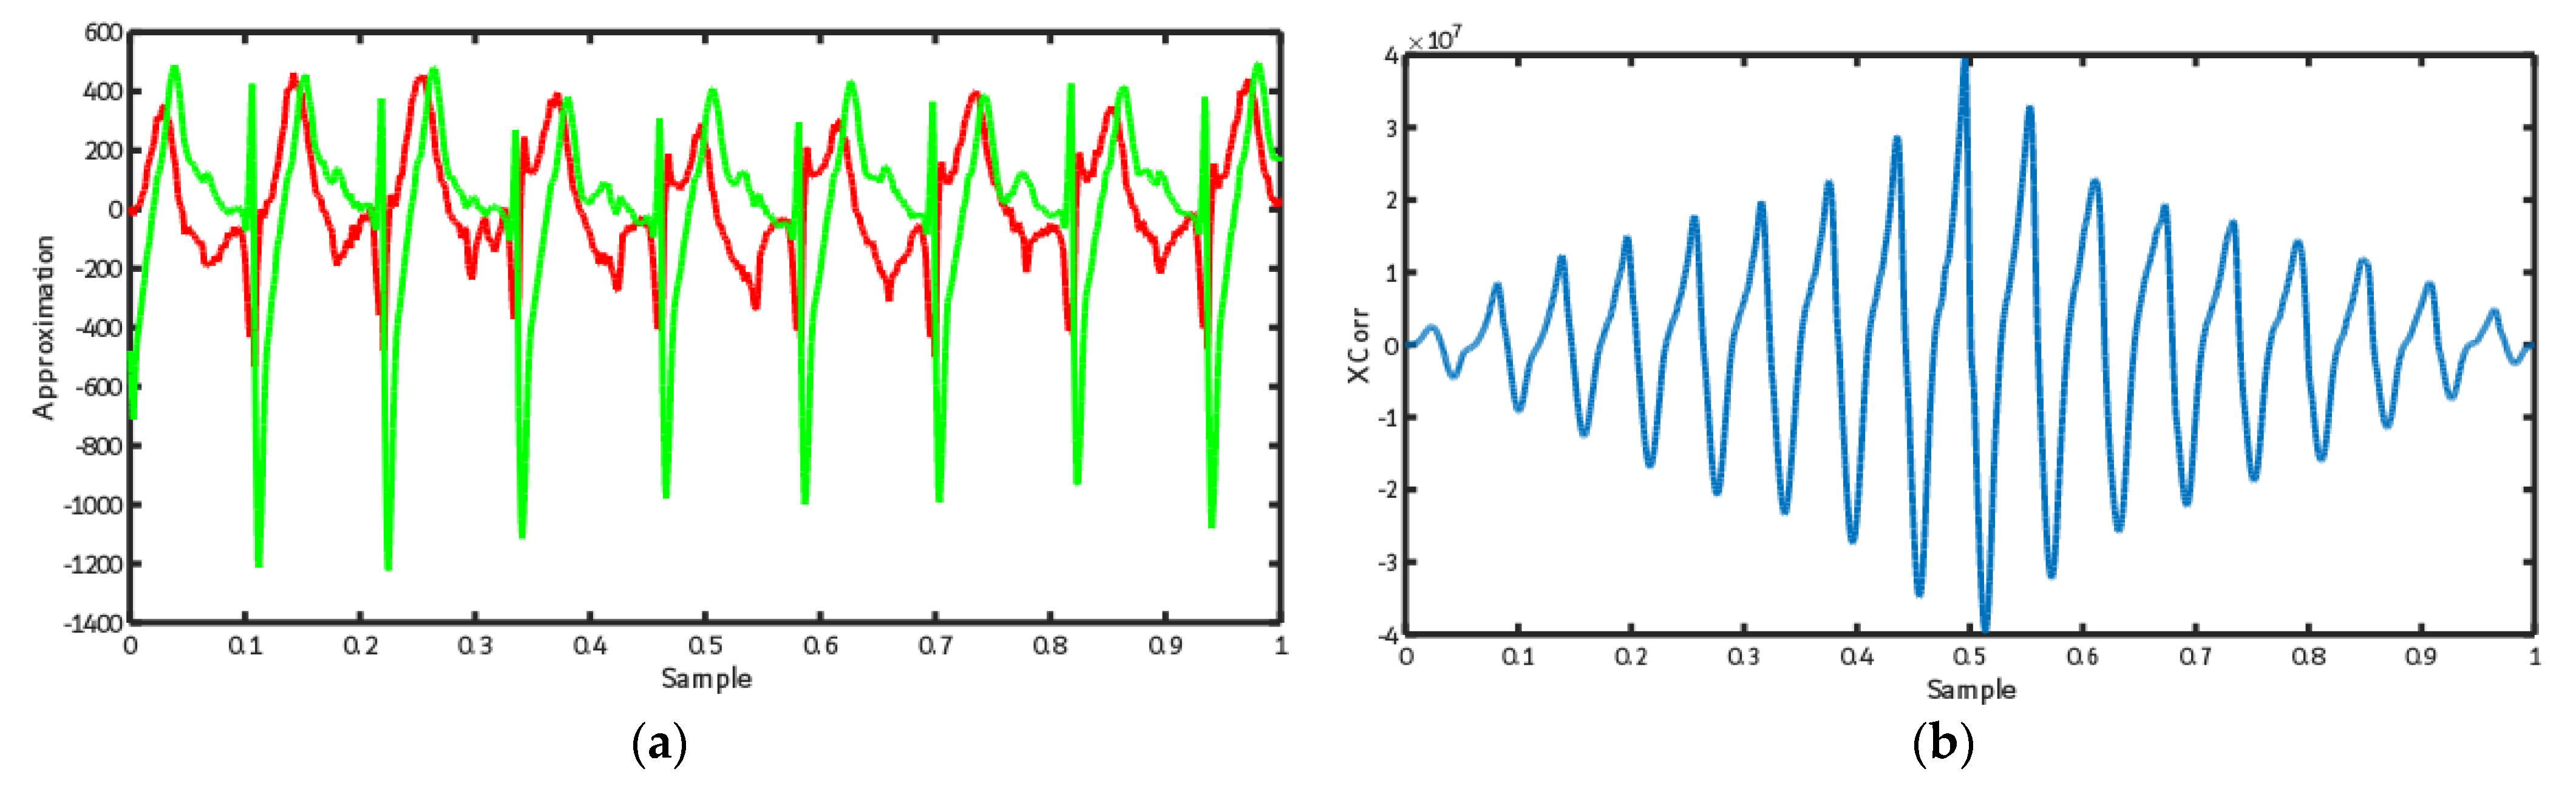
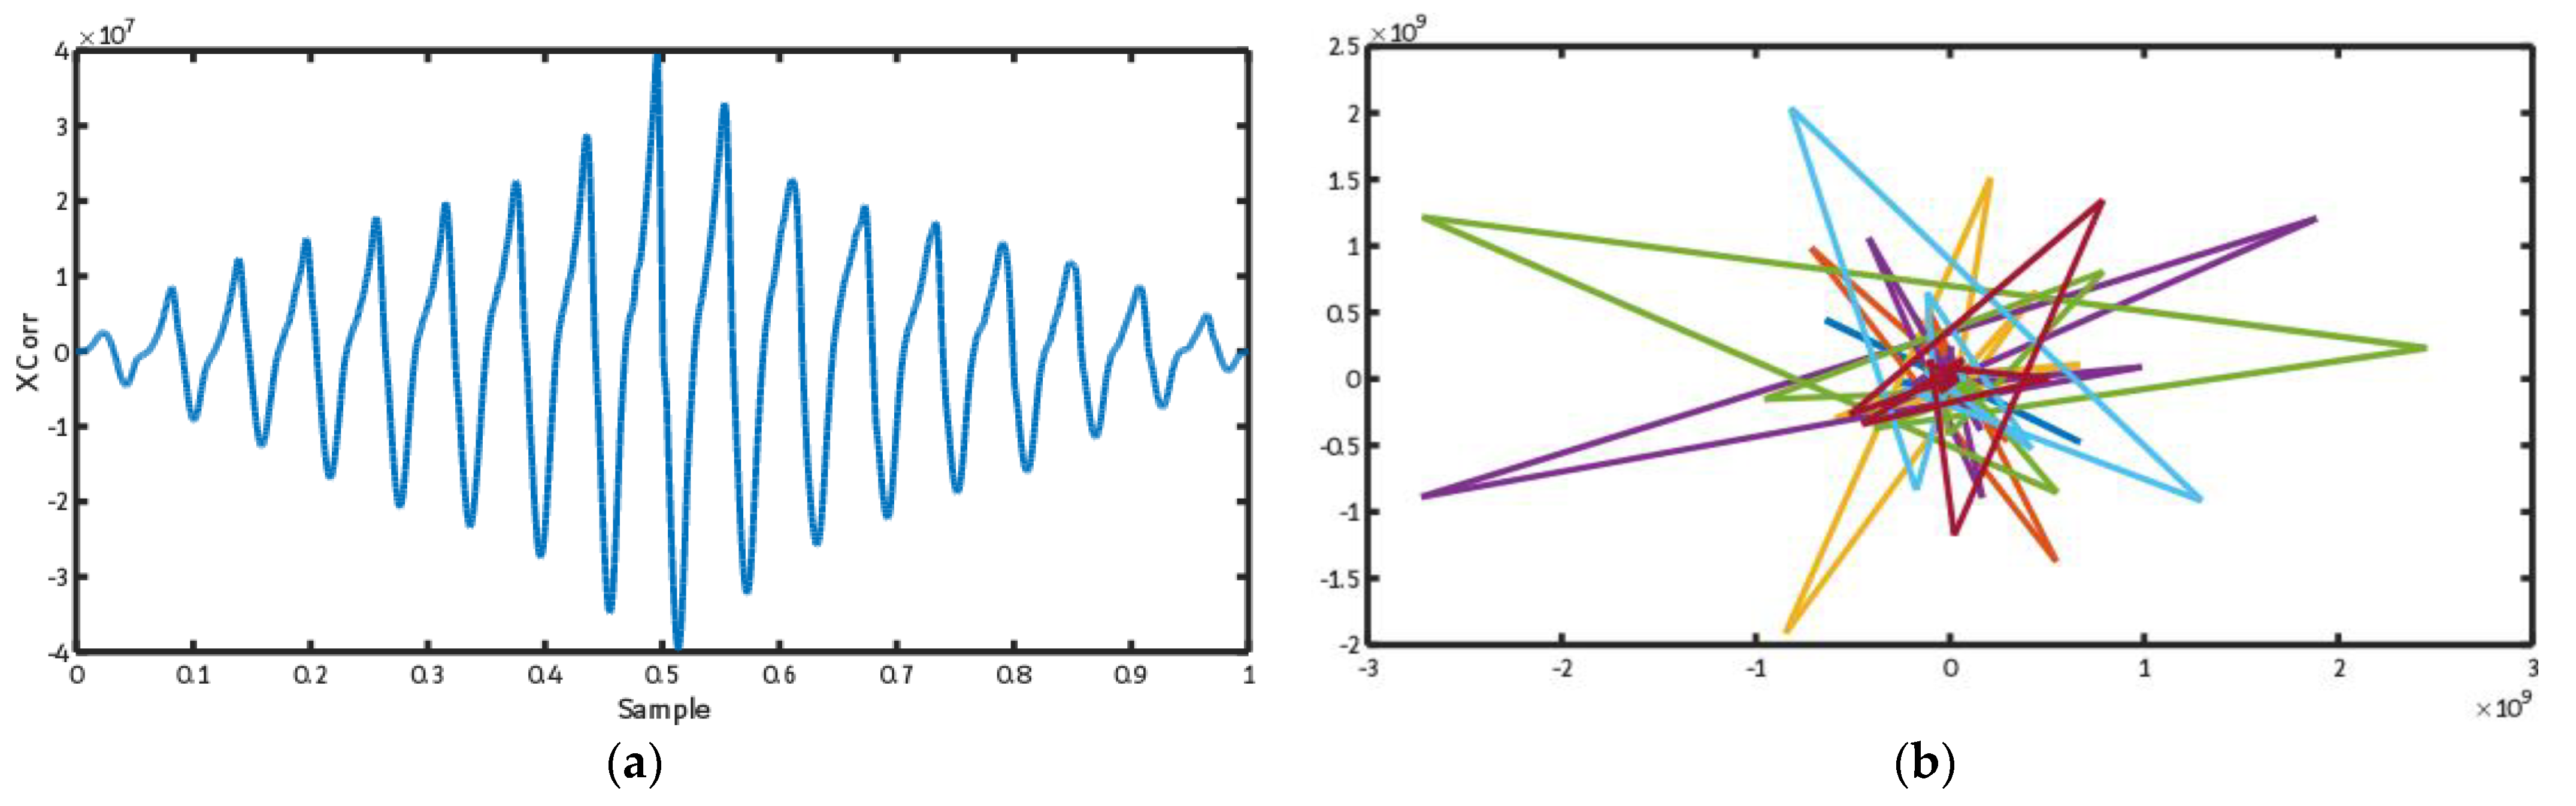
Cross-correlation is one of the useful tools to describe the relations between various leads of the ECG signal. Figure 4 shows the cross-correlation output between the approximation signal of the leads I and II of the ECG signals. As illustrated, there is a regular cross-correlation between these two leads due to the high similarity between signals of various leads of the ECG signal, as stated in the previous sections.
3.3. ECG Trajectory Image Presentation
To prepare input data of the CNN tree, we calculated the ECG trajectory in this section. The output of the spectrogram display of an ECG signal is created as complex numbers. To draw the trajectory of this spectrogram, its real and imaginary sections should be illustrated as a two-dimensional function. Figure 5 shows the trajectory for cross-correlation between leads I to II of the ECG signal.
3.4. Feature Learning Using the Evolutionary CNN Tree
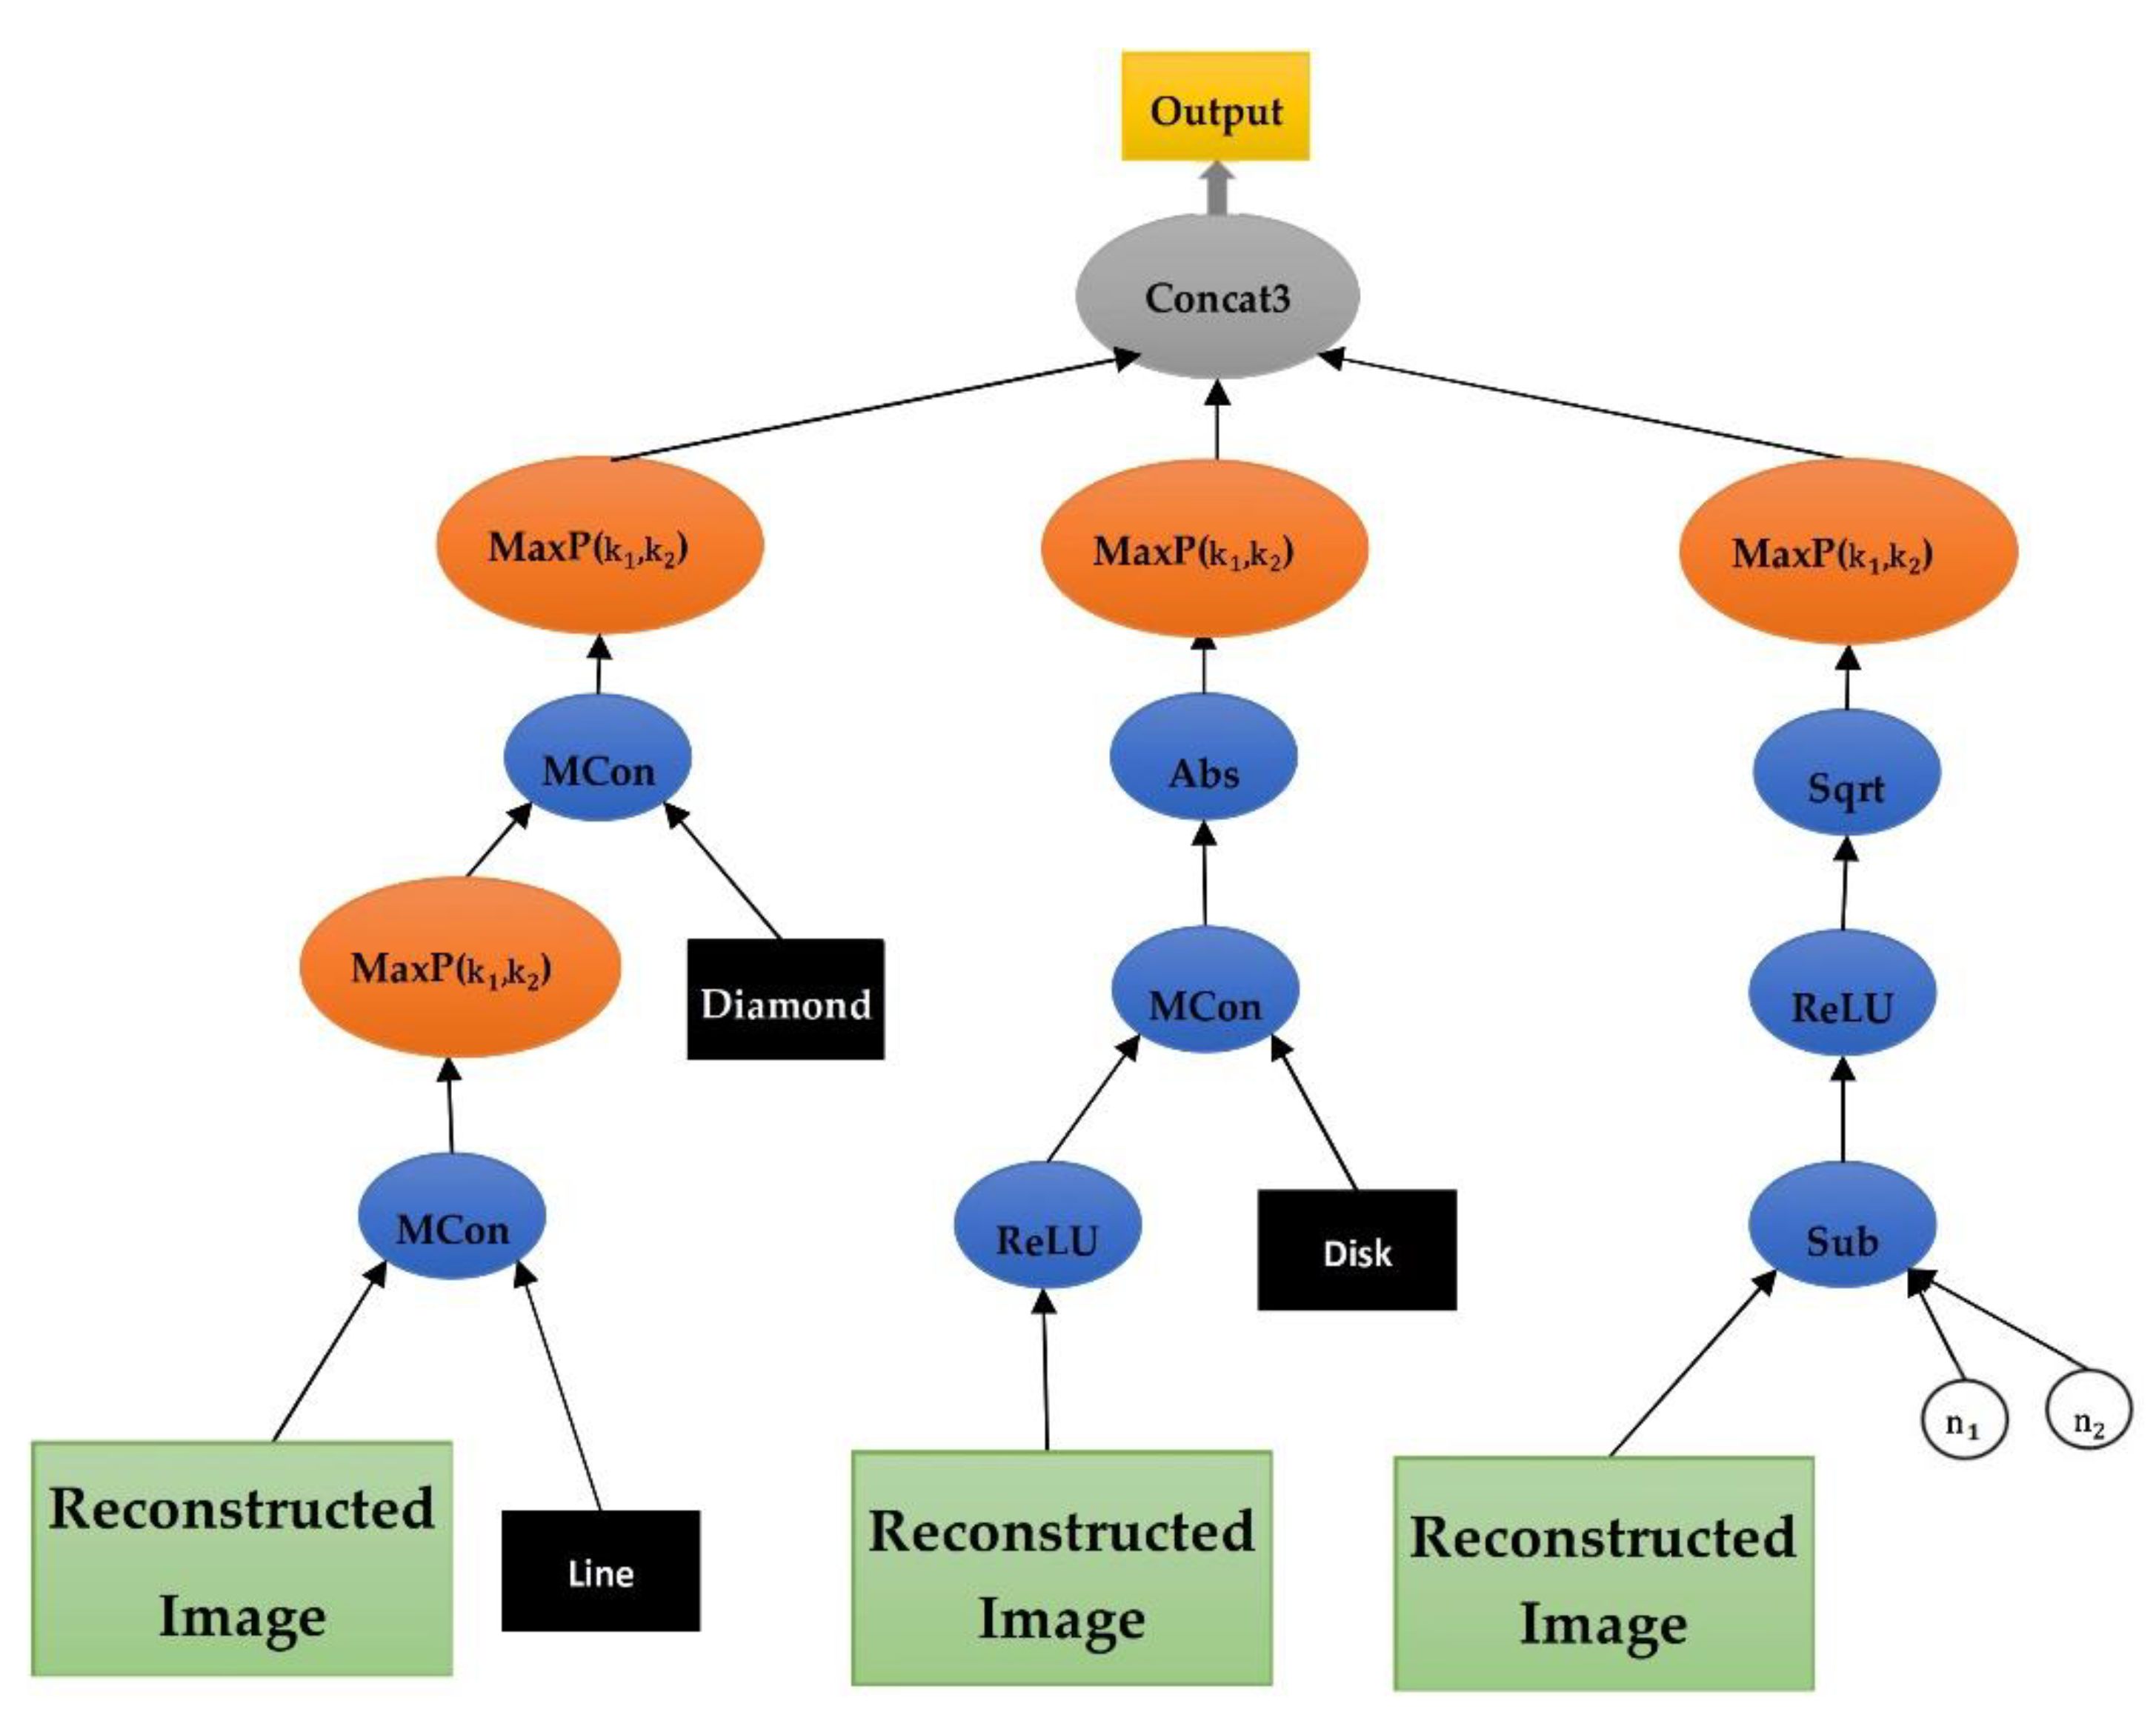
It was stated in the previous chapter that the gene, in the sample is a mapping function in the form of a CNN tree, which is used to extract the structural features from signal. The representation of the CNN tree encoded in the gene, as well as its functions and terminals, will be explained here. The representation of the CNN model in the form of GP trees is addressed in [20]. This article used a modified version of it per [20], which utilizes the morphological convolutional functions in this tree, and it is appropriate for QRS complex analysis in the ECG signal. Figure 6 shows an instance of the CNN tree. As displayed in this figure, the surface of this tree comprises a variety of layers. There is an input layer in the leaf nodes of this tree that receives the signal as the input. Afterward, there is a morphological convolutional layer, which is normally followed by a pooling layer. In this tree, a node can be a layer of the combination of morphological convolutional/pooling. Before the root layer, there is a concatenation layer. Finally, there is the root layer, which is the output layer. In this tree, the convolution layer carries out the operation of extracting the structural features using the morphological operators, which is fully explained in the next chapter. The pooling layer is used after the convolution layer to reduce the output dimensions of the convolution. Additionally, the concatenation layer connects two input layers together. The output layer is the same as the flatten layer in the CNN, which forms the feature diagram.
Table 1 shows the set of functions used in the CNN tree. First, the functions used to change the numerical space of the features include convolution (Conv), square root (SQRT), addition (ADD), rectified linear unit (ReLU), subtraction (Sub), and absolute (Abs), among which Conv is the most important function. This function is responsible for applying the morphological operators to the input ECG signals. On account of their special geometrical characteristics, the morphological functions, such as dilation and erosion, are capable of perfectly analyzing the complexities of ECG signals, including QRS complex. The morphological operators, such as erosion and dilation, are beneficial for analyzing the shape-oriented signals due to their theoretical framework and lower computational complexity [21,22]. The morphological operators, i.e., erosion and dilation, are the restricted form of counter-harmonic mean morphology [23].
If is the input signal (), shows the coordinates of an entry inside it. in Equations (2) and (3) is the counter-harmonic mean morphology filter that is expanded as follows.
The ∗ equation indicates the convolution operations, and shows the kernel function. The convolution operations are formulated in the Conv function as follows using the counter-harmonic mean morphology filter.
The types of the operations of this function are determined with respect to the amount considered for , ( linear, pseudoerosion, pseudodilation).
The Sub and Add functions carry out the weight addition and subtraction operations of two signals based on the weights of and . Two input ECG signals might have different measurements. Thus, the ECG signal will be cut using the aforementioned function to obtain two ECG signals of the same size. The Sqrt, ReLU, and Abs functions are used to change the amount of ECG signal and change the numerical space of the respective sample. In the new networks, the ReLU is preferred over the activating Sigmoid function for hidden layers for two reasons.
First, it is simple and easy to use. Second, it does not cause a local minimum problem. In this function, in the case the input amount is less than zero, the output will be the same as the input, and in the case the input is less than or equal to zero, then the output will be zero. The ReLU function has a fixed derivative for all inputs greater than zero. This fixed derivative accelerates the network’s learning. The Concat1, Concat2, Concat3, and Concat4 functions are used in the concatenation layer, which receives several ECG signals as input and displays them as a diagram in the output. The MaxP function performs a downsampling operation on the ECG input signal. This function can reduce the dimensions of the received ECG signal.
Table 2 shows the list of the terminals and the range of the authorized amounts used for them in the nodes of the leaves of the CNN tree. The ECG input signal is displayed through the measurement of . The , , and terminals show the convolution filter and the second input of Conv. Taking into account that the used morphological filter is a matrix in the shapes of a diamond, disk, line, rectangle, square and are added to the Sub and Add functions as inputs, and their amounts range between 0.000 to 1.000. and are the same size as the MaxP kernel functions. Their amounts will evolve randomly and during execution of the GP algorithm.
4. Results
All implementations and evaluations were performed on a PC with Microsoft Windows 10 OS, Intel i7-9750H processor, 64 GB of RAM, and Nvidia RTX 2060 GDDR6 SLI GPU with 6 GB memory. Besides that, the model’s weight parameters were trained and adjusted by the Adam optimizer. For the experiments, all the networks trained 200 epochs, the initial learning rate was set to 1 × 10⁻³ for the first half and then multiplied by 0.1 per quarter [25].
4.1. Results Analysis Method
A confusion matrix is first determined for test samples to analyze the results. Table 3 demonstrates how to form the confusion matrix for arrhythmia with “true” and “predicted” labels (). The combination of eight “true” and “predicted” labels will yield an 8 ∗ 8 confusion matrix. Table 3 reports the details regarding the layout of these sublabels of arrhythmia. Based on the resultant confusion matrix, four evaluation criteria (i.e., , , , and ) are employed to evaluate classification models. The total accuracy () indicates the performance of the classification model for all subclasses in a specific fold. This criterion is calculated by dividing the number of correctly classified samples on all samples. It is easily obtained from the confusion matrix by adding the main diagonal to the total samples of the matrix in the following way. In addition to the criterion that evaluates all samples of the model in a general outlook, some criteria are considered to analyze the model performance in a class-oriented way. Particularly, these criteria analyze the model performance for the classification of samples in a class cl as opposed to the other classes. This criterion converts the classification from eight classes to a binary classification technique with two states in which the model operates correctly and two other states in which the model operates wrongly. The two correct states are called TP and TN, whereas the two wrong states are called FP and FN. In this case, “positive” indicates that a sample belongs to the current class (cl), whereas “negative” indicates that a sample belongs to the other classes. Equations (6)–(9) represent the formula-based definitions of these criteria. In these equations, , and . These definitions can be employed to formulate three evaluation criteria of the model in a class-oriented way.
4.2. Evaluating the Proposed Method through 12 Leads
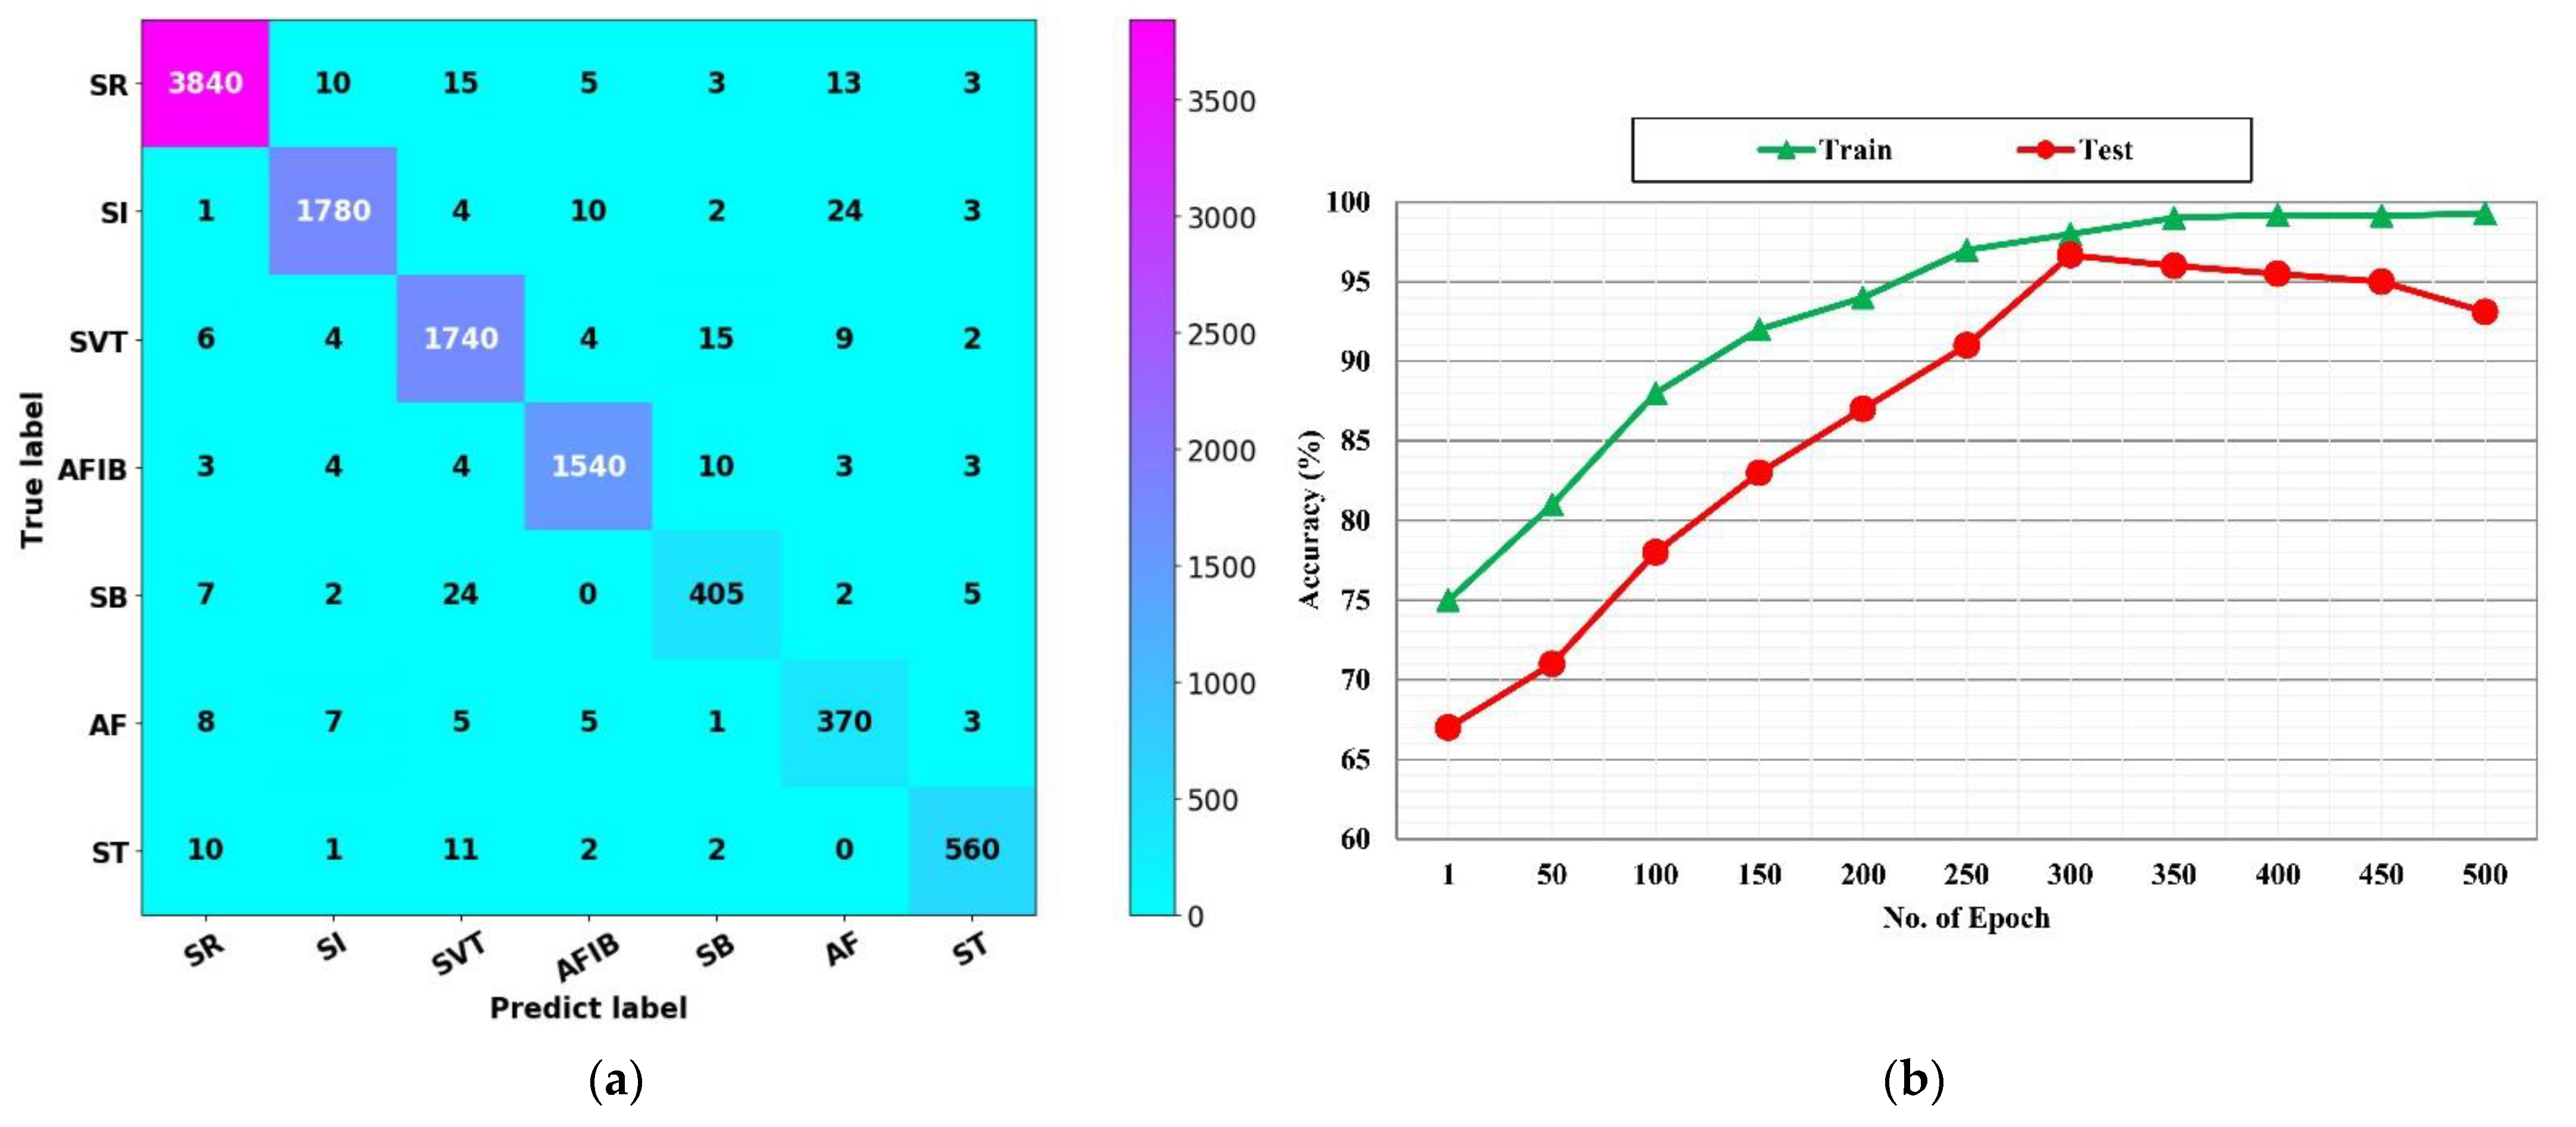
This subsection presents a thorough evaluation of the proposed fusion algorithm that fuses the data of leads through CNN trees. For this purpose, the proposed method was used through 12-ECG leads to diagnose various arrhythmia in the signals of all 12-ECG leads in the Chapman dataset. Table 4 reports the results of this test for each class separately. In these tests, the classification model was trained with all 12 leads: lead I, lead II, lead III, lead aVR, lead aVL, lead aVF, lead V1, lead V2, lead V3, lead V4, lead V5, lead V6. According to Table 4, the proposed method yielded , , , and on average for seven classes of arrythmia. According to Table 4, it can be concluded that extracting functional data from ECG leads can be very useful and efficient in diagnosing arrythmias. The quality of the proposed method can be examined in the computational overload of its algorithm, where merely the correlation between the leads is used in the proposed method that includes a smaller data volume than the raw signal. In fact, their functional data were used simply as a number calculated through correlation and features of the structure extracted from the CNN tree. Figure 7a,b depict the confusion matrix and convergence diagram of the proposed fusion algorithm, respectively. Generally, the confusion matrix indicates that the proposed fusion algorithm had acceptable levels of dispersion for all classes and did not focus only on one class of arrythmia.
It prevents the overfitting of the classification model. In this matrix, classification mistakes are observed among the classes of arrhythmia, which do not cause any medical problems. Figure 7b shows the convergence diagram of the fusion algorithm of the proposed method; the proposed method has a proper convergence for classifications of various arrhythmia samples in the Chapman dataset. Even the convergence rate is improved in comparison to Figure 7b, and it has rapidly obtained convergence.
The Table 5 shows the execution duration of the proposed method during the training and testing phases. Table 5 demonstrates that the training section of the proposed method had an execution duration of 15 min and 10 s. This time has no effect on the process of executing the proposed method since the training phase is offline, which is crucial during the development of the system. However, the most important time is the duration of the testing. Accordingly, Table 5 shows that the execution duration of the proposed method is 31 s. It signifies that the proposed method can diagnose arrhythmia in a split second.
4.3. Comparing the Proposed Fusion Algorithm with the Other Deep-Learning Methods
This subsection draws a comparison between the proposed fusion algorithm and the other state-of-the-art methods based on deep-learning models. First, Table 6 compares the proposed fusion algorithm with the methods in which the inputs are based on the single-lead ECG signals. The details include the number of patients, the number of ECG records, the quantities of classes and rhythms diagnosed, and the methods used. The performance results of the previous methods are reported with respect to certain criteria, such as accuracy and F1-score. Various deep-learning models, such as CNN, LSTM, and RNN, were used in these methods. Conventionally, a wide variety of these methods were evaluated on MIT-BIH Arrhythmia belonging to PhysioNet. For instance, a deep CNN model was used in [26] to classify 12 rhythms. Batch normalization and data augmentation steps were used in this model. The results of this study reported F1: 83% for 53,549 patients. In [27], a deep-learning model was used with the standard U-Net architecture to classify five different types of arrhythmias in MIT-BIH Arrhythmia. In this paper, the accuracy was reported as 97.32% for the classification of records collected from 47 patients. In [28], the same dataset was used with a CNN model for data normalization. The CNN model had five convolutional layers, three pooling layers, and one fully connected layer. According to the evaluation results, ACC was reported as 98.54% on 47 patients in MIT-BIH Arrhythmia. Recently, a hybrid CNN+LSTM model was introduced in [29] to classify ChapmanECG through single-lead ECG signals. In this method, a CNN model was adopted to generate deep spatial features from raw ECG signals. The CNN output was then given to the LSTM model to generate deep temporal features. According to the evaluation results, ACC was reported as 92.24% for 10,436 patients.
In this paper, a fusion algorithm was proposed to classify single-lead ECG signals. Its performance was then evaluated on the ChapmanECG dataset. According to Table 6, ACC was reported as 97.60% by the proposed fusion algorithm for the records of 10,646 patients. The proposed fusion algorithm used a large number of records for model development. The fusion algorithm yielded a further accuracy of 5.36% compared to the method proposed in [29] on ChapmanECG. Moreover, the same records were used in the training and test datasets in most of the previous studies, which reduced the universality of methods and attenuated their performance in response to unseen data. This problem was considered in the method proposed in this paper.
5. Conclusions
This paper proposed a novel method for fusing the data of 12-lead ECG signals to diagnose heart problems. In the first phase of the proposed method, the time-frequency transform was employed to fuse the functional data of leads and extract the frequency data of ECG signals in 12 leads. After that, their dependence was evaluated through the correlation analysis. In the second phase, a structural-learning method was adopted to extract the structural data from these 12 leads. Moreover, deep CNN models were coded in this phase through genetic programming. These trees are responsible for learning deep structural features from functional data extracted from 12 leads. These trees are upgraded through the execution of the GP algorithm to extract the optimal features. These two phases were used together to fuse the leads of ECG signals to diagnose various heart problems. According to the test results on ChapmanECG, including the signals of 10,646 patients, the proposed method was efficient in diagnosing heart problems. It also outperformed the state-of-the-art methods. Lack of dependence on the raw ECG signal in the proposed method is quite crucial, which demonstrated itself in the future and upon employing the proposed method and is one of the implications of the proposed method. Increasing the level of security is one of its significant features since, in the proposed method, merely a trajectory of the image is created, and the raw signal is not required in the communications. Finally, due to the computational complexity of the genetic algorithm, in the future we want to reduce the number of features extracted by using optimization algorithms [44,45,46].
Author Contributions
Conceptualization, M.N.M. and F.A.-M.; methodology, F.A.-M.;software, M.N.M.; validation, M.N.M., F.A.-M. and S.K.; formal analysis, F.A.-M.; investigation, M.N.M.; resources, M.N.M.; data curation, M.N.M.; writing—original draft preparation, M.N.M.; writing—review and editing, F.A.-M. and S.K.; visualization, M.N.M.; supervision, F.A.-M. and S.K.; project administration, F.A.-M.. All authors have read and agreed to the published version of the manuscript.
Funding
This research received no external funding.
Institutional Review Board Statement
Not applicable.
Informed Consent Statement
Not applicable.
Data Availability Statement
Not applicable.
Conflicts of Interest
The authors declare no conflict of interest.
References
- Mozaffarian, D.; Benjamin, E.J.; Go, A.S.; Arnett, D.K.; Blaha, M.J.; Cushman, M.; Das, S.R.; de Ferranti, S.; Després, J.P.; Fullerton, H.J.; et al. Executive Summary: Heart Disease and Stroke Statistics—2016 Update: A Report from the American Heart Association. Circulation 2016, 133, 447–454. [Google Scholar] [CrossRef]
- Sansone, M.; Fusco, R.; Pepino, A.; Sansone, C. Electrocardiogram pattern recognition and analysis based on artificial neural networks and support vector machines: A review. J. Healthc. Eng. 2013, 4, 465–504. [Google Scholar] [CrossRef] [Green Version]
- Kusumoto, F. ECG Interpretation: From Pathophysiology to Clinical Application; Springer Nature: Berlin, Germany, 2020. [Google Scholar]
- Sepahvand, M.; Abdali-Mohammadi, F. A novel multi-lead ECG personal recognition based on signals functional and structural dependencies using time-frequency representation and evolutionary morphological CNN. Biomed. Signal Process. Control 2021, 68, 102766. [Google Scholar] [CrossRef]
- Tutuko, B.; Rachmatullah, M.N.; Darmawahyuni, A.; Nurmaini, S.; Tondas, A.E.; Passarella, R.; Partan, R.U.; Rifai, A.; Sapitri, A.I.; Firdaus, F. Short Single-Lead ECG Signal Delineation-Based Deep Learning: Implementation in Automatic Atrial Fibrillation Identification. Sensors 2022, 22, 2329. [Google Scholar] [CrossRef]
- Tadesse, G.A.; Javed, H.; Weldemariam, K.; Liu, Y.; Liu, J.; Chen, J.; Zhu, T. DeepMI: Deep multi-lead ECG fusion for identifying myocardial infarction and its occurrence-time. Artif. Intell. Med. 2021, 121, 102192. [Google Scholar] [CrossRef] [PubMed]
- Ge, Z.; Jiang, X.; Tong, Z.; Feng, P.; Zhou, B.; Xu, M.; Wang, Z.; Pang, Y. Multi-label correlation guided feature fusion network for abnormal ECG diagnosis. Knowl.-Based Syst. 2021, 233, 107508. [Google Scholar] [CrossRef]
- Ahmad, Z.; Tabassum, A.; Guan, L.; Khan, N.M. ECG heartbeat classification using multimodal fusion. IEEE Access 2021, 9, 100615–100626. [Google Scholar] [CrossRef]
- Ahmad, Z.; Tabassum, A.; Guan, L.; Khan, N. Ecg Heart-Beat Classification Using Multimodal Image Fusion; IEEE: Piscataway, NJ, USA, 2021. [Google Scholar]
- Vijayakumar, T.; Vinothkanna, R.; Duraipandian, M. Fusion based feature extraction analysis of ECG signal interpretation–a systematic approach. J. Artif. Intell. 2021, 3, 1–16. [Google Scholar]
- Li, H.; Boulanger, P. Structural Anomalies Detection from Electrocardiogram (ECG) with Spectrogram and Handcrafted Features. Sensors 2022, 22, 2467. [Google Scholar] [CrossRef]
- Zhang, X.; Jiang, M.; Wu, W.; de Albuquerque, V.H.C. Hybrid feature fusion for classification optimization of short ECG segment in IoT based intelligent healthcare system. Neural Comput. Appl. 2021, 1–15. [Google Scholar] [CrossRef]
- Mishra, A.; Dharahas, G.; Gite, S.; Kotecha, K.; Koundal, D.; Zaguia, A.; Kaur, M.; Lee, H.-N. ECG Data Analysis with Denoising Approach and Customized CNNs. Sensors 2022, 22, 1928. [Google Scholar] [CrossRef]
- Sepahvand, M.; Abdali-Mohammadi, F. A Novel Method for Reducing Arrhythmia Classification from 12-Lead ECG Signals to Single-Lead ECG with Minimal Loss of Accuracy through Teacher-Student Knowledge Distillation. Inf. Sci. 2022, 593, 64–77. [Google Scholar] [CrossRef]
- Li, W.; Tang, Y.M.; Yu, K.M.; To, S. SLC-GAN: An Automated Myocardial Infarction Detection Model Based on Generative Adversarial Networks and Convolutional Neural Networks with Single-Lead Electrocardiogram Synthesis. Inf. Sci. 2022, 589, 738–750. [Google Scholar] [CrossRef]
- Sepahvand, M.; Abdali-Mohammadi, F. A Deep Learning-Based Compression Algorithm for 9-DOF Inertial Measurement Unit Signals Along with an Error Compensating Mechanism. IEEE Sens. J. 2019, 19, 632–640. [Google Scholar] [CrossRef]
- Sepahvand, M.; Abdali-Mohammadi, F.; Taherkordi, A. Teacher–student knowledge distillation based on decomposed deep feature representation for intelligent mobile applications. Expert Syst. Appl. 2022, 202, 117474. [Google Scholar] [CrossRef]
- Sepahvand, M.; Abdali-Mohammadi, F. A novel representation in genetic programming for ensemble classification of human motions based on inertial signals. Expert Syst. Appl. 2021, 185, 115624. [Google Scholar] [CrossRef]
- Zheng, J.; Zhang, J.; Danioko, S.; Yao, H.; Guo, H.; Rakovski, C. A 12-lead electrocardiogram database for arrhythmia research covering more than 10,000 patients. Sci. Data 2020, 7, 48. [Google Scholar] [CrossRef] [Green Version]
- Evans, B.; Al-Sahaf, H.; Xue, B.; Zhang, M. Evolutionary Deep Learning: A Genetic Programming Approach to Image Classification. In Proceedings of the 2018 IEEE Congress on Evolutionary Computation (CEC), Rio de Janeiro, Brazil, 8–13 July 2018. [Google Scholar]
- Goshvarpour, A.; Goshvarpour, A. Human identification using a new matching Pursuit-based feature set of ECG. Comput. Methods Programs Biomed. 2019, 172, 87–94. [Google Scholar] [CrossRef]
- Sepahvand, M.; Abdali-Mohammadi, F. A New Learning-based Spatiotemporal Descriptor for Online Symbol Recognition. J. AI Data Min. 2022, 10, 75–86. [Google Scholar]
- Mellouli, D.; Hamdani, T.M.; Sanchez-Medina, J.J.; Ben Ayed, M.; Alimi, A.M. Morphological Convolutional Neural Network Architecture for Digit Recognition. IEEE Trans. Neural Netw. Learn. Syst. 2019, 30, 2876–2885. [Google Scholar] [CrossRef]
- Sepahvand, M.; Abdali-Mohammadi, F.; Mardukhi, F. Evolutionary Metric-Learning-Based Recognition Algorithm for Online Isolated Persian/Arabic Characters, Reconstructed Using Inertial Pen Signals. IEEE Trans. Cybern. 2017, 47, 2872–2884. [Google Scholar] [CrossRef]
- Sepahvand, M.; Abdali-Mohammadi, F. Overcoming limitation of dissociation between MD and MI classifications of breast cancer histopathological images through a novel decomposed feature-based knowledge distillation method. Comput. Biol. Med. 2022, 145, 105413. [Google Scholar] [CrossRef]
- Fujita, H.; Cimr, D. Computer Aided detection for fibrillations and flutters using deep convolutional neural network. Inf. Sci. 2019, 486, 231–239. [Google Scholar] [CrossRef]
- Oh, S.L.; Ng, E.Y.; San Tan, R.; Acharya, U.R. Automated beat-wise arrhythmia diagnosis using modified U-net on extended electrocardiographic recordings with heterogeneous arrhythmia types. Comput. Biol. Med. 2019, 105, 92–101. [Google Scholar] [CrossRef]
- Oh, S.L.; Ng, E.Y.; San Tan, R.; Acharya, U.R. Automated diagnosis of arrhythmia using combination of CNN and LSTM techniques with variable length heart beats. Comput. Biol. Med. 2018, 102, 278–287. [Google Scholar] [CrossRef]
- Yildirim, O.; Talo, M.; Ciaccio, E.J.; Tan, R.S.; Acharya, U.R. Accurate deep neural network model to detect cardiac arrhythmia on more than 10,000 individual subject ECG records. Comput. Methods Programs Biomed. 2020, 197, 105740. [Google Scholar] [CrossRef]
- Acharya, U.R.; Oh, S.L.; Hagiwara, Y.; Tan, J.H.; Adam, M.; Gertych, A.; San Tan, R. A deep convolutional neural network model to classify heartbeats. Comput. Biol. Med. 2017, 89, 389–396. [Google Scholar] [CrossRef]
- Xu, S.S.; Mak, M.W.; Cheung, C.C. Towards End-to-End ECG Classification with Raw Signal Extraction and Deep Neural Networks. IEEE J. Biomed. Health Inform. 2019, 23, 1574–1584. [Google Scholar] [CrossRef]
- Gao, J.; Zhang, H.; Lu, P.; Wang, Z. An effective LSTM recurrent network to detect arrhythmia on imbalanced ECG dataset. J. Healthc. Eng. 2019, 2019, 6320651. [Google Scholar] [CrossRef] [Green Version]
- Hannun, A.Y.; Rajpurkar, P.; Haghpanahi, M.; Tison, G.H.; Bourn, C.; Turakhia, M.P.; Ng, A.Y. Cardiologist-level arrhythmia detection and classification in ambulatory electrocardiograms using a deep neural network. Nat. Med. 2019, 25, 65–69. [Google Scholar] [CrossRef]
- Yıldırım, Ö.; Pławiak, P.; Tan, R.S.; Acharya, U.R. Arrhythmia detection using deep convolutional neural network with long duration ECG signals. Comput. Biol. Med. 2018, 102, 411–420. [Google Scholar] [CrossRef] [PubMed]
- Shaker, A.M.; Tantawi, M.; Shedeed, H.A.; Tolba, M.F. Generalization of Convolutional Neural Networks for ECG Classification Using Generative Adversarial Networks. IEEE Access 2020, 8, 35592–35605. [Google Scholar] [CrossRef]
- Xiong, Z.; Nash, M.P.; Cheng, E.; Fedorov, V.V.; Stiles, M.K.; Zhao, J. ECG signal classification for the detection of cardiac arrhythmias using a convolutional recurrent neural network. Physiol. Meas. 2018, 39, 094006. [Google Scholar] [CrossRef] [PubMed]
- Mousavi, S.; Fotoohinasab, A.; Afghah, F. Single-modal and multi-modal false arrhythmia alarm reduction using attention-based convolutional and recurrent neural networks. PLoS ONE 2020, 15, e0226990. [Google Scholar] [CrossRef]
- Wu, Q.; Sun, Y.; Yan, H.; Wu, X. ECG signal classification with binarized convolutional neural network. Comput. Biol. Med. 2020, 121, 103800. [Google Scholar] [CrossRef]
- Salem, M.; Taheri, S.; Yuan, J. ECG Arrhythmia Classification Using Transfer Learning from 2-Dimensional Deep CNN Features. In Proceedings of the 2018 IEEE Biomedical Circuits and Systems Conference (BioCAS), Cleveland, OH, USA, 17–19 October 2018. [Google Scholar]
- Xia, Y.; Wulan, N.; Wang, K.; Zhang, H. Detecting atrial fibrillation by deep convolutional neural networks. Comput. Biol. Med. 2018, 93, 84–92. [Google Scholar] [CrossRef]
- Mehari, T.; Strodthoff, N. Self-supervised representation learning from 12-lead ECG data. Comput. Biol. Med. 2022, 141, 105114. [Google Scholar] [CrossRef]
- Rahul, J.; Sharma, L.D. Automatic cardiac arrhythmia classification based on hybrid 1-D CNN and Bi-LSTM model. Biocybern. Biomed. Eng. 2022, 42, 312–324. [Google Scholar] [CrossRef]
- Kang, J.; Wen, H. A study on several critical problems on arrhythmia detection using varying-dimensional electrocardiography. Physiol. Meas. 2022. [Google Scholar] [CrossRef]
- Sepahvand, M.; Abdali-Mohammadi, F. A Meta-heuristic Model for Human Micro Movements Recognition Based on Inertial Sensors. Tabriz J. Electr. Eng. 2019, 49, 221–234. [Google Scholar]
- Abdali-Mohammadi, F.; Bajalan, V.; Fathi, A. Toward a Fault Tolerant Architecture for Vital Medical-Based Wearable Computing. J. Med. Syst. 2015, 39, 149. [Google Scholar] [CrossRef]
- Lobabi-Mirghavami, H.; Abdali-Mohammadi, F.; Fathi, A. A Novel Grammar-Based Approach to Atrial Fibrillation Arrhythmia Detection for Pervasive Healthcare Environments. J. Comput. Secur. 2015, 2, 155–163. [Google Scholar]
Figure 1.
A sample of the signals of the Chapman ECG dataset, which has undergone noise reduction operation: (a) ECG raw signal with 3000 samples; (b) spectrogram of the raw signal; (c) smoothed ECG signal; (d) spectrogram of the smoothed signal.
Figure 1.
A sample of the signals of the Chapman ECG dataset, which has undergone noise reduction operation: (a) ECG raw signal with 3000 samples; (b) spectrogram of the raw signal; (c) smoothed ECG signal; (d) spectrogram of the smoothed signal.

Figure 2.
The proposed model for 12-lead electrocardiogram signals fusion approach for heart defect detection.
Figure 2.
The proposed model for 12-lead electrocardiogram signals fusion approach for heart defect detection.

Figure 3.
Calculate cross-correlation between 12-lead ECG, (a) lead I signal, (b) lead I signal approximation, (c) lead II signal, (d) lead II signal approximation.
Figure 3.
Calculate cross-correlation between 12-lead ECG, (a) lead I signal, (b) lead I signal approximation, (c) lead II signal, (d) lead II signal approximation.

Figure 4.
Cross-correlation output between the approximation signal of the leads I and II of the ECG signals, (a) lead I and II signals, (b) cross correlation between lead I and II.
Figure 4.
Cross-correlation output between the approximation signal of the leads I and II of the ECG signals, (a) lead I and II signals, (b) cross correlation between lead I and II.

Figure 5.
ECG trajectories in the frequency domain for 12-lead ECG signal, (a) the graphic display of the calculation of correlation between lead I and lead III, (b) the obtained trajectory of the spectrogram of lead I and lead III.
Figure 5.
ECG trajectories in the frequency domain for 12-lead ECG signal, (a) the graphic display of the calculation of correlation between lead I and lead III, (b) the obtained trajectory of the spectrogram of lead I and lead III.

Figure 6.
An instance of CNN tree: the green nodes are the input layers, the blue nodes are the morphological convolutional layers, the red nodes are the pooling layers, the black nodes are the concatenation layers, and the gray node is the output layer.
Figure 6.
An instance of CNN tree: the green nodes are the input layers, the blue nodes are the morphological convolutional layers, the red nodes are the pooling layers, the black nodes are the concatenation layers, and the gray node is the output layer.

Figure 7.
The confusion matrix of the proposed fusion algorithm with all ECG 12 leads and its convergence rate curve, (a) confusion matrix, (b) convergence rate curve.
Figure 7.
The confusion matrix of the proposed fusion algorithm with all ECG 12 leads and its convergence rate curve, (a) confusion matrix, (b) convergence rate curve.


Table 1.
List of the CNN Tree Functions.
| Description | Method |
|---|---|
| ) | |
| ) | |
| matrix | ) |
| matrix | ) |
| matrix | ) |
| ) | |
| matrices together as a diagram | ) |
| matrices together as a diagram | ) |
| matrices together as a diagram | ) |
Table 2.
List of the CNN Tree Terminals.
| Description | Value Range | Terminal |
|---|---|---|
| The input matrix includes functional relativity information | [−1,1] | |
| in MConv function | {0,1} [24] | |
| in MConv function | {0,1} | |
| in MConv function | {0,1} | |
| Random numbers that are the inputs of Add and Sub functions. | [0.000,1.000] | |
| The kernel measurement of MaxP function | {2,4} |
Table 3.
The Confusion Matrix for Arrhythmia classes in Chapman Dataset.
| Predicted Label | ||||||||
|---|---|---|---|---|---|---|---|---|
| AF | SB | SVT | ST | SR | AFIB | SI | ||
| True Label | AF | |||||||
| SB | ||||||||
| SVT | ||||||||
| ST | ||||||||
| SR | ||||||||
| AFIB | ||||||||
| SI | ||||||||
Table 4.
The Confusion Matrix for Arrhythmia classes in Chapman Dataset.
| Class Name | (%) | |||
|---|---|---|---|---|
| AF | 97.47 ± 0.5 | 97.93 ± 0.4 | 96.64 ± 0.2 | 97.25 ± 0.3 |
| SB | 97.83 ± 0.7 | 97.59 ± 0.6 | 96.26 ± 0.7 | 97.45 ± 0.7 |
| SVT | 97.58 ± 0.8 | 97.37 ± 0.6 | 96.44 ± 1.0 | 96.87 ± 1.0 |
| ST | 96.93 ± 0.0 | 97.93 ± 0.4 | 96.69 ± 0.6 | 96.36 ± 0.3 |
| SR | 97.60 ± 0.2 | 97.96 ± 1.1 | 97.69 ± 0.8 | 96.70 ± 1.0 |
| AFIB | 98.94 ± 0.7 | 96.79 ± 1.0 | 97.00 ± 1.1 | 97.56 ± 1.1 |
| SI | 96.88 ± 0.4 | 96.38 ± 0.7 | 97.47 ± 0.7 | 97.47 ± 0.7 |
| Average | 97.09 ± 0.7 | 96.88 ± 0.7 | 97.42 ± 0.7 | 97.60 ± 0.5 |
Table 5.
Proposed Method Run Time (MM:SS:MS).
| Training Phase | Validation Phase | Testing Phase | |
|---|---|---|---|
| CPU Time | 15:10:30 | 00:30:50 | 00:31:40 |
Table 6.
Comparing the proposed fusion algorithm with the other state-of-the-art methods in performance.
Table 6.
Comparing the proposed fusion algorithm with the other state-of-the-art methods in performance.
| References | #Subjects | #Records | #Rhythm | Method | Performance |
|---|---|---|---|---|---|
| Acharya et al. [30] | 47 | 109,449 | 5 Class | CNN | Acc: 94.03 |
| Xu et al. [31] | 22 | 50,977 | 5 Class | DNN | Acc: 93.10 |
| Gao et al. [32] | - | 93,371 | 8 Heartbeats | LSTM | Acc: 90.26 |
| Hannun et al. [33] | 53,549 | 91,232 | 12 Rhythm | CNN | F1: 83.00 |
| Yildirim et al. [34] | 45 | 1000 | 5 Heartbeats | CNN | Acc: 91.33 |
| Shaker et al. [35] | 44 | 102,098 | 12 Class | CNN | Acc: 94.30 |
| Oh et al. [27] | 47 | 16,499 | 5 Heartbeats | UNet | Acc: 93.10 |
| Xiong et al. [36] | 12,186 | 12,186 | 4 Class | CNN + RNN | F1: 82.00 |
| Oh et al. [28] | 170 | 150,268 | 3 Cardiac Disease | CNN + LSTM | Acc: 94.51 |
| Mousavi et al. [37] | - | 750 | 5 Rhythm | CNN + LSTM | Acc: 93.75 |
| Wu et al. [38] | - | 8528 | 4 Class | Binarized CNN | F1: 86.00 |
| Fujita et al. [26] | 47 | 109,449 | 4 Class | Normalization + CNN | Acc: 93.45 |
| Salem et al. [39] | 22 | 7000 | 4 Class | STFT + CNN | Acc: 94.23 |
| Xia et al. [40] | - | - | 2 Class | SWT + CNN | Acc: 95.63 |
| Yildirim et al. [29] | 10,436 | 10,436 | 7 Rhythm | CNN + LSTM | Acc: 92.24 |
| Mehari et al. [41] | 10,646 | 10,646 | 7 Rhythm | Single Classifier | Acc: 92.89 |
| Rahul et al. [42] | 10,646 | 10,646 | 7 Rhythm | 1-D CNN | Acc: 94.01 |
| Kang et al. [43] | 10,646 | 10,646 | 7 Rhythm | RNN | Acc: 96.21 |
| Proposed Method | 10,646 | 10,646 | 7 Rhythm | 12 Lead Fusion + CNN Trees | Acc: 97.60 |
Publisher’s Note: MDPI stays neutral with regard to jurisdictional claims in published maps and institutional affiliations. |
© 2022 by the authors. Licensee MDPI, Basel, Switzerland. This article is an open access article distributed under the terms and conditions of the Creative Commons Attribution (CC BY) license (https://creativecommons.org/licenses/by/4.0/).
Share and Cite
MDPI and ACS Style
Meqdad, M.N.; Abdali-Mohammadi, F.; Kadry, S. A New 12-Lead ECG Signals Fusion Method Using Evolutionary CNN Trees for Arrhythmia Detection. Mathematics 2022, 10, 1911. https://doi.org/10.3390/math10111911
AMA Style
Meqdad MN, Abdali-Mohammadi F, Kadry S. A New 12-Lead ECG Signals Fusion Method Using Evolutionary CNN Trees for Arrhythmia Detection. Mathematics. 2022; 10(11):1911. https://doi.org/10.3390/math10111911
Chicago/Turabian StyleMeqdad, Maytham N., Fardin Abdali-Mohammadi, and Seifedine Kadry. 2022. "A New 12-Lead ECG Signals Fusion Method Using Evolutionary CNN Trees for Arrhythmia Detection" Mathematics 10, no. 11: 1911. https://doi.org/10.3390/math10111911
Note that from the first issue of 2016, this journal uses article numbers instead of page numbers. See further details here.