
Erodibility of Nanocomposite-Improved Unsaturated Soil Using Genetic Programming, Artificial Neural Networks, and Evolutionary Polynomial Regression Techniques

 , , , ,
Abstract
:1. Introduction
1.1. Preamble
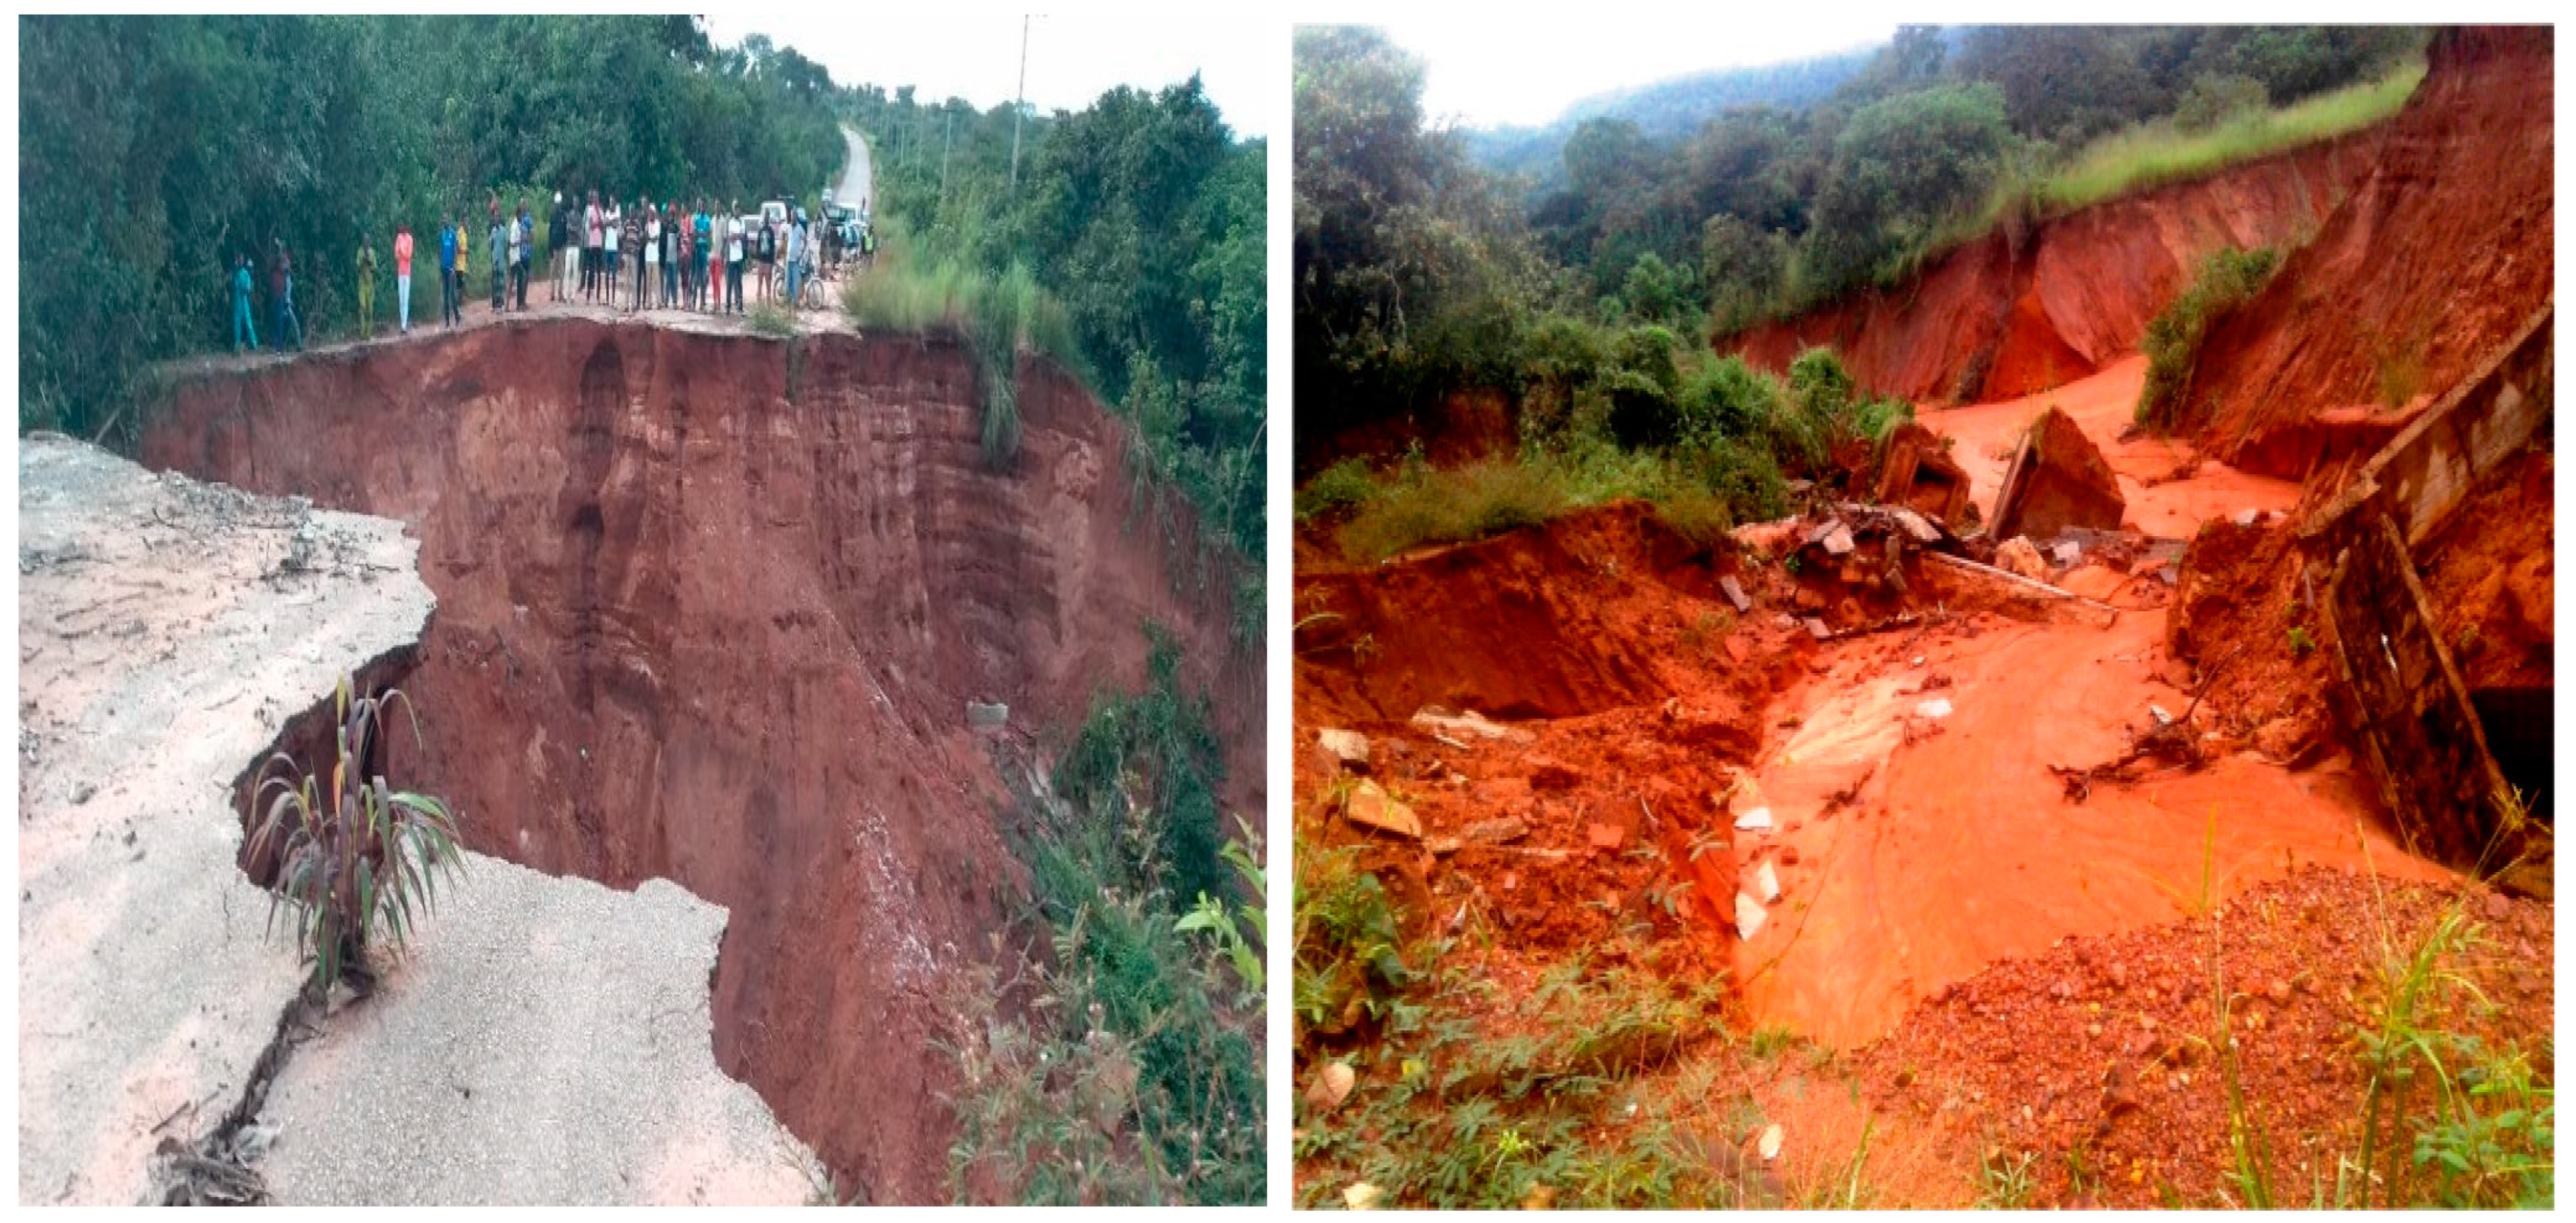
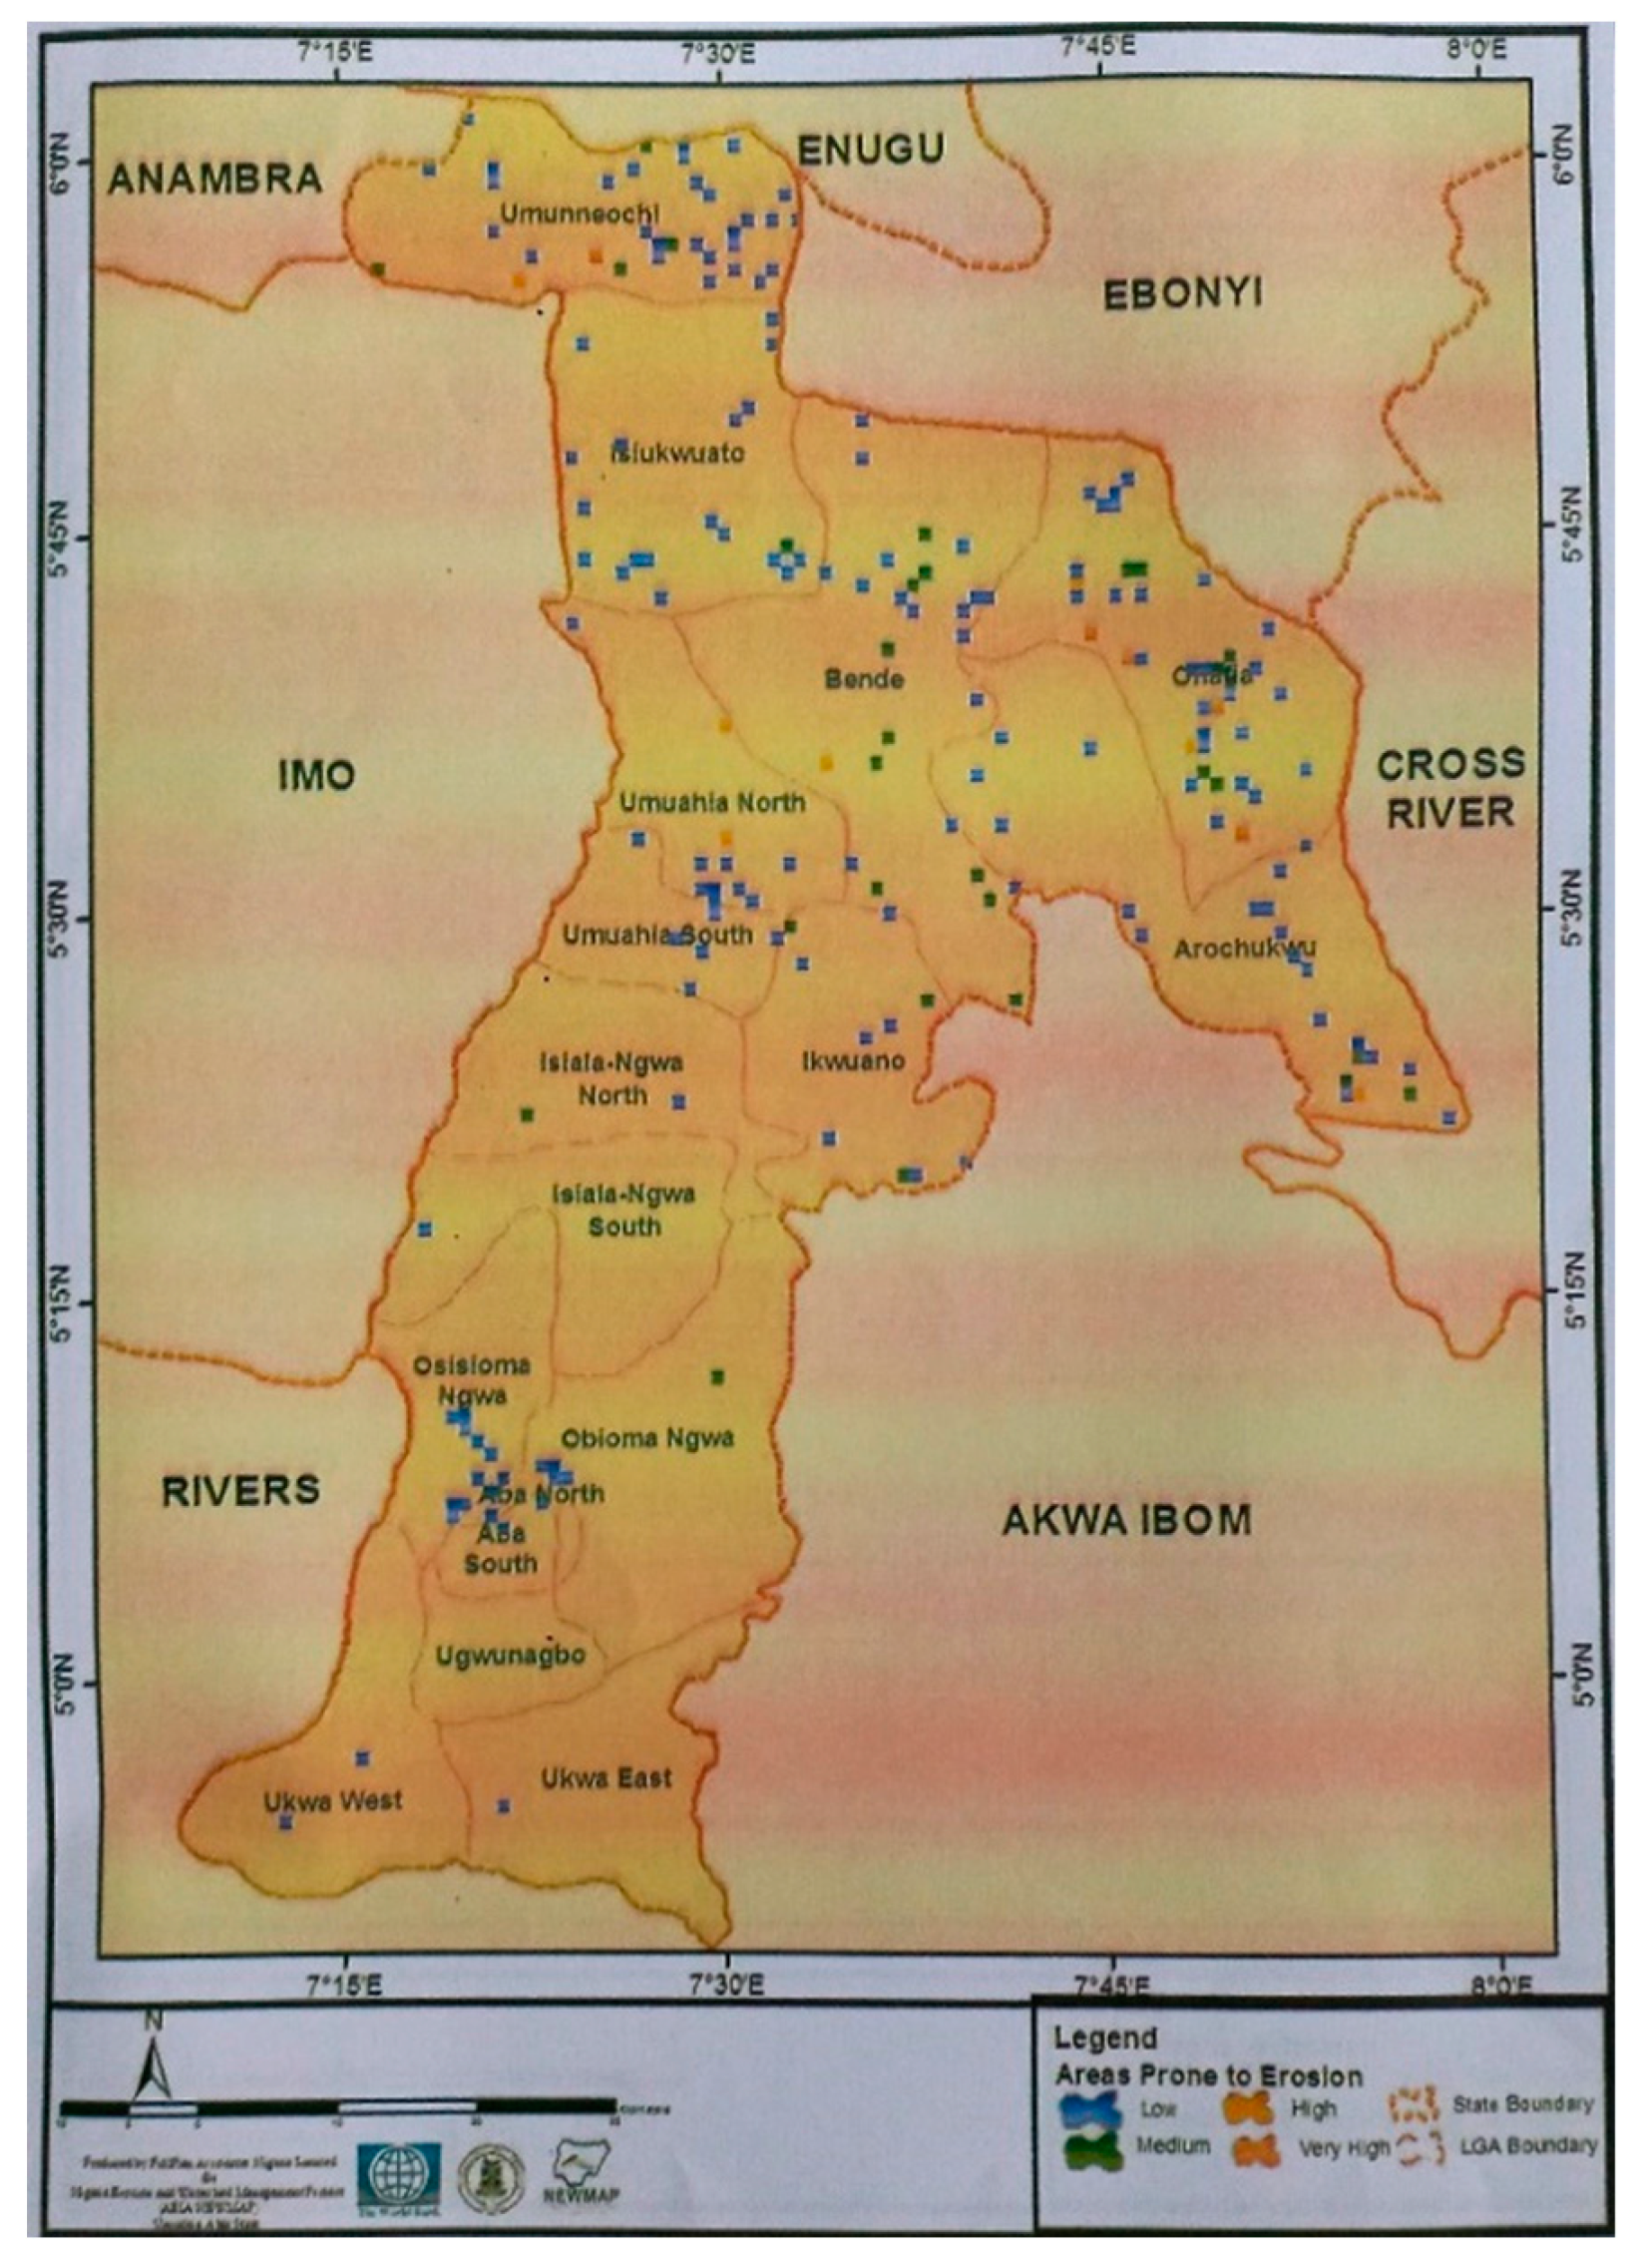
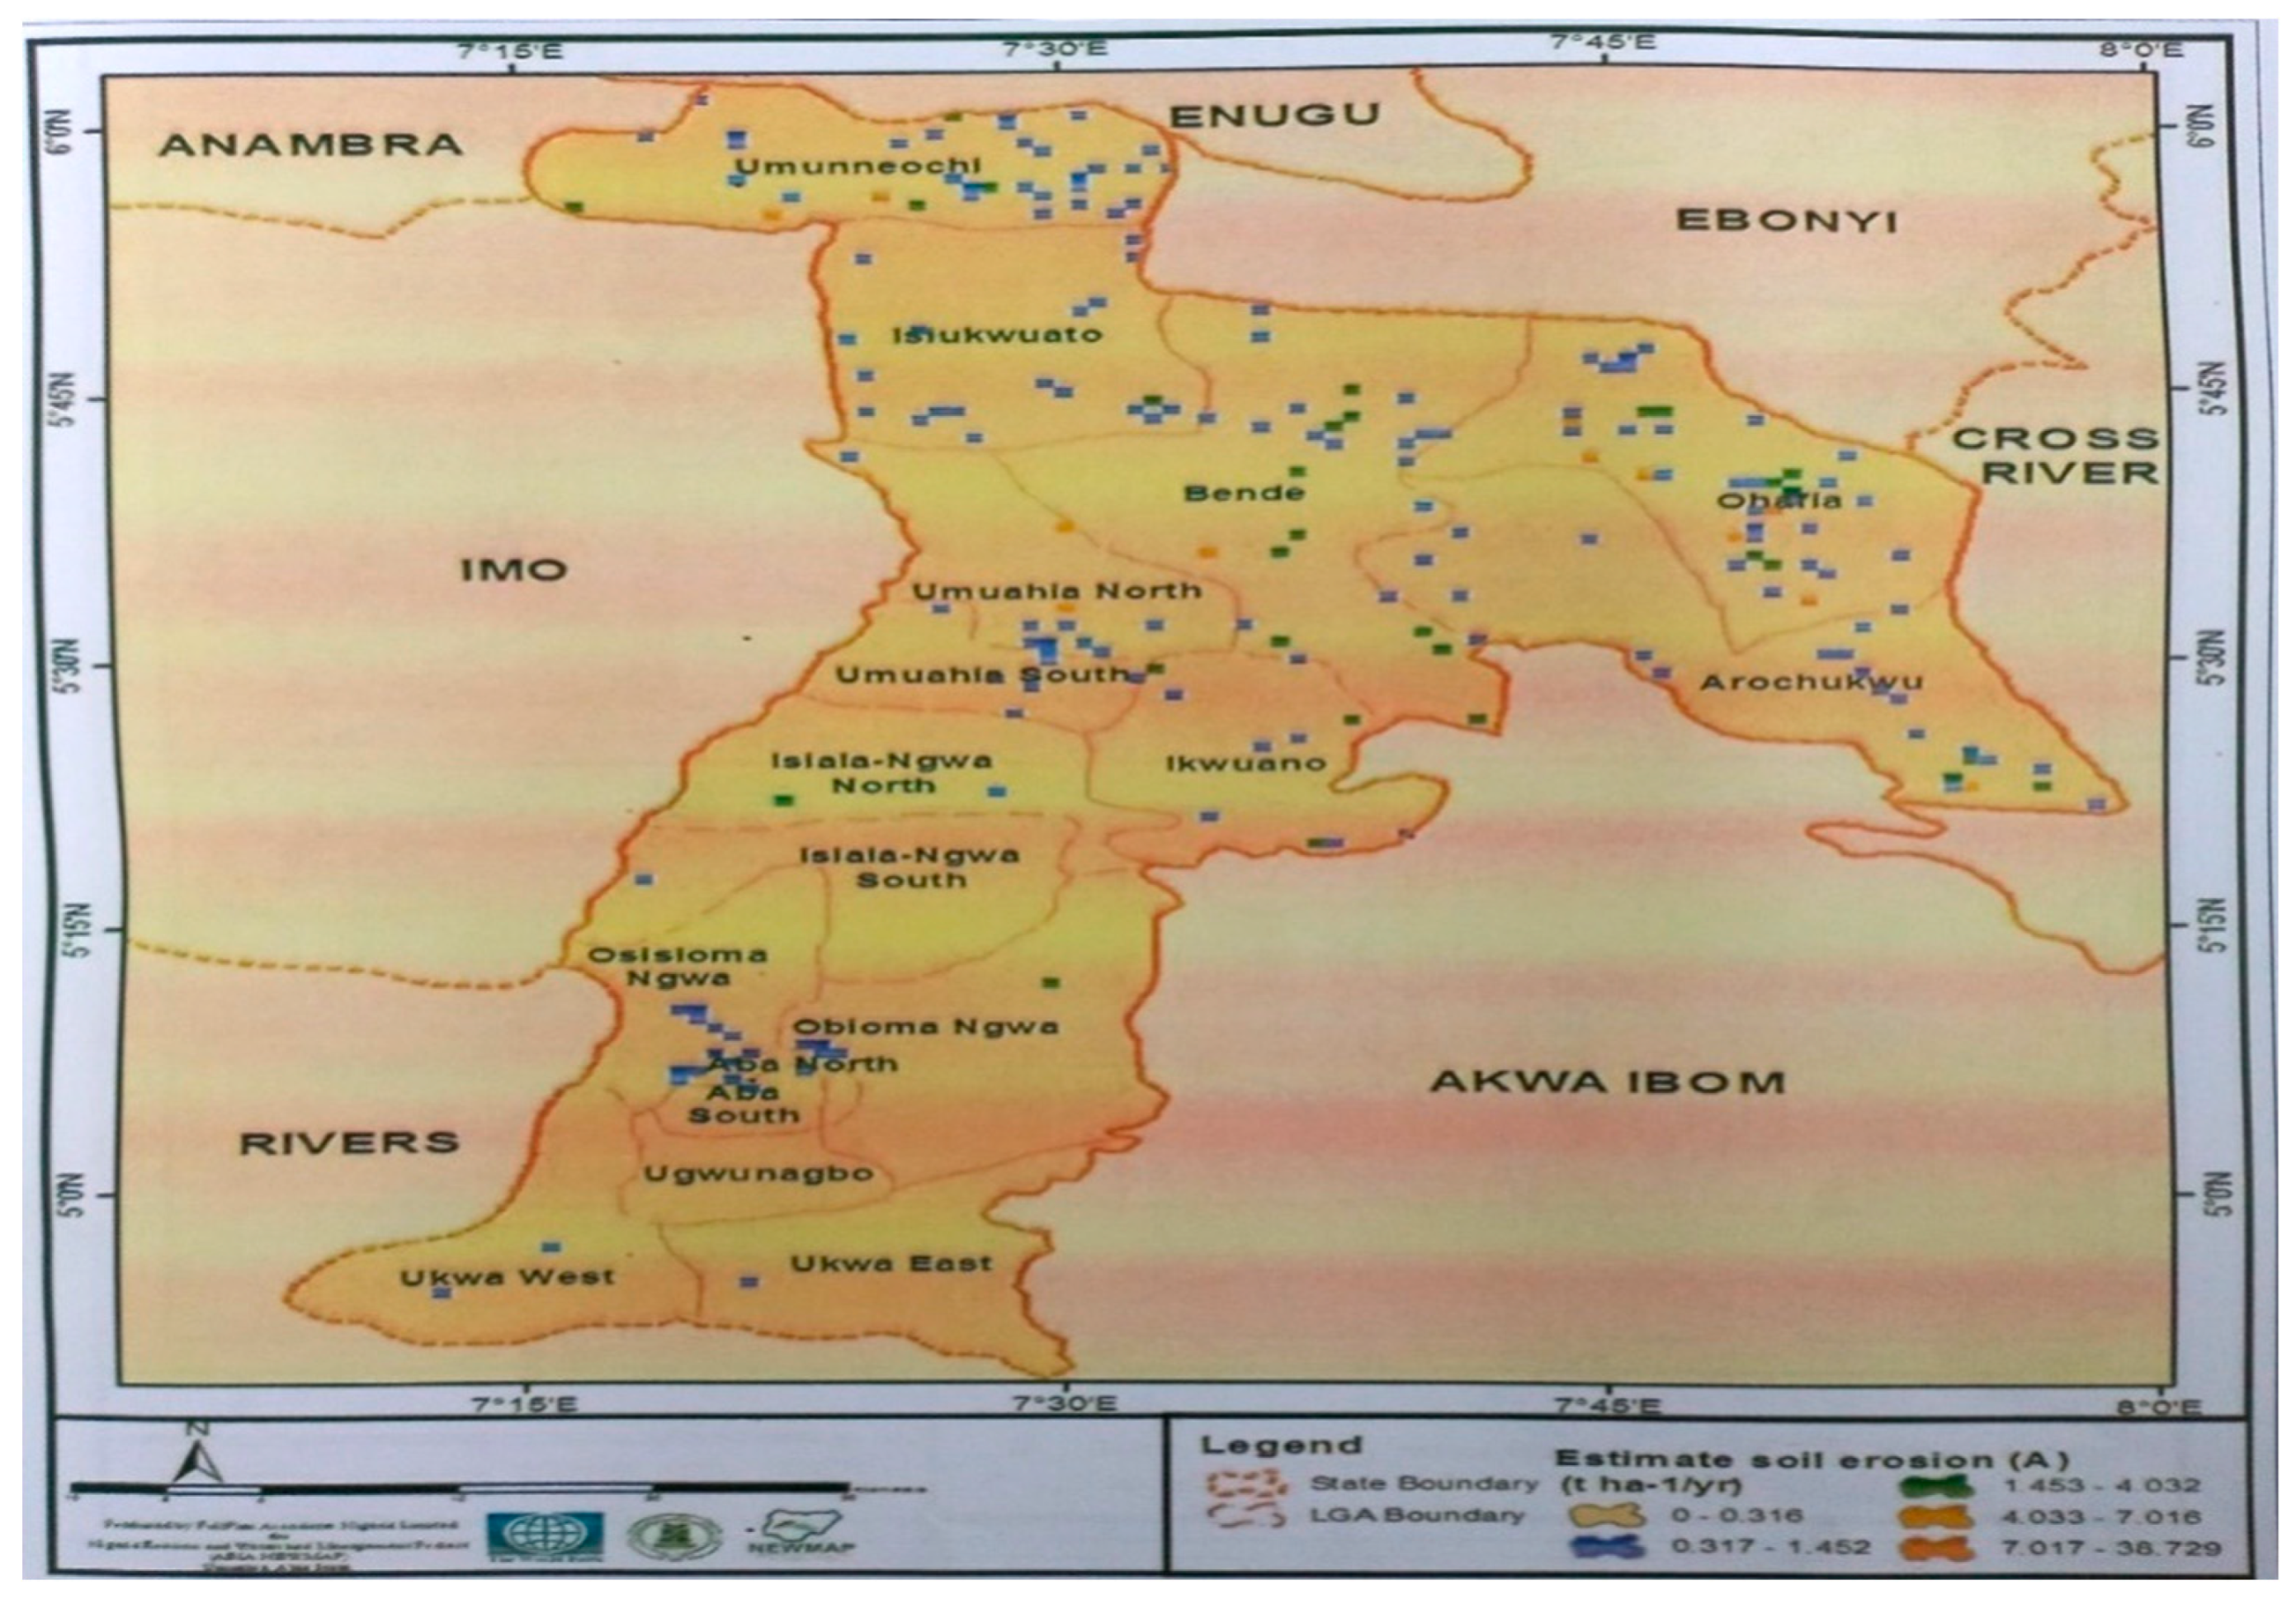
1.2. Gully Erosion Disaster in Southeast Nigeria: Efforts of NEWMAP in Mitigating Soil Erosion
1.3. Nanostructured Composites for Soil Erodibility Enhancement: Energy and Environmental Sustainability Potential of Using Green Composites and Supplementary Cementitious Materials for Soil Improvement
1.4. Evolutionary Computation Techniques for Predicting Soil Erosion and Associated Geotechnical Variables
2. Materials and Methods
2.1. Materials
2.2. Methods
2.2.1. Experimental Methods
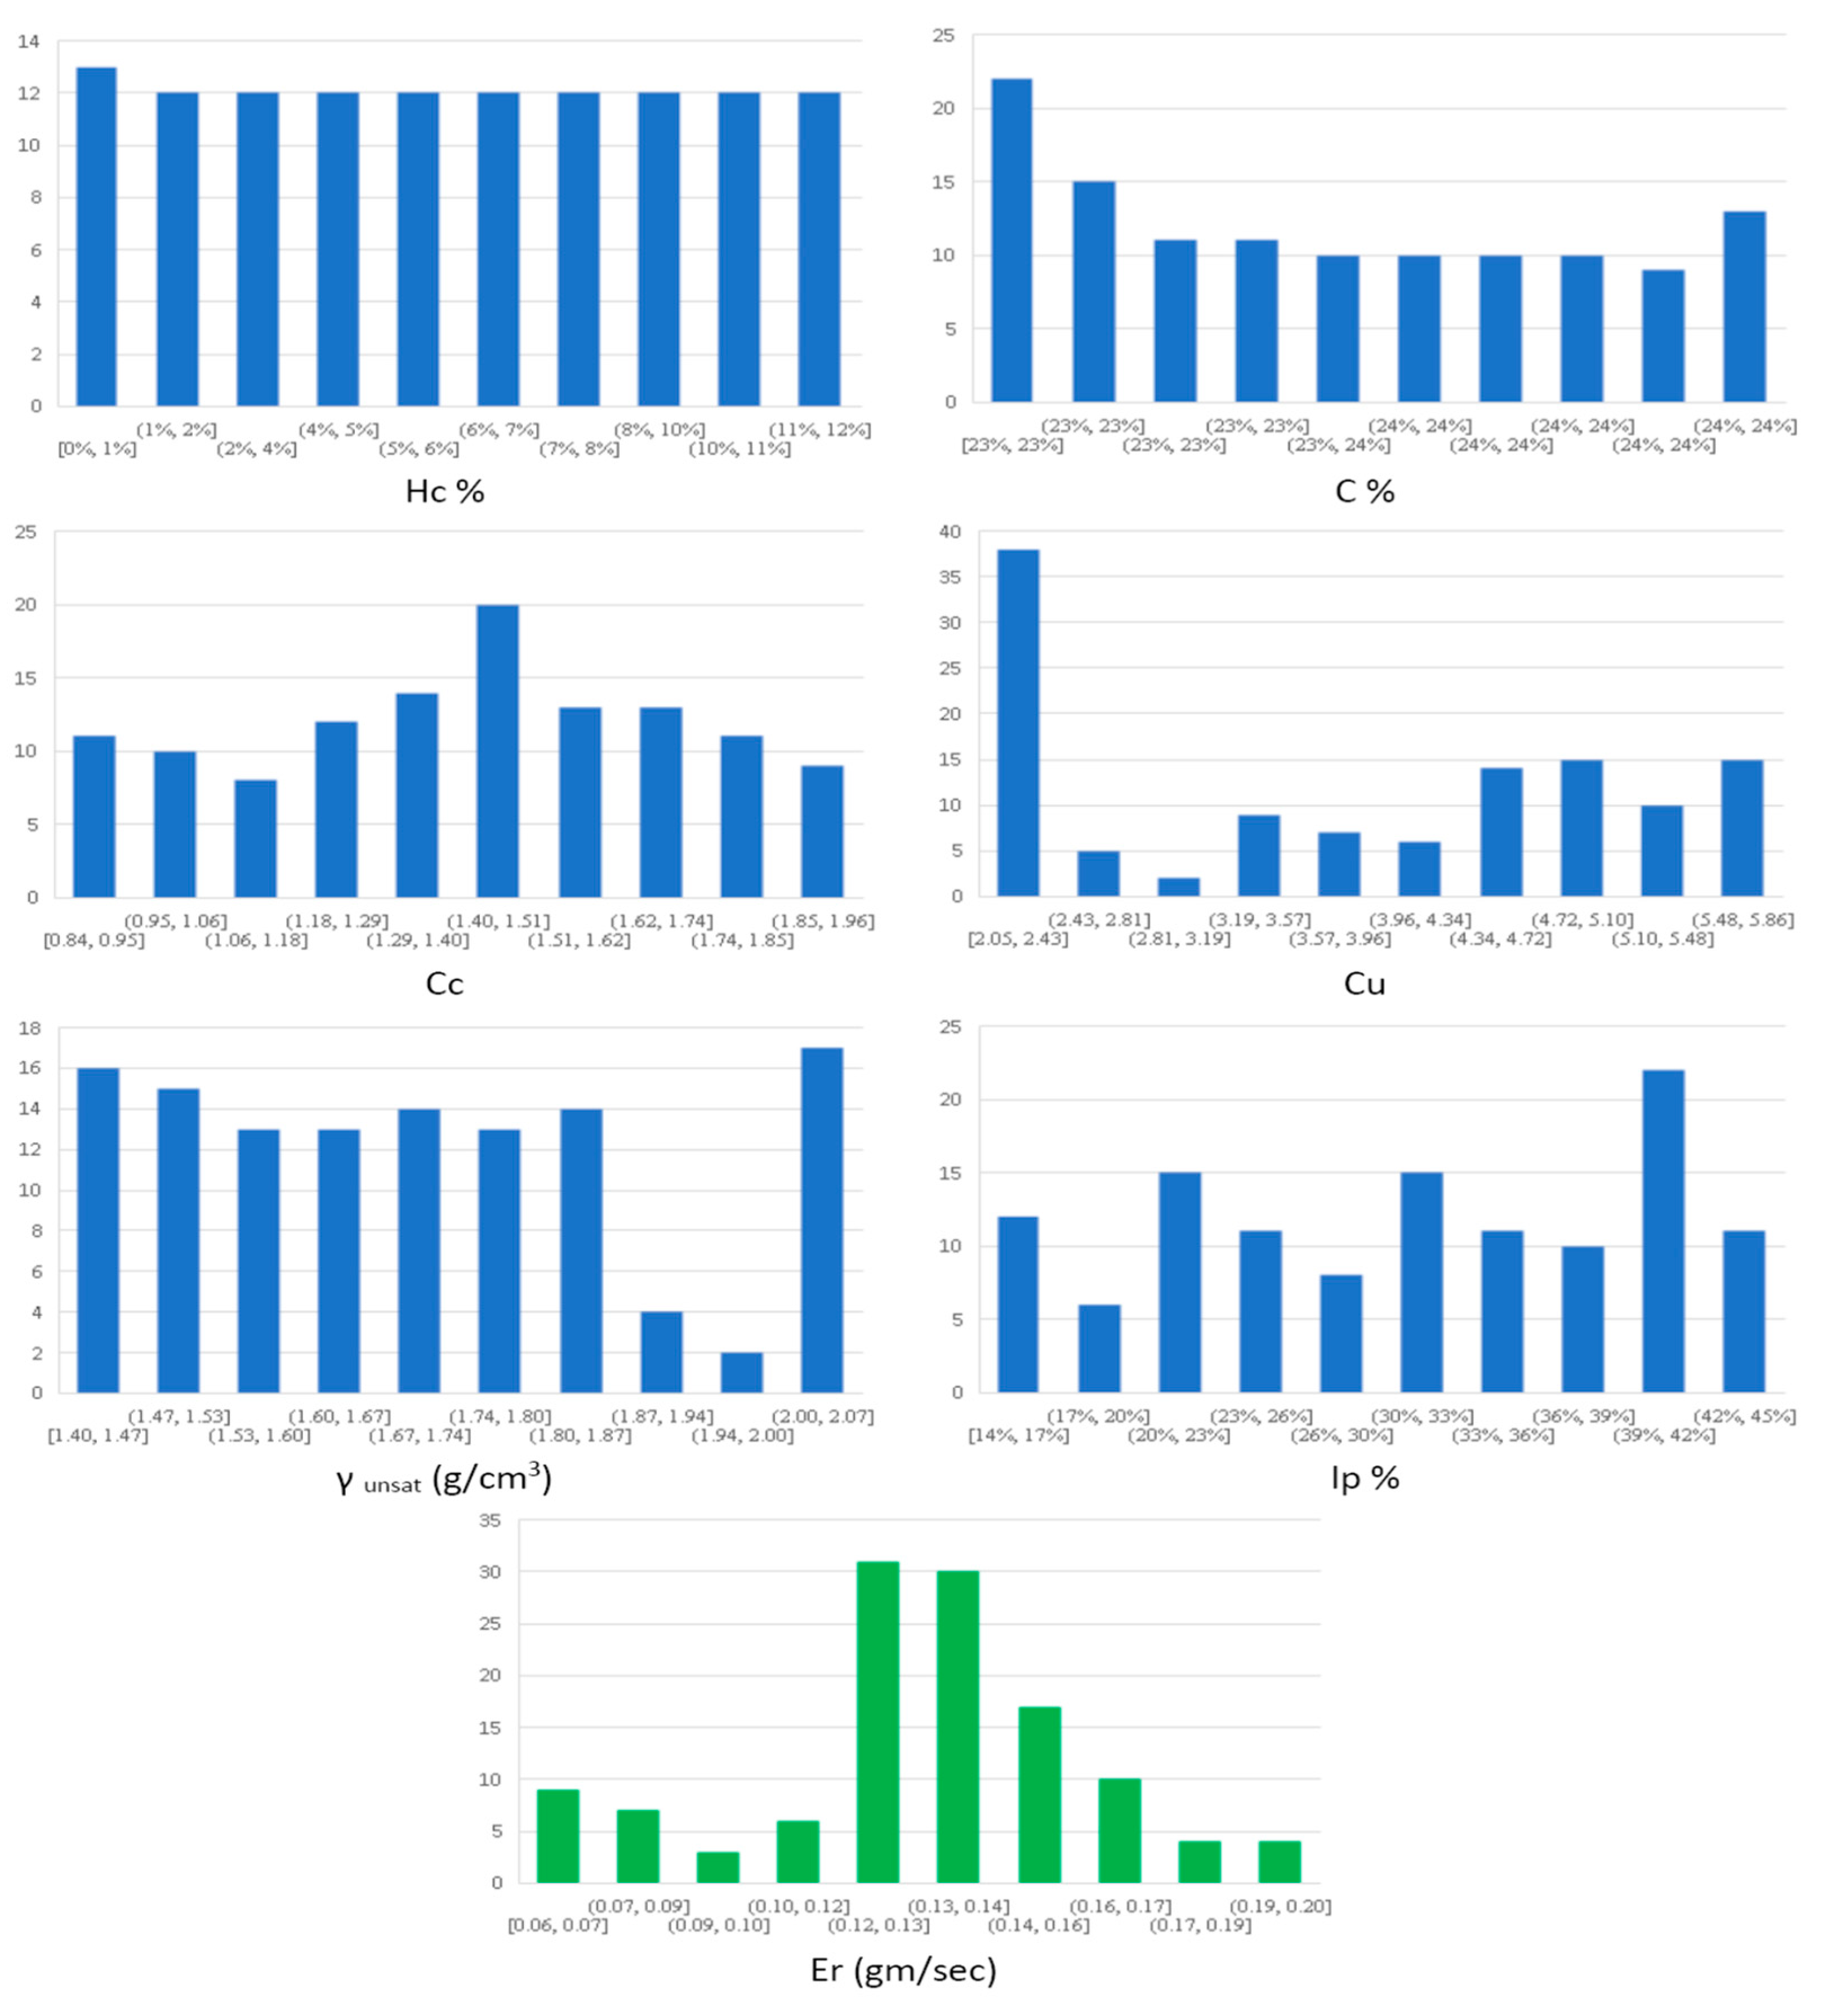
2.2.2. Collected Database; Statistical Analysis, Distribution and Correlation of Parameters
- Hybrid Cement percent by weight (HC),
- Clay content (C)
- Coefficient of curvature (Cc)
- Coefficient of uniformity (Cu)
- Unsaturated unit weight (g/cm3) (γunsat)
- Plasticity index (Ip),
- Erodibility (Er)(g/s)
2.2.3. Research Model Program
3. Discussion of Results
3.1. Materials’ Properties
3.2. Intelligent Predictionsof Erodibility (Er)
3.2.1. Model (1)—Using (GP) Technique
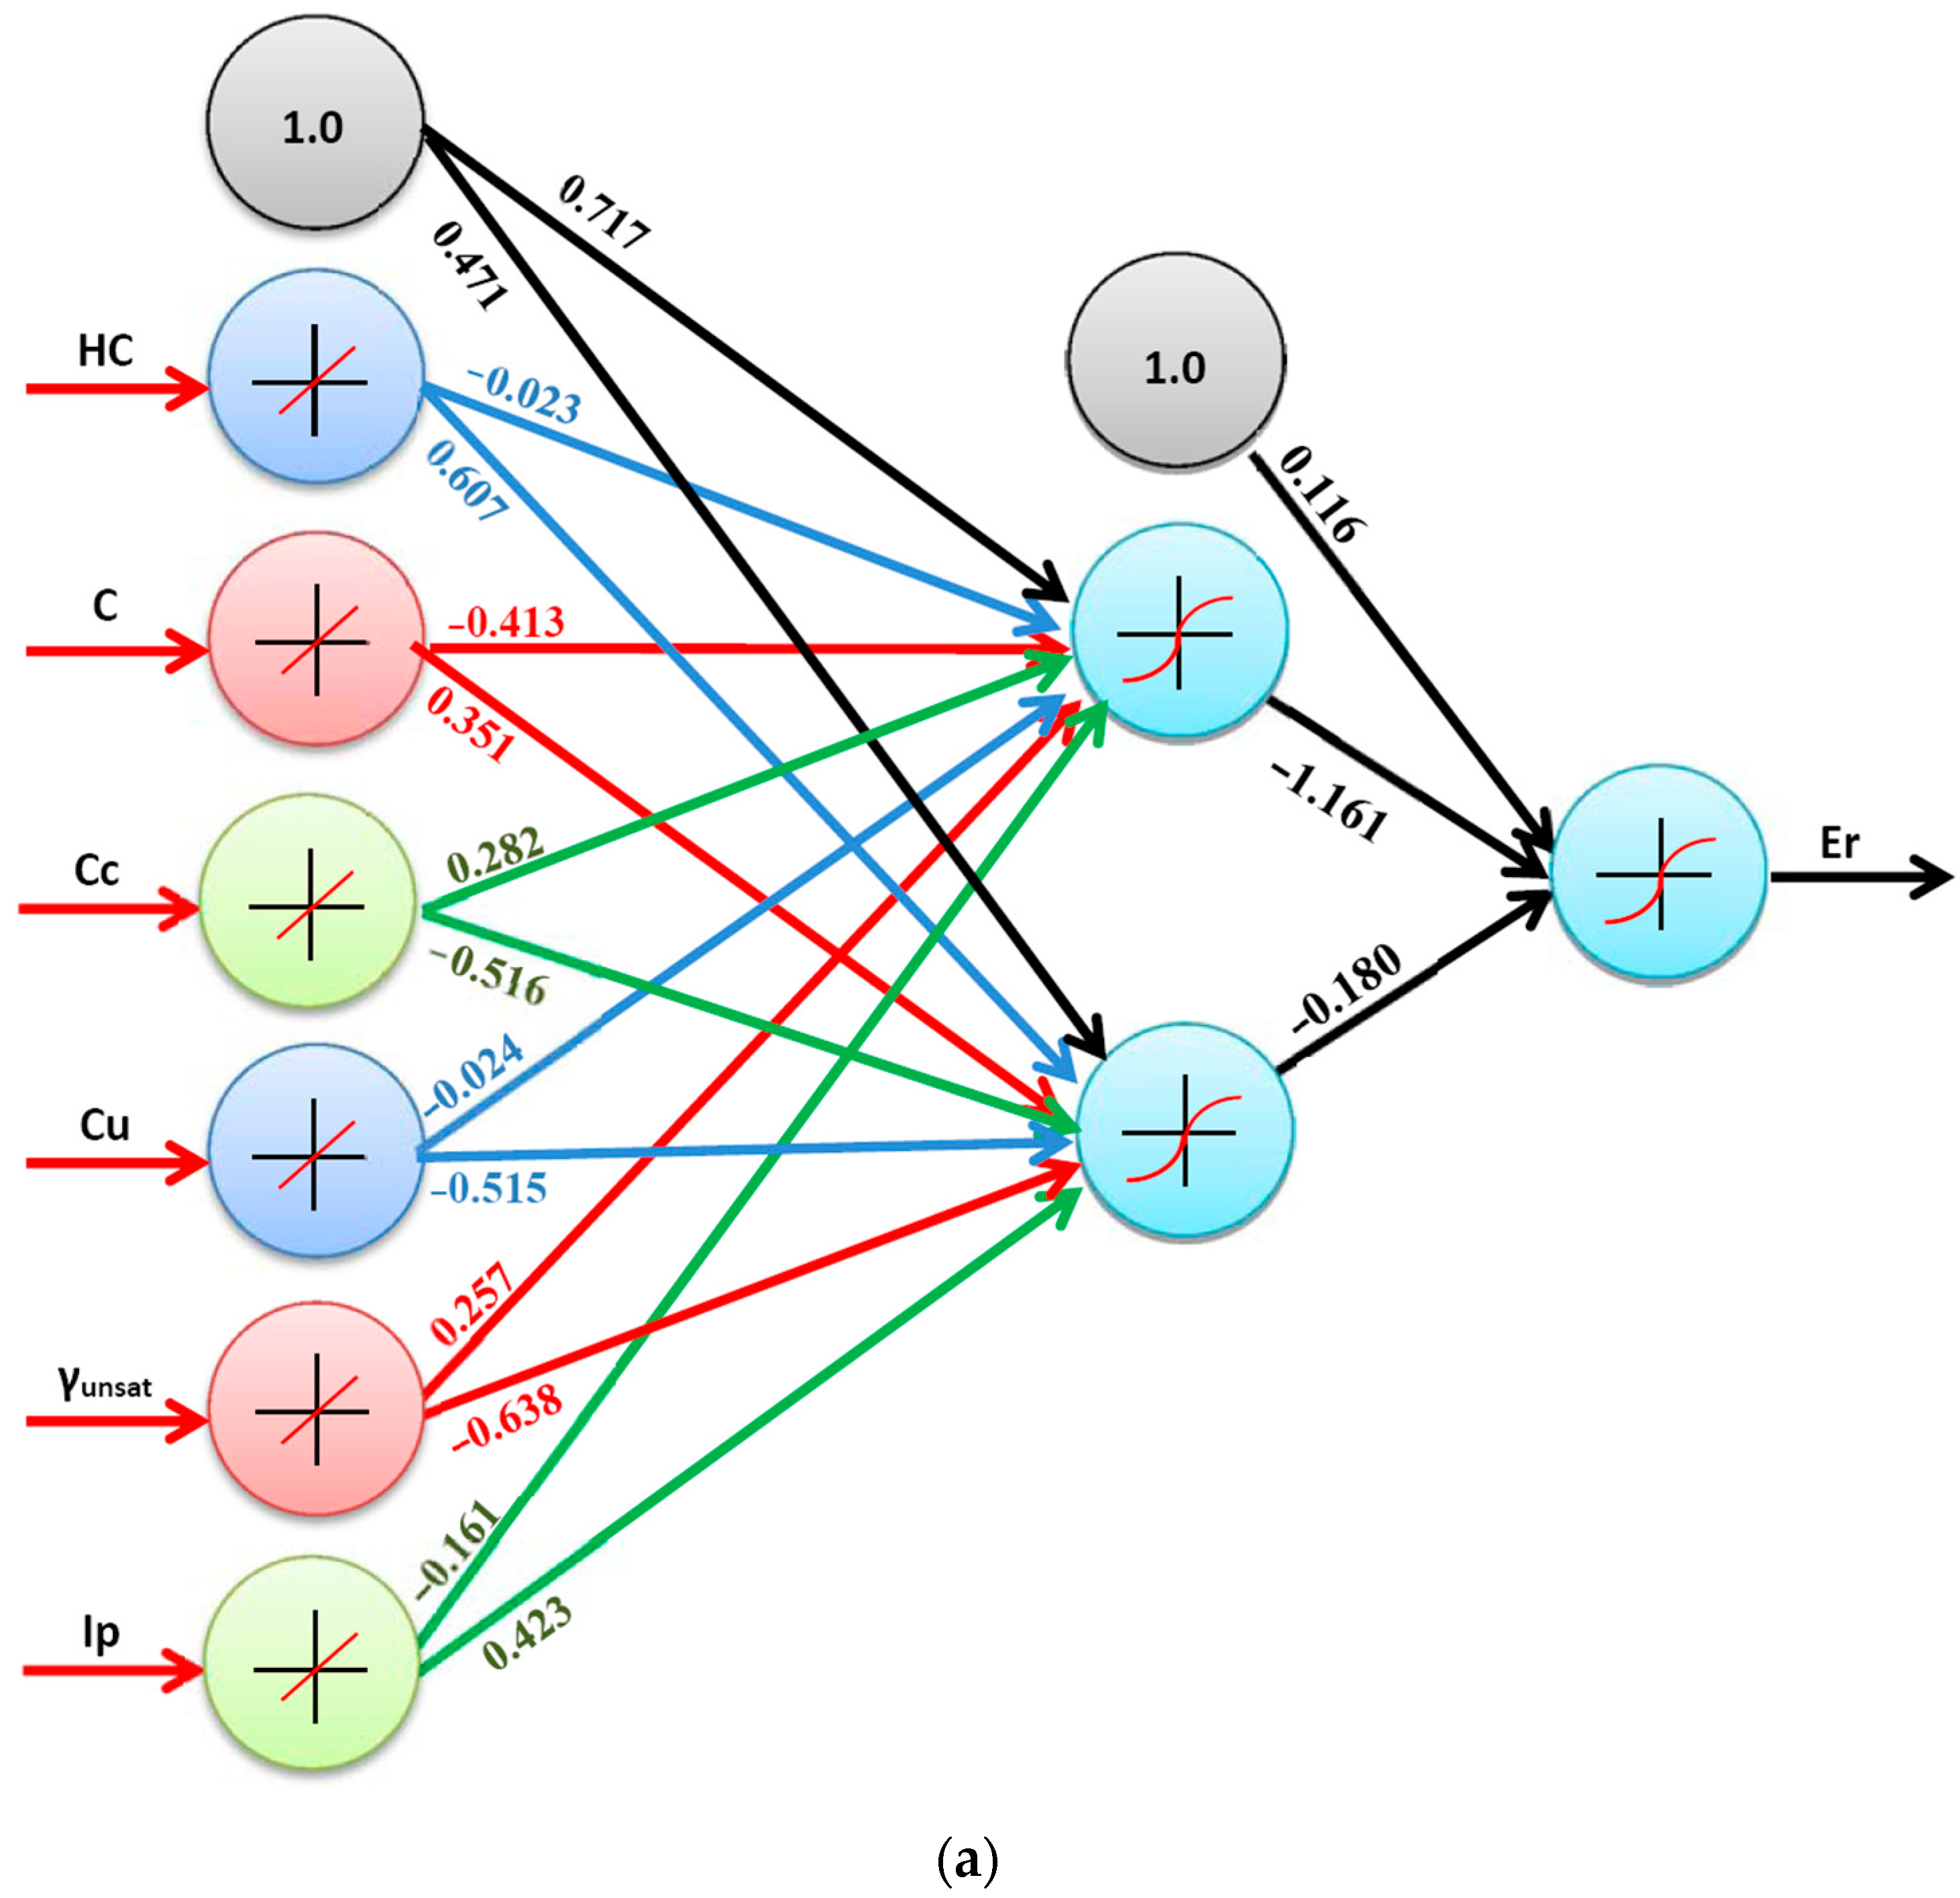
3.2.2. Model (2)—Using (ANN) Technique
3.2.3. Model (3)—Using (EPR) Technique
4. Conclusions
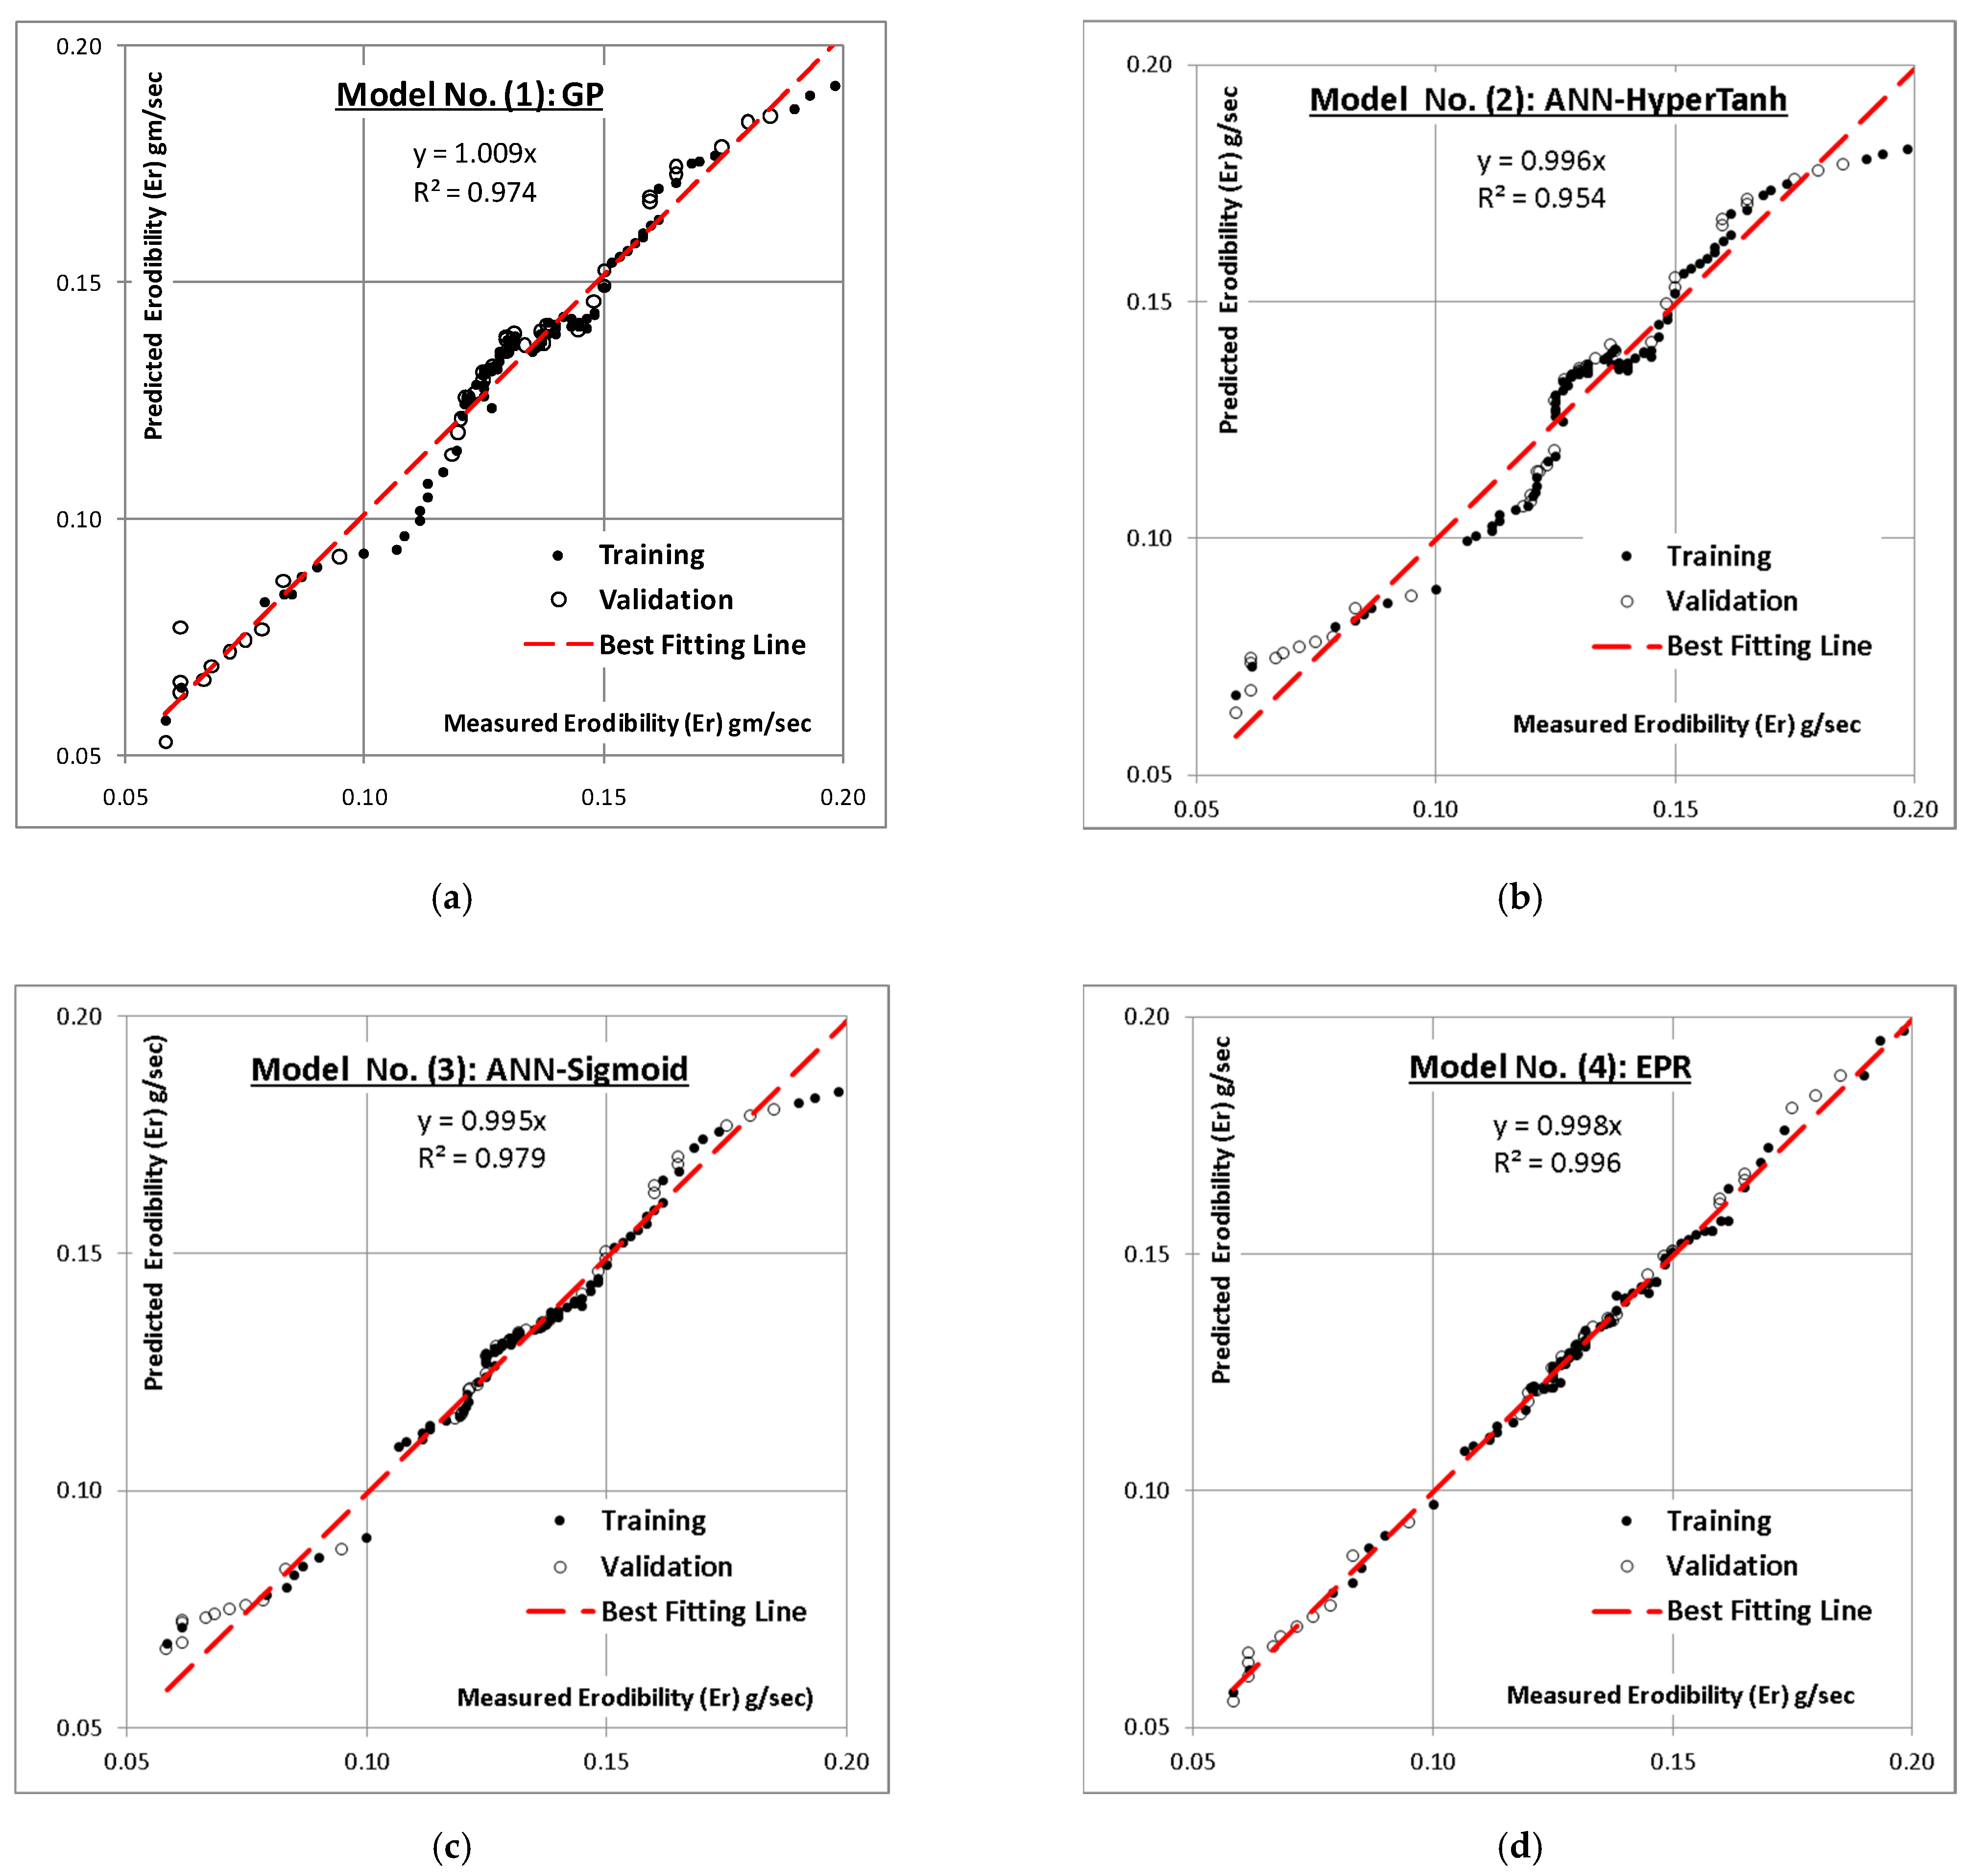
- The prediction accuracies of the ANN (sigmoid), ANN (Tahn) and GP models are close (97.9%, 95.4% and 97.4%), which gives an advantage to the ANN (sigmoid activation function) model because its output is a closed form equation and could be applied either manually or implemented in software. On the other hand, the prediction accuracy of the EPR model is better than all of them (99.6%; 1.6%); in addition, its output is a closed form equation, and that makes it the optimum model.
- The outputs of both the GP and the ANN models indicated that (Er) values were mainly governed by (Ip) & (γunsat), while (Cu), (Cc) and (HC) have a secondary impact, and (C) has a negligible impact on (Er) values.
- The erodibility value (Er) decreased with decreasing (Ip) values and with increasing (γunsat) values.
- The GA optimized technique successfully reduced the 43 terms of conventional polynomial linear regression (PLR)quadratic formula to only 11 terms without significant impact on its accuracy.
- Like any other regression technique, the generated formulas are valid within the considered range of parameter values; beyond this range, the prediction accuracy should be verified.
Supplementary Materials
Author Contributions
Funding
Data Availability Statement
Acknowledgments
Conflicts of Interest
References
- Onyelowe, K.C.; Bui Van, D.; Ikpemo, O.C.; Ubachukwu, O.A.; Van Nguyen, M. Assessment of rainstorm induced sediment deposition, gully development at Ikot Ekpene, Nigeria and the devastating effect on the environment. Environ. Technol. Innov. 2018, 10, 194–207. [Google Scholar] [CrossRef]
- Onyelowe, K.C. The menace of the Geo-Environmental hazard caused by gully erosion in Abia State, Nigeria. Environ. Technol. Innov. 2017, 8, 343–348. [Google Scholar] [CrossRef]
- Gayen, A.; Pourghasemi, H.R. Spatial modeling of gully erosion: A new ensemble of CART and GLM data-mining algorithms. In Spatial Modeling in GIS and R for Earth and Environmental Sciences; Pourghasemi, H.R., Gokceoglu, C., Eds.; Elsevier: Amsterdam, The Netherlands, 2019; pp. 653–669. ISBN 978-0-12-815226-3. [Google Scholar]
- Poesen, J.W. Contribution of gully erosion to sediment production on cultivated lands and rangelands. In Proceedings of the An International Symposium, Exeter, UK, 15–19 July 1996; IAHS: Wallingford, UK, 1996. [Google Scholar]
- Pal, S.C.; Arabameri, A.; Blaschke, T.; Chowdhuri, I.; Saha, A.; Chakrabortty, R.; Lee, S.; Band, S. Ensemble of Machine-Learning Methods for Predicting Gully Erosion Susceptibility. Remote Sens. 2020, 12, 3675. [Google Scholar] [CrossRef]
- Arabameri, A.; Pal, S.C.; Costache, R.; Saha, A.; Rezaie, F.; Danesh, A.S.; Pradhan, B.; Lee, S.; Hoang, N.-D. Prediction of gully erosion susceptibility mapping using novel ensemble machine learning algorithms Perdition of gully erosion susceptibility mapping using novel ensemble machine learning algorithms. Geomat. Nat. Hazards Risk 2021, 12, 469–498. [Google Scholar] [CrossRef]
- Pal, S.C.; Shit, M. Application of RUSLE model for soil loss estimation of Jaipanda watershed, West Bengal. Spat. Inf. Res. 2017, 25, 399–409. [Google Scholar] [CrossRef]
- Saha, A.; Ghosh, M.; Pal, S.C. Understanding the Morphology and Development of a Rill-Gully: An Empirical Study of KhoaiBadland, West Bengal, India. In Gully Erosion Studies from India and Surrounding Regions. Advances in Science, Technology & Innovation; Shit, P.K., Pourghasemi, H.R., Bhunia, G.S., Eds.; Springer International Publishing: Cham, Switzerland, 2020; pp. 147–161. ISBN 978-3-030-23243-6. [Google Scholar]
- Kavian, A.; Alipour, A.; Soleimani, K.; Gholami, L.; Smith, P.; Rodrigo-Comino, J. The increase of rainfall erosivity and initial soil erosion processes due to rainfall acidification. Hydrol. Process. 2018, 33, 261–270. [Google Scholar] [CrossRef] [Green Version]
- Mohamadi, M.A.; Kavian, A. Effects of rainfall patterns on runoff and soil erosion in field plots. Int. Soil Water Conserv. Res. 2015, 3, 273–281. [Google Scholar] [CrossRef] [Green Version]
- Vinod, J.S.; Indraratna, B.; Al Mahamud, M.A. Stabilization of an erodible soil using a chemical admixture. Fac. Eng. Inf. Sci. Pap. Part A 2010, 715, 43–52. Available online: https://ro.uow.edu.au/eispapers/715 (accessed on 19 December 2021).
- Abdollahzadeh, A.; Mukhlisin, M.; Shafie, A. Predict soil erosion with artificial neural network in Tanakami (Japan). WSEAS Trans. Comput. 2011, 10, 51–60. [Google Scholar]
- Al Rammahi, A.; Khassaf, S. Estimation of Soil Erosion Risk of the Euphrates River Watershed Using RUSLE Model, Remote Sensing and GIS Techniques. In Proceedings of the Hydrology Days, Rome, Italy, 19–22 March 2018. [Google Scholar] [CrossRef]
- Uluocha, N.O.; Uwadiegwu, I. Mapping gully erosion in Abia State, Nigeria using Geographic Information Systems (GIS) and remote sensing techniques. J. Soil Sci. Environ. Manag. 2015, 6, 284–300. [Google Scholar] [CrossRef] [Green Version]
- Iro, S. Determining Causes of Gully Erosion and Associated Rates of Change in South-East Nigeria, using a Remote Sensing and GIS Methodology. Am. J. Environ. Sci. 2020, 16, 96–111. [Google Scholar] [CrossRef]
- NEWMAP. GIS Mapping of Abia State, Nigeria Erosion and Watershed Management Project Vol. 11, ABS/NEWMAP/QCBS/CON/16/01; Fullplan Associates: Ibadan, Nigeria, 2017. [Google Scholar]
- Karakus, A. Investigating on possible use of Diyarbakir basalt waste in Stone Mastic Asphalt. Constr. Build. Mater. 2011, 25, 3502–3507. [Google Scholar] [CrossRef]
- Karaşahin, M.; Terzi, S. Evaluation of marble waste dust in the mixture of asphaltic concrete. Constr. Build. Mater. 2007, 21, 616–620. [Google Scholar] [CrossRef]
- Onyelowe, K.C.; Bui Van, D. Durability of nanostructured biomasses ash (NBA) stabilized expansive soils for pavement foundation. Int. J. Geotech. Eng. 2018, 14, 254–263. [Google Scholar] [CrossRef]
- Onyelowe, K.C.; Bui Van, D. Predicting Subgrade Stiffness of Nanostructured Palm Bunch Ash Stabilized Lateritic Soil for Transport Geotechnics Purposes. J. GeoEngineering Taiwan Geotech. Soc. 2018, 13, 59–67. Available online: http://140.118.105.174/jge/index.php (accessed on 20 December 2021).
- Parveen, S.; Rana, S.; Fangueiro, R. A Review on Nanomaterial Dispersion, Microstructure, and Mechanical Properties of Carbon Nanotube and Nanofiber Reinforced Cementitious Composites. J. Nanomater. 2013, 2013, 710175. [Google Scholar] [CrossRef]
- Ubachukwu, O.A.; Nwobia, L.I.; Onwaekele, A.P. Potentials of bamboo leaf ash as supplementary cementicious material for concrete in Southern Nigeria. In Proceedings of the 3rd South East Regional Conference, Nsukka, Nigeria, 26–28 February 2018; Anyanwu, C.N., Okonkwo, V.C., Onyekwelu, I., Ezeakgaba, A.C., Ani, O.A., Eds.; University of Nigeria: Nsukka, Nigeria, 2018. [Google Scholar]
- Alsharef, M.A.; Taha, M.R.; Firoozi, A.A.; Govindasamy, P. Potential of using nanocarbons to stabilize weak soils. Appl. Environ. Soil Sci. 2016, 2016, 5060531. [Google Scholar] [CrossRef] [Green Version]
- Rai, B.; Kumar, S.; Satish, K. Effect of Fly Ash on Mortar Mixes with Quarry Dust as Fine Aggregate. Adv. Mater. Sci. Eng. 2014, 2014, 17. [Google Scholar] [CrossRef] [Green Version]
- Vijayalakshmi, M.; Sekar, A.S.S.; Prabhu, G.G. Strength and durability properties of concrete made with granite industry waste. Constr. Build. Mater. 2013, 46, 1–7. [Google Scholar] [CrossRef]
- Ucankus, G.; Ercan, M.; Culha, M. Methods for preparation of nanocomposites in environmental remediation. In New Polymer Nanocomposites for Environmental Remediation; Hussain, C.M., Mishra, A.K., Eds.; Elsevier: Amsterdam, The Netherlands, 2018; ISBN 978-0-12-811033-1. [Google Scholar] [CrossRef]
- Al-Abadi, A.M.; Al-Ali, A.K. Susceptibility mapping of gully erosion using GIS-based statistical bivariate models: A case study from Ali Al-Gharbi District, Maysan Governorate, southern Iraq. Environ. Earth Sci. 2018, 77, 249. [Google Scholar] [CrossRef]
- Kouchami-Sardoo, I.; Shirani, H.; Esfandiarpour-Boroujeni, I.; Besalatpour, A.A.; Hajabbasi, M.A. Prediction of soil wind erodibility using a hybrid Genetic algorithm—Artificial neural network method. Catena 2020, 187, 104315. [Google Scholar] [CrossRef]
- De Jong, S.M. Application of Reflective Remote Sensing for Land Degradation Studies in a Mediterranean Environment; Geographical Studies; University of Utrecht: Utrecht, The Netherlands, 1994. [Google Scholar]
- De Jong, S.M.; Paracchini, M.L.; Bertolo, F.; Folving, S.; Megier, J.; de Roo, A.P.J. Regional assessment of soil erosion using the distributed model SEMMED and remotely sensed data. Catena 1999, 37, 291–308. [Google Scholar] [CrossRef]
- De Jong, S.M.; Riezebos, H.T. SEMMED: A distributed approach to soil erosion modelling. In Remote Sensing 96: Integrated Applications for Risk Assessment and Disaster Prevention for the Mediterranean; Spiteri, A., Ed.; Balkema: Rotterdam, The Netherlands, 1997; pp. 199–204. [Google Scholar]
- Lin, C.-Y.; Lin, W.-T.; Chou, W.-C. Soil erosion prediction and sediment yield estimation: The Taiwan experience. Soil Tillage Res. 2002, 68, 143–152. [Google Scholar] [CrossRef]
- Wang, G.; Wente, S.; Gertner, G.Z.; Anderson, A. Improvement in mapping vegetation cover factor for the universal soil loss equation by geostatistical methods with Landsat Thematic Mapper images. Int. J. Remote Sens. 2002, 23, 3649–3667. [Google Scholar] [CrossRef]
- Yusuf, M.; Azamathulla, H.; Abdullah, R. Prediction of soil erodibility factor for Peninsular Malaysia soil series using ANN. Neural Comput. Appl. 2012, 24, 383–389. [Google Scholar] [CrossRef]
- Ebid, A.M. 35 Years of (AI) in Geotechnical Engineering: State of the Art. Geotech. Geol. Eng. 2020, 39, 637–690. [Google Scholar] [CrossRef]
- Onyelowe, K.C.; Shakeri, J. Intelligent prediction of coefficients of curvature and uniformity of hybrid cement modified unsaturated soil with NQF inclusion. Clean. Eng. Technol. 2021, 4, 100152. [Google Scholar] [CrossRef]
- Ebid, A. Applications of Genetic Programming in Geotechnical Engineering. Ph.D. Thesis, Future University in Egypt, New Cairo, Egypt, 2004. [Google Scholar] [CrossRef]
- Puente, C.; Olague, G.; Smith, S.; Bullock, S.; González-Botello, M.; Hinojosa, A. A Genetic Programming Approach to Estimate Vegetation Cover in the Context of Soil Erosion Assessment. Photogramm. Eng. Remote Sens. 2011, 77, 363–375. [Google Scholar] [CrossRef] [Green Version]
- Brezocnik, M.; Kovacic, M.; Leo Gusel, L. Comparison Between Genetic Algorithm and Genetic Programming Approach for Modeling the Stress Distribution. Mater. Manuf. Process. 2007, 20, 497–508. [Google Scholar] [CrossRef]
- Ghorbani, B.; Arulrajah, A.; Narsilio, G.; Horpibulsuk, S.; Win Bo, M. Development of genetic-based models for predicting the resilient modulus of cohesive pavement subgrade soils. Soils Found. 2020, 60, 398–412. [Google Scholar] [CrossRef]
- Tizpa, P.; Chenari, J.R.; Fard, K.M.; Lemos, S. ANN prediction of some geotechnical properties of soil from their index parameters. Arab. J. Geosci. 2015, 8, 2911–2920. [Google Scholar] [CrossRef]
- BS 1377—2, 3; Methods of Testing Soils for Civil Engineering Purposes. British Standard Institute: London, UK, 1990.
- Onyelowe, K.C.; Bui Van, D.; Ubachukwu, O.; Ezugwu, C.; Salahudeen, B.; Nguyen Van, M.; Ikeagwuani, C.; Amhadi, T.; Sosa, F.; Wu, W.; et al. Recycling and reuse of solid wastes; a hub for ecofriendly, ecoefficient and sustainable soil, concrete, wastewater and pavement reengineering. Int. J. Low-Carbon Technol. 2019, 14, 440–451. Available online: http://10.1093/ijlct/ctz028 (accessed on 19 December 2021). [CrossRef]
- Onyelowe, K.C.; Okafor, F.O. Review of the Synthesis of Nano-Sized Ash from Local Waste for Use as Admixture or Filler in Engineering Soil Stabilization and Concrete Production. J. Environ. Nanotechnol. 2015, 4, 23–27. [Google Scholar] [CrossRef]
- Onyelowe, K.C. Local Nanostructured Ashes Synthesized by Incineration, Pulverization and Spectrophotometric Characterization of Solid Wastes Ashes for Use as Admixtures in Soil Stabilization. Int. J. Sustain. Constr. Eng. Technol. 2016, 7, 50–64. Available online: http://penerbit.uthm.edu.my/ojs/index.php/IJSCET (accessed on 19 December 2021).
- Onyelowe, K.C. Nanosized palm bunch ash (NPBA) stabilisation of lateritic soil for construction purposes. Int. J. Geotech. Eng. 2017, 11, 83–91. [Google Scholar] [CrossRef]
- Onyelowe, K.C. Nanostructured Waste Paper Ash Stabilization of Lateritic Soils for Pavement Base Construction Purposes. Electron. J. Geotech. Eng. 2017, 22, 3633–3647. Available online: www.ejge.com (accessed on 19 December 2021).
- ASTM C618; Specification for Fly Ash and Raw or Calcined Natural Pozzolan for Use as a Mineral Admixture in Portland Cement Concrete. American Standard of Testing and Materials: Washington, DC, USA, 1978.
- BS 1924; Methods of Tests for Stabilized Soil. British Standard Institute: London, UK, 1990.
- BS 8615-1; Specification for Pozzolanic Materials for Use with Portland Cement Natural Pozzolana and Natural Cal-Cined Pozzolana. British Standard International: London, UK, 2019.
- Onyelowe, K.C.; Ebid, A.M.; Nwobia, L.; Dao-Phuc, L. Prediction and performance analysis of compression index of multiple-binder-treated soil by genetic programming approach. Nanotechnol. Environ. Eng. 2021, 6, 28. [Google Scholar] [CrossRef]


| Hybrid Cement HC | Clay Content C | Coeff. of Curvature Cc | Cu | Unsaturated Unit Weight γunsat | Plasticity Index Ip | Erodibility (Er) | |
|---|---|---|---|---|---|---|---|
| - | - | - | - | g/cm3 | - | (g/s) | |
| Training set | |||||||
| Max. | 0.00 | 0.23 | 0.84 | 2.05 | 1.40 | 0.14 | 0.06 |
| Min | 0.12 | 0.24 | 1.93 | 5.85 | 2.07 | 0.45 | 0.20 |
| Avg | 0.06 | 0.23 | 1.39 | 3.68 | 1.68 | 0.32 | 0.13 |
| SD | 0.03 | 0.00 | 0.28 | 1.27 | 0.18 | 0.08 | 0.03 |
| Var | 0.58 | 0.01 | 0.20 | 0.34 | 0.11 | 0.27 | 0.20 |
| Validation set | |||||||
| Max. | 0.00 | 0.23 | 0.88 | 2.06 | 1.42 | 0.14 | 0.06 |
| Min | 0.12 | 0.24 | 1.96 | 5.86 | 2.07 | 0.45 | 0.19 |
| Avg | 0.07 | 0.24 | 1.46 | 4.03 | 1.74 | 0.29 | 0.12 |
| SD | 0.04 | 0.00 | 0.33 | 1.38 | 0.22 | 0.10 | 0.04 |
| Var | 0.58 | 0.01 | 0.22 | 0.34 | 0.13 | 0.35 | 0.29 |
| Hc | C | Cc | Cu | γunsat | Ip | Er | |
|---|---|---|---|---|---|---|---|
| Hc | 1 | ||||||
| C | 0.99644 | 1 | |||||
| Cc | 0.99461 | 0.984554 | 1 | ||||
| Cu | 0.982765 | 0.983685 | 0.965768 | 1 | |||
| γunsat | 0.989468 | 0.993766 | 0.981575 | 0.970896 | 1 | ||
| Ip | −0.99652 | −0.9982 | −0.98578 | −0.98582 | −0.99131 | 1 | |
| Er | −0.94097 | −0.93884 | −0.95226 | −0.89402 | −0.96073 | 0.937162 | 1 |
| Property | % Passing 0.075 mm | NMC | LL | PL | PI | SP | SG | AASHTO | MDD | OMC |
|---|---|---|---|---|---|---|---|---|---|---|
| Value | 44 | 12 | 62 | 21 | 39 | 25 | 1.20 | A-7-6 | 1.15 | 17 |
| Unit | % | % | % | % | % | % | - | - | g/cm3 | % |
| Materials | Oxides’ Composition (Content by Weight,%) | ||||||||||||
|---|---|---|---|---|---|---|---|---|---|---|---|---|---|
| SiO2 | Al2O3 | CaO | Fe2O3 | MgO | K2O | Na2O | TiO2 | LOI | P2O5 | SO3 | *IR | Free CaO | |
| Clay Soil | 8.45 | 13.09 | 2.30 | 10.66 | 4.89 | 17.00 | 37.33 | 1.17 | - | 5.11 | - | - | - |
| NRHA | 57.48 | 22.72 | 4.56 | 3.77 | 4.65 | 2.76 | 0.01 | 3.17 | 0.88 | - | - | - | - |
| NQF | 62.48 | 18.72 | 4.83 | 6.54 | 2.56 | 3.18 | - | 0.29 | 1.01 | - | - | - | - |
| HC | 66.5 | 27.8 | 1.3 | 2.85 | 1.5 | 0.03 | - | 0.02 | - | - | - | - | - |
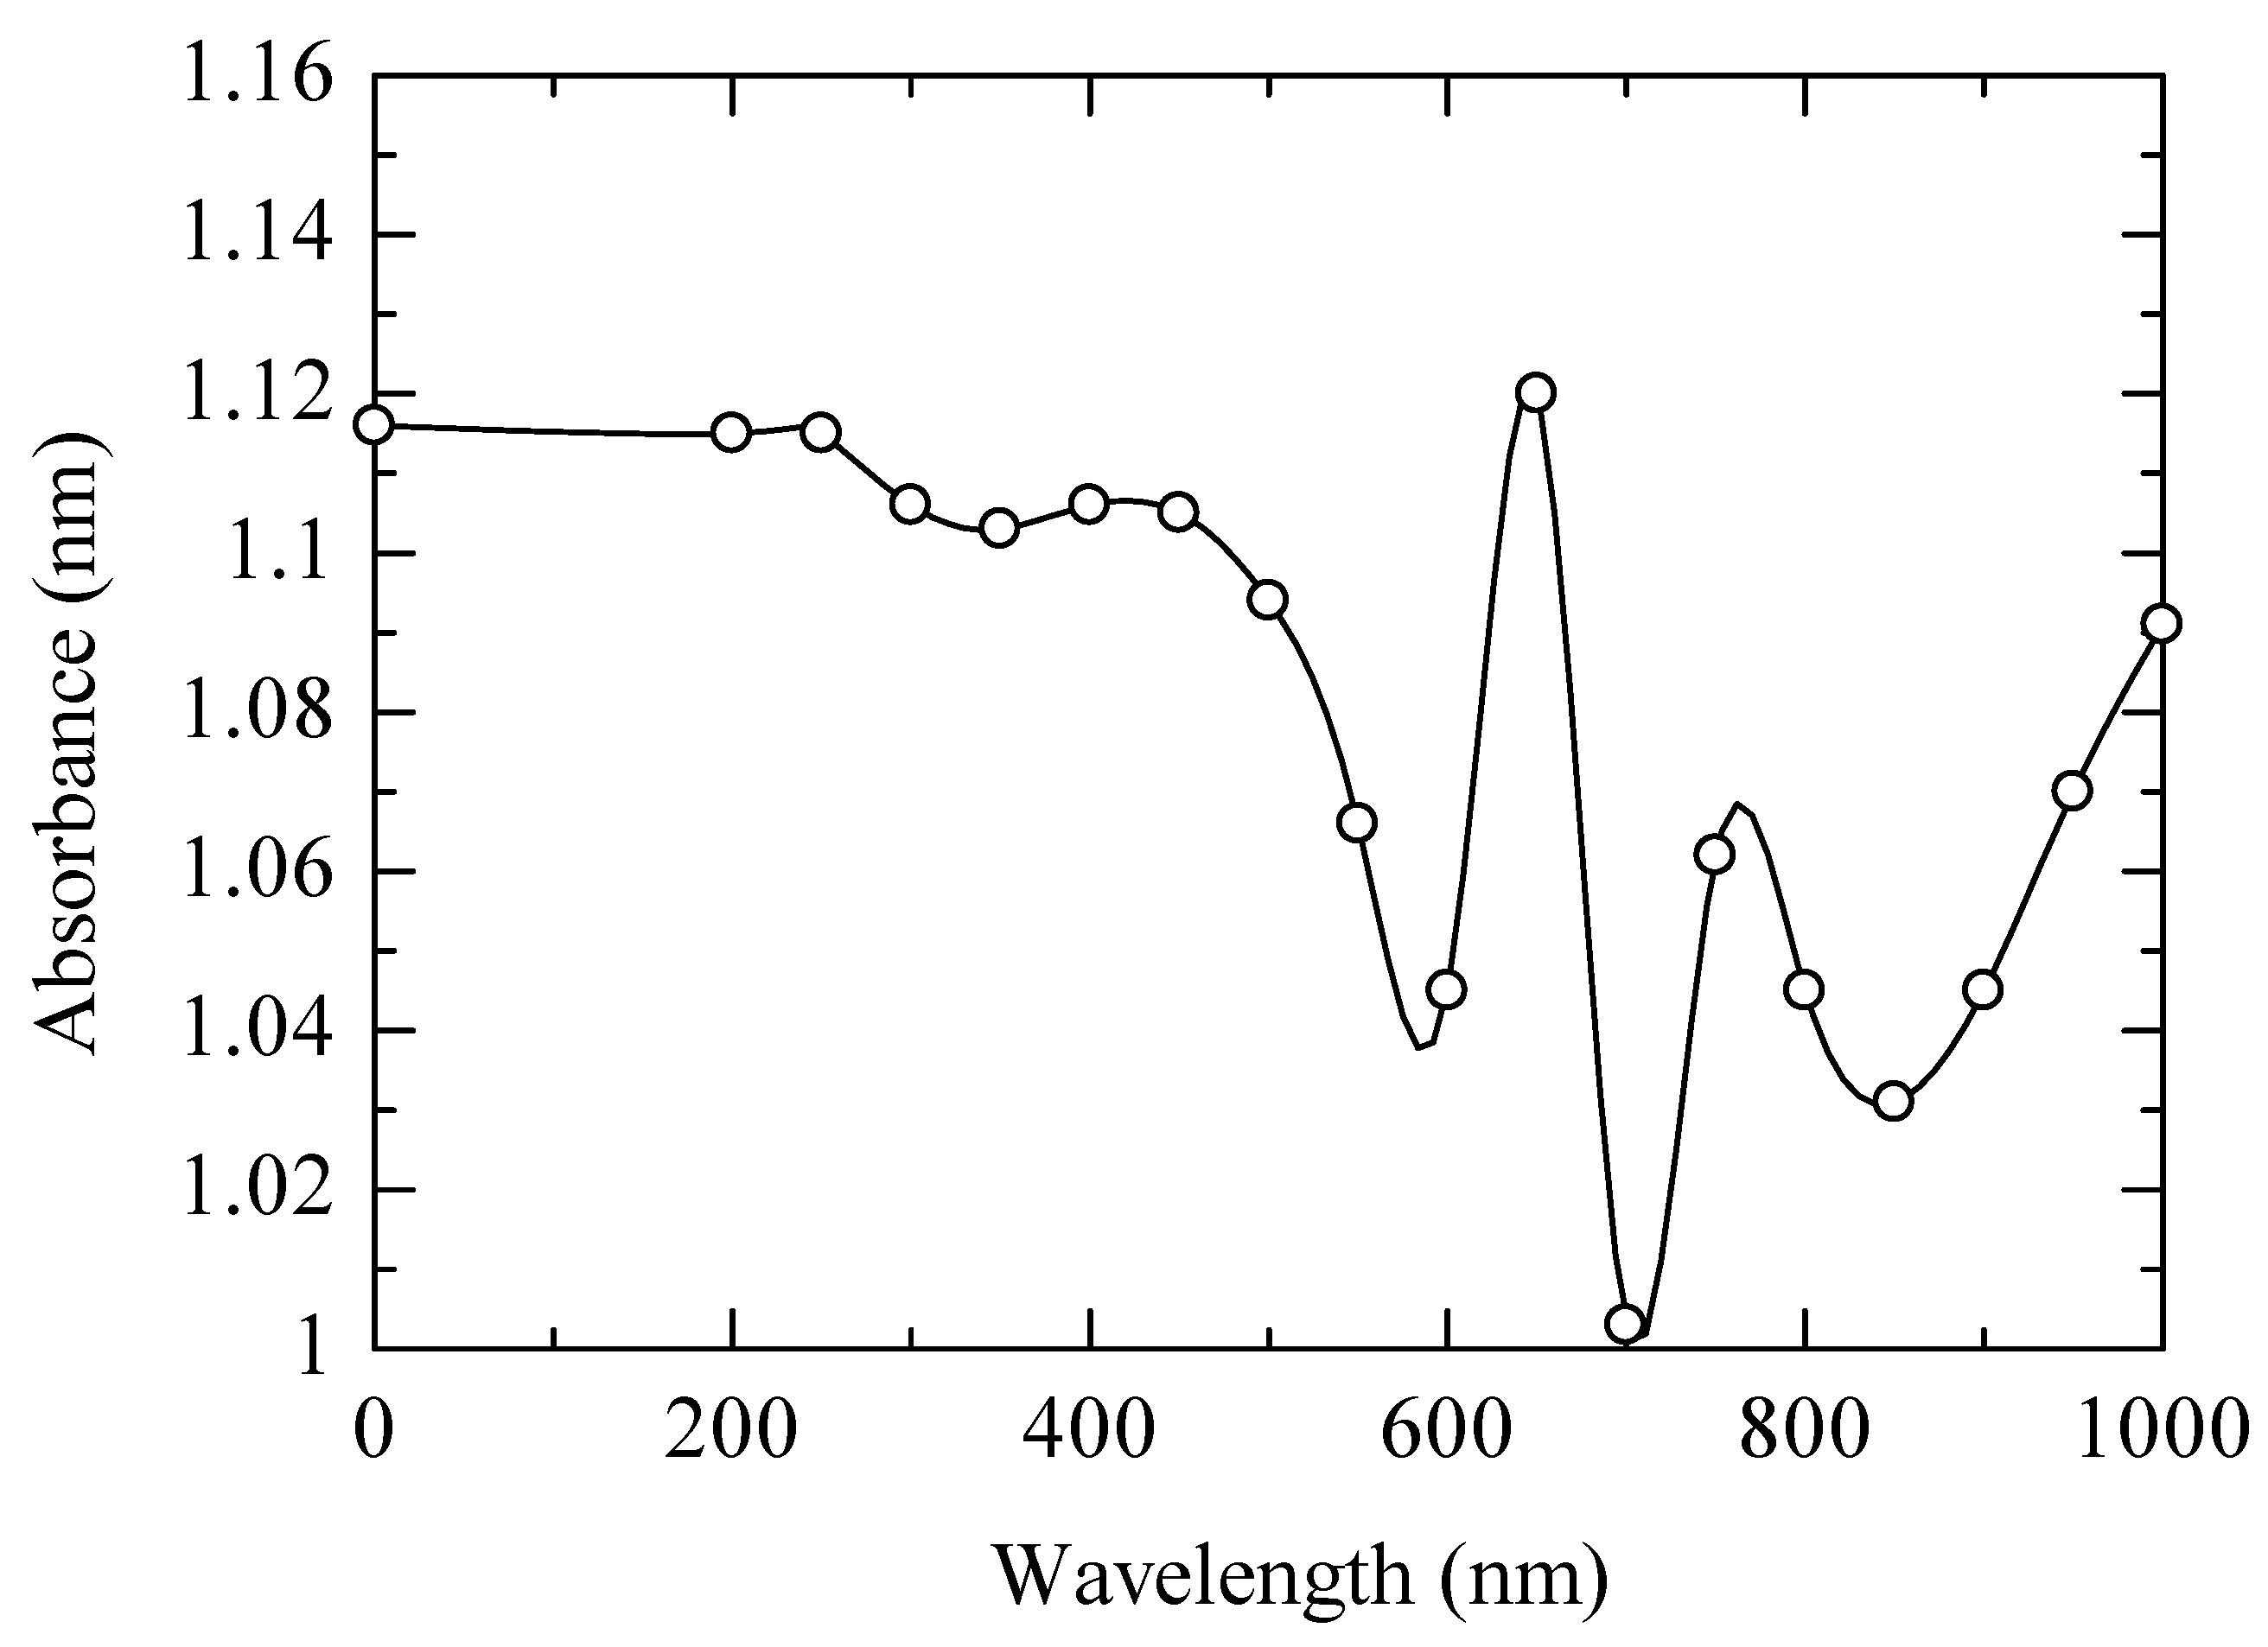
| Wavelength (nm) | Absorbance (nm) |
|---|---|
| 0 | 1.116 |
| 200 | 1.115 |
| 250 | 1.115 |
| 300 | 1.106 |
| 350 | 1.103 |
| 400 | 1.106 |
| 450 | 1.105 |
| 500 | 1.094 |
| 550 | 1.066 |
| 600 | 1.045 |
| 650 | 1.120 |
| 700 | 1.003 |
| 750 | 1.062 |
| 800 | 1.045 |
| 850 | 1.031 |
| 900 | 1.045 |
| 950 | 1.070 |
| 1000 | 1.091 |
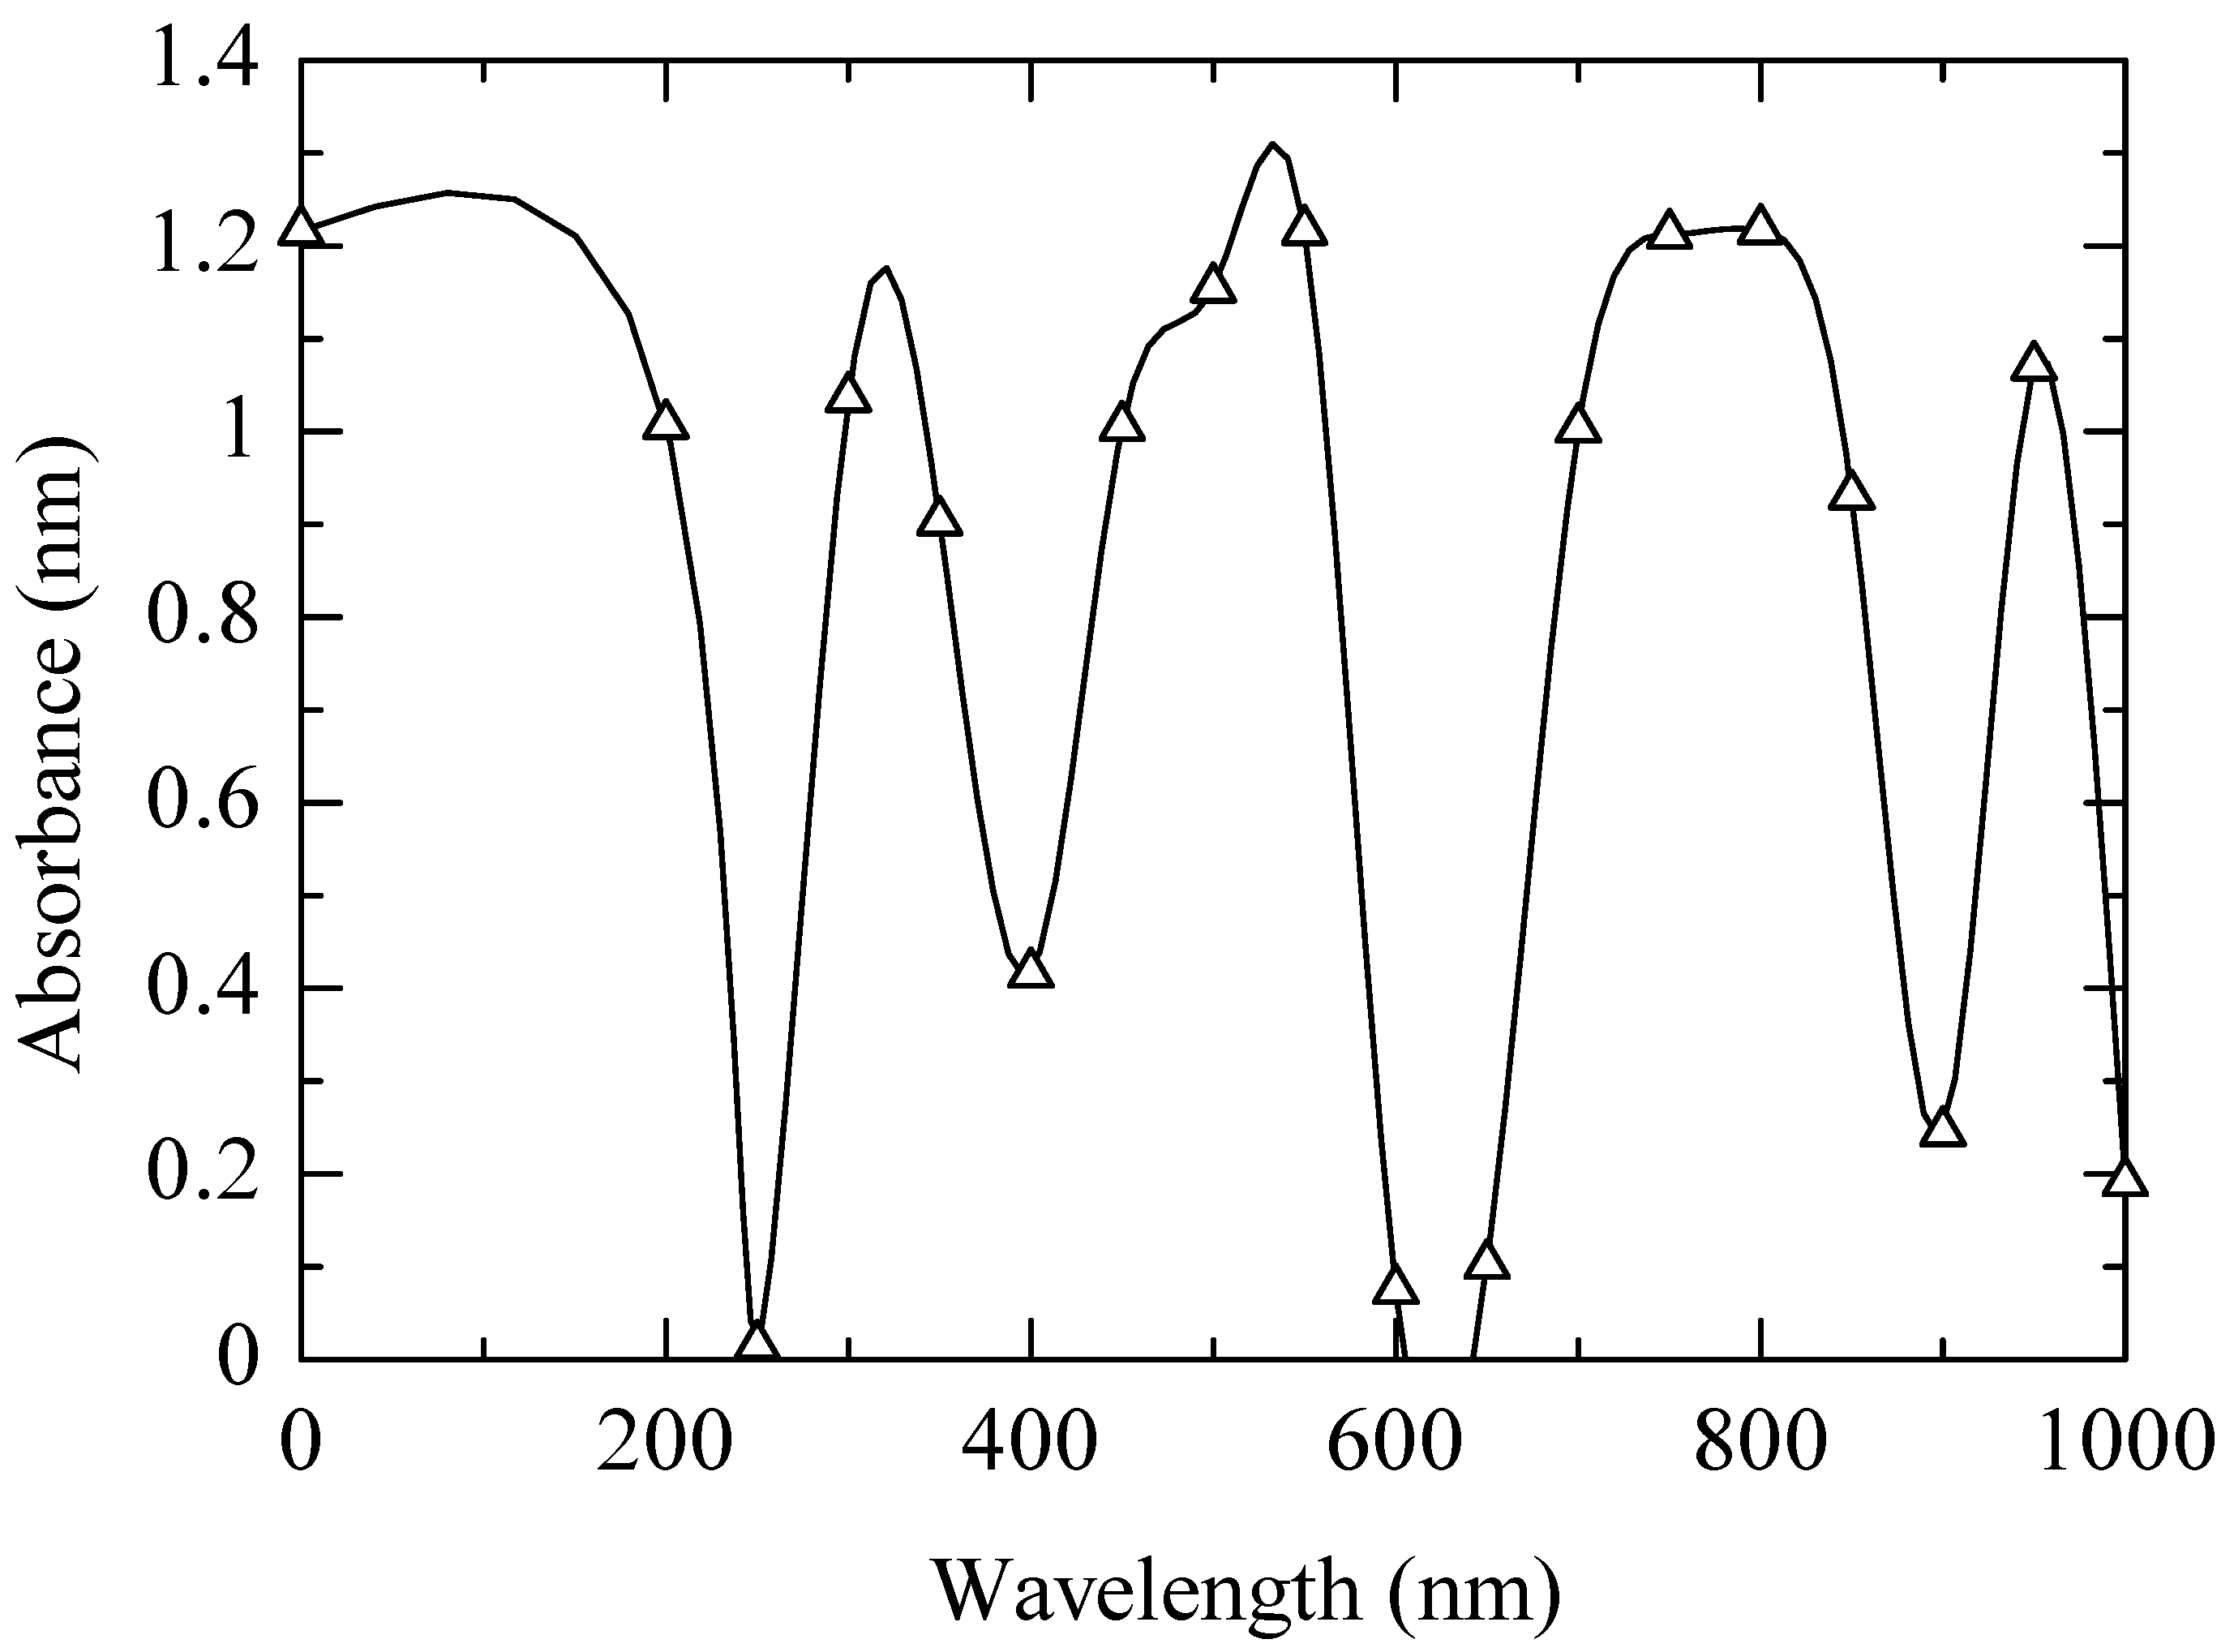
| Wavelength (nm) | Absorbance (nm) |
|---|---|
| 0 | 1.216 |
| 200 | 1.007 |
| 250 | 0.015 |
| 300 | 1.036 |
| 350 | 0.903 |
| 400 | 0.416 |
| 450 | 1.005 |
| 500 | 1.154 |
| 550 | 1.216 |
| 600 | 0.075 |
| 650 | 0.102 |
| 700 | 1.003 |
| 750 | 1.212 |
| 800 | 1.217 |
| 850 | 0.931 |
| 900 | 0.245 |
| 950 | 1.070 |
| 1000 | 0.191 |
Publisher’s Note: MDPI stays neutral with regard to jurisdictional claims in published maps and institutional affiliations. |
© 2022 by the authors. Licensee MDPI, Basel, Switzerland. This article is an open access article distributed under the terms and conditions of the Creative Commons Attribution (CC BY) license (https://creativecommons.org/licenses/by/4.0/).
Share and Cite
Onyelowe, K.C.; Ebid, A.M.; Egwu, U.; Onyia, M.E.; Onah, H.N.; Nwobia, L.I.; Onwughara, I.; Firoozi, A.A. Erodibility of Nanocomposite-Improved Unsaturated Soil Using Genetic Programming, Artificial Neural Networks, and Evolutionary Polynomial Regression Techniques. Sustainability 2022, 14, 7403. https://doi.org/10.3390/su14127403
Onyelowe KC, Ebid AM, Egwu U, Onyia ME, Onah HN, Nwobia LI, Onwughara I, Firoozi AA. Erodibility of Nanocomposite-Improved Unsaturated Soil Using Genetic Programming, Artificial Neural Networks, and Evolutionary Polynomial Regression Techniques. Sustainability. 2022; 14(12):7403. https://doi.org/10.3390/su14127403
Chicago/Turabian StyleOnyelowe, Kennedy C., Ahmed M. Ebid, Uchenna Egwu, Michael E. Onyia, Hyginus N. Onah, Light I. Nwobia, Izuchukwu Onwughara, and Ali Akbar Firoozi. 2022. "Erodibility of Nanocomposite-Improved Unsaturated Soil Using Genetic Programming, Artificial Neural Networks, and Evolutionary Polynomial Regression Techniques" Sustainability 14, no. 12: 7403. https://doi.org/10.3390/su14127403