
Liquid Metal Embrittlement of Advanced High Strength Steel: Experiments and Damage Modeling

 ,
,
Abstract
:
1. Introduction
2. Materials and Methods
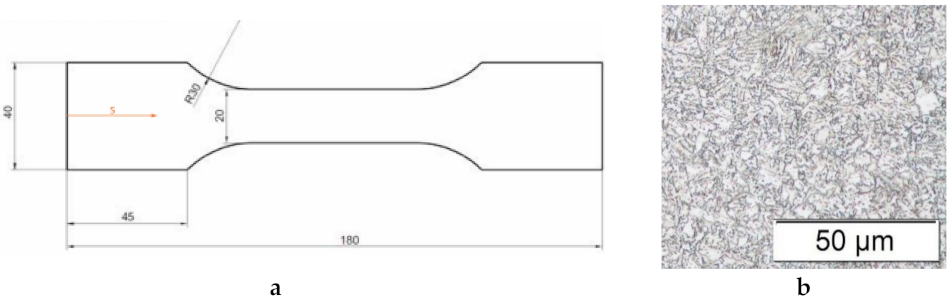
2.1. Experimental
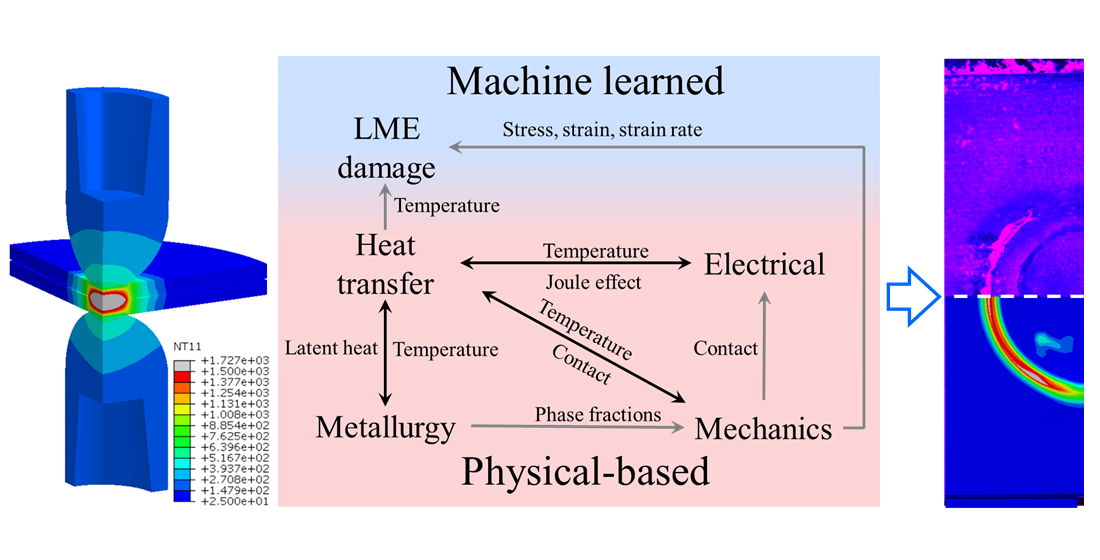
2.2. Modeling
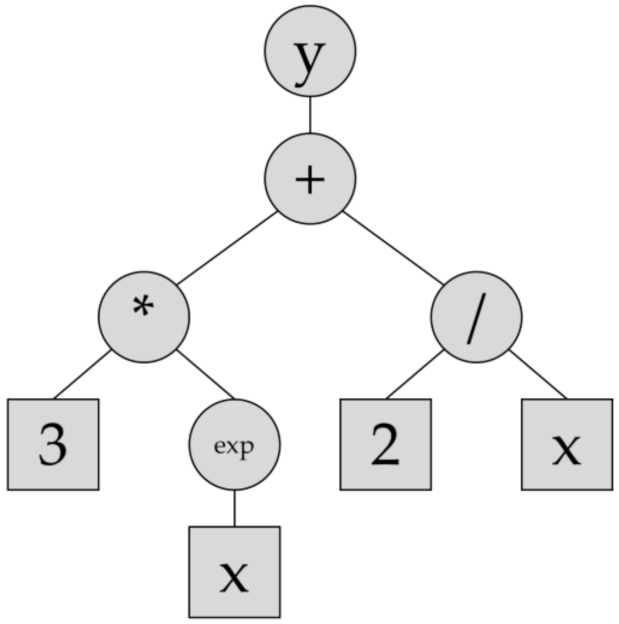
2.3. Symbolic Regression
2.4. Finite Element Method
3. Results and Discussion
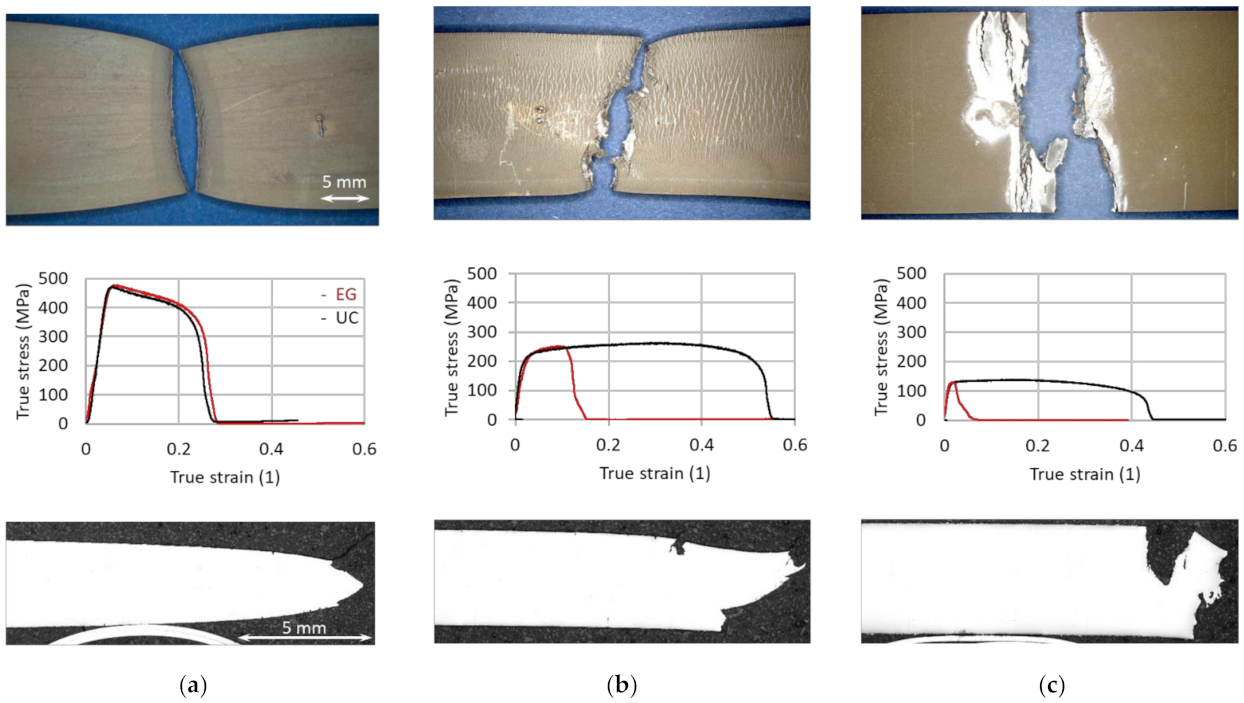
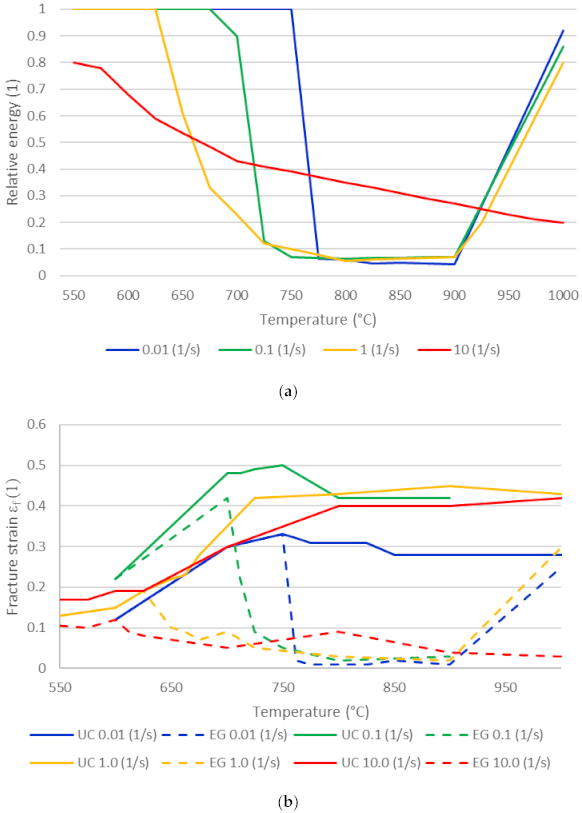
3.1. Experimental Results
3.2. Damage Model
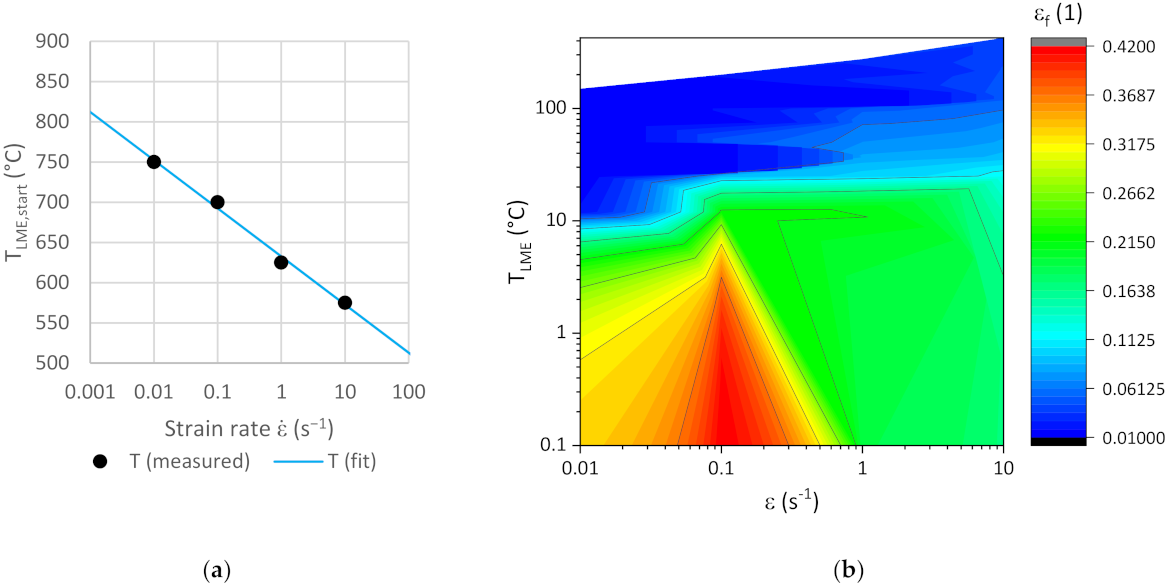
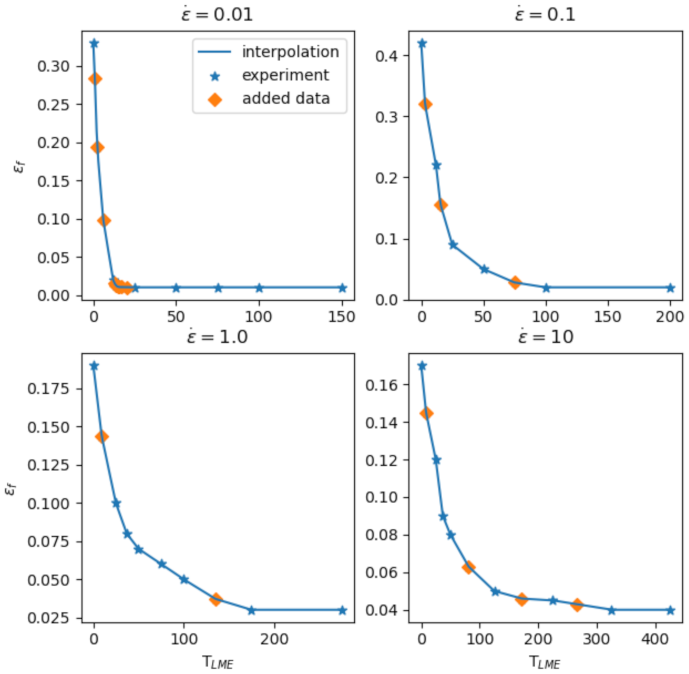
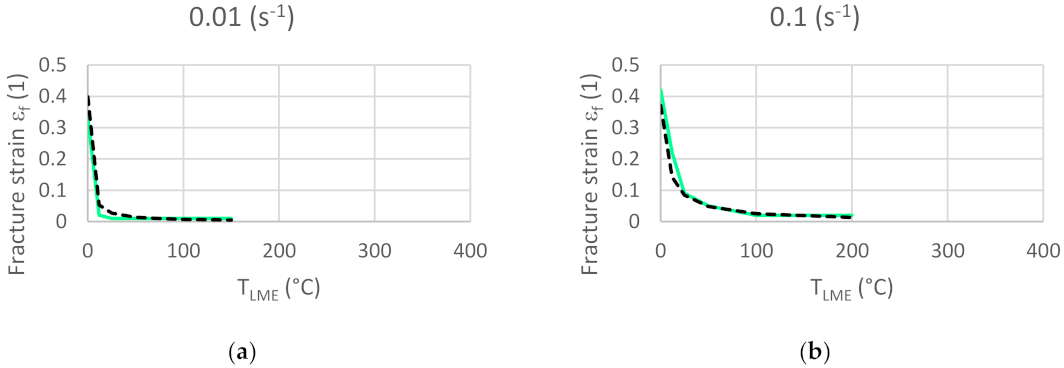
3.2.1. Symbolic Regression
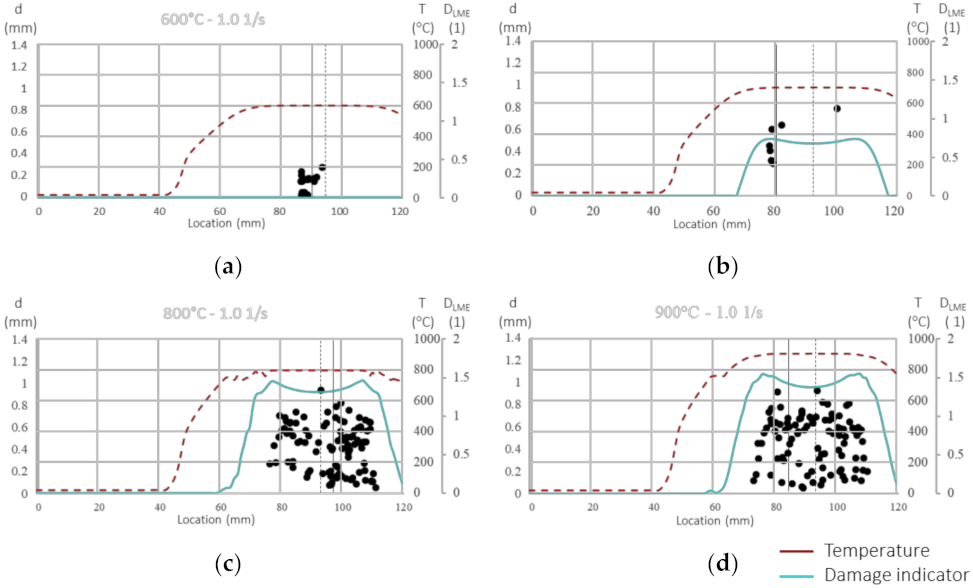
3.2.2. Damage Indicator
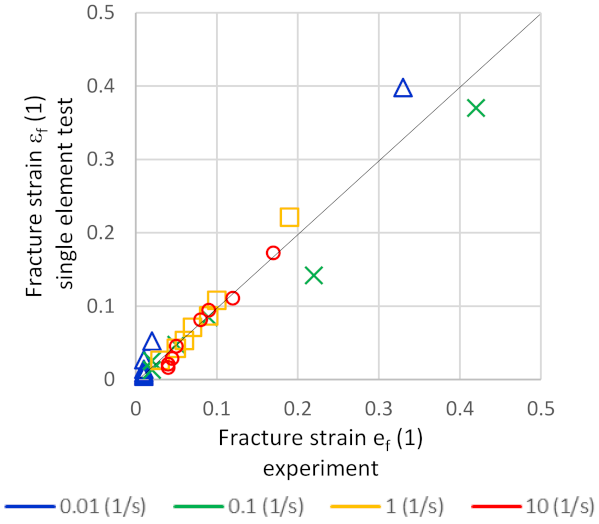
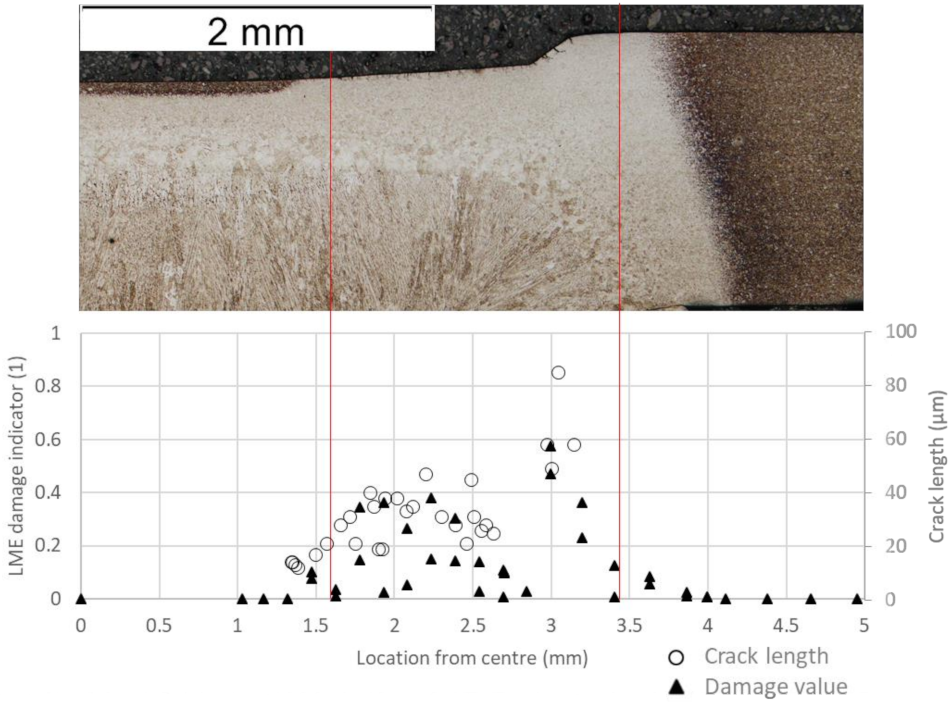
3.3. Model Validation
4. Conclusions
- Hot tensile tests are an appropriate means to reproducibly and quantitively characterize the LME susceptibility of materials.
- The commonly applied rule of thumb for LME occurring in AHSS is based on plastic strain and requires temperatures to be above 700 °C. This paper offers a new perspective in that it shows that LME can be found well beneath austenite’s start temperature, which indicates that not only austenite but also ferrite and martensite are prone to LME.
- Symbolic regression was successfully applied to support the damage modeling and delivered robust results.
- The developed and FE implemented damage model was validated by two different means and can be applied in, for example, RSW process design.
Author Contributions
Funding
Institutional Review Board Statement
Informed Consent Statement
Data Availability Statement
Acknowledgments
Conflicts of Interest
References
- Kondratiuk, J.; Kuhn, P.; Labrenz, E.; Bischoff, C. Zinc coatings for hot sheet metal forming: Comparison of phase evolution and microstructure during heat treatment. Surf. Coat. Technol. 2011, 205, 4141–4153. [Google Scholar] [CrossRef]
- Hamouche-Hadjem, Z.; Auger, T.; Guillot, I.; Gorse, D. Susceptibility to LME of 316L and T91 steels by LBE: Effect of strain rate. J. Nucl. Mater. 2008, 376, 317–321. [Google Scholar] [CrossRef]
- Murugan, S.P.; Jeon, J.B.; Ji, C.; Park, Y. Liquid zinc penetration induced intergranular brittle cracking in resistance spot welding of galvannealed advanced high strength steel Liquid zinc penetration induced intergranular brittle cracking in resistance spot welding of galvannealed advanced high strength steel. Weld. World 2020. [Google Scholar] [CrossRef]
- Razmpoosh, M.H.; Digiovanni, C.; Zhou, Y.N.; Biro, E. Progress in Materials Science Pathway to understand liquid metal embrittlement (LME) in Fe-Zn couple: From fundamentals toward application. Prog. Mater. Sci. 2021, 121, 100798. [Google Scholar] [CrossRef]
- Razmpoosh, M.H.; Langelier, B.; Marzbanrad, E.; Zurob, H.S.; Zhou, N.; Biro, E. Acta Materialia Atomic-scale Investigation of Liquid-Metal-Embrittlement Crack-path: Revealing Mechanism and Role of Grain Boundary Chemistry. Acta Mater. 2021, 204, 116519. [Google Scholar] [CrossRef]
- Sierlinger, R.; Gruber, M. A cracking good story about liquid metal embrittlement during spot welding of advanced high strength steels. In White Paper; voestalpine Stahl GmbH: Linz, Austria, 2017. [Google Scholar]
- Jung, G.; Woo, I.S.; Suh, D.W.; Kim, S.J. Liquid Zn assisted embrittlement of advanced high strength steels with different microstructures. Met. Mater. Int. 2016, 22, 187–195. [Google Scholar] [CrossRef]
- Beal, C.; Kleber, X.; Fabregue, D.; Bouzekri, M. Embrittlement of a zinc coated high manganese TWIP steel. Mater. Sci. Eng. A 2012, 543, 76–83. [Google Scholar] [CrossRef]
- Ashiri, R.; Shamanian, M.; Salimijazi, H.R.; Haque, M.A.; Ji, C.W.; Park, Y. Do Erratum: Supercritical area and critical nugget diameter for liquid metal embrittlement of Zn-coated twinning induced plasticity steels. Scr. Mater. 2016, 112, 156. [Google Scholar] [CrossRef]
- Prabitz, K.M.; Ecker, W.; Borchert, M.; Antretter, T.; Schubert, H.; Hilpert, B.; Gruber, M.; Sierlinger, R. Multiphysics finite element simulation of resistance spot welding to evaluate liquid metal embrittlement in advanced high strength steels. Math. Model. weld Phenom. 2019, 12, 783–793. [Google Scholar] [CrossRef]
- Ersoy, F.; Verbeken, K.; Gavrilov, S. Influence of displacement rate and temperature on the severity of liquid metal embrittlement of T91 steel in LBE. Mater. Sci. Eng. A 2021, 800, 140259. [Google Scholar] [CrossRef]
- Scheiber, D.; Prabitz, K.M.; Romaner, L.; Ecker, W. The influence of alloying on Zn liquid metal embrittlement in steels. Acta Mater. 2020. [Google Scholar] [CrossRef]
- Bhattacharya, D.; Cho, L.; Van Der Aa, E.; Pichler, A.; Pottore, N.; Findley, K.O.; Speer, J.G. Influence of the Starting Microstructure of an Advanced High Strength Steel on the Characteristics of Zn-Assisted Liquid Metal Embrittlement. Mater. Sci. Eng. A 2020, 140391. [Google Scholar] [CrossRef]
- Beal, C. Mechanical Behaviour of a New Automotive High Manganese TWIP Steel in the Presence of Liquid Zinc. Ph.D. Thesis, INSA Lyon, Villeurbanne, France, 2011. [Google Scholar]
- Frei, J.; Biegler, M.; Rethmeier, M.; Böhne, C.; Frei, J.; Biegler, M. Investigation of liquid metal embrittlement of dual phase steel joints by electro-thermomechanical spot-welding simulation electro-thermomechanical spot-welding simulation. Sci. Technol. Weld. Join. 2019, 24, 624–633. [Google Scholar] [CrossRef]
- Frei, J.; Rethmeier, M. Susceptibility of electrolytically galvanized dual-phase steel sheets to liquid metal embrittlement during resistance spot welding. Weld. World 2018, 1031–1037. [Google Scholar] [CrossRef]
- Auger, T.; Hamouche, Z.; Medina-Almazàn, L.; Gorse, D. Liquid metal embrittlement of T91 and 316L steels by heavy liquid metals: A fracture mechanics assessment. J. Nucl. Mater. 2008, 377, 253–260. [Google Scholar] [CrossRef]
- Legris, A.; Nicaise, G.; Vogt, J.B.; Foct, J.; Gorse, D.; Vancon, D. Embrittlement of a martensitic steel by liquid lead. Scr. Mater. 2000, 43, 997–1001. [Google Scholar] [CrossRef]
- Beal, C.; Kleber, X.; Fabregue, D.; Bouzekri, M. Liquid zinc embrittlement of twinning-induced plasticity steel. Scr. Mater. 2012, 66, 1030–1033. [Google Scholar] [CrossRef]
- Ling, Z.; Wang, M.; Kong, L.; Chen, K. Towards an explanation of liquid metal embrittlement cracking in resistance spot welding of dissimilar steels. Mater. Des. 2020, 195, 109055. [Google Scholar] [CrossRef]
- Razmpoosh, M.H.; Biro, E.; Chen, D.L.; Goodwin, F.; Zhou, Y. Liquid metal embrittlement in laser lap joining of TWIP and medium-manganese TRIP steel: The role of stress and grain boundaries. Mater. Charact. 2018, 145, 627–633. [Google Scholar] [CrossRef]
- Lee, H.; Chul, M.; Su, S.; Kim, S.; Song, T.; Kim, S.; Seop, H.; Kim, N.J.; Lee, S. Microstructural evolution of liquid metal embrittlement in resistance-spot-welded galvanized TWinning-Induced Plasticity (TWIP) steel sheets. Mater. Charact. 2019, 147, 233–241. [Google Scholar] [CrossRef]
- Böhne, C.; Meschut, G.; Biegler, M.; Frei, J.; Böhne, C. Prevention of liquid metal embrittlement cracks in resistance spot welds by adaption of electrode geometry adaption of electrode geometry. Sci. Technol. Weld. Join. 2020, 25, 303–310. [Google Scholar] [CrossRef]
- Dancette, S. Effect of Severe Welding Conditions on Liquid Metal Embrittlement of a 3rd-Generation Advanced High-Strength Steel. Metals 2020, 10, 1166. [Google Scholar] [CrossRef]
- Deutsches Institut für Normung (DIN). DIN EN ISO 5821:2010. Resistance Welding—Spot Welding Electrode Caps. 2020. Available online: https://www.beuth.de/de/norm/din-en-iso-5821/123603505 (accessed on 24 August 2021).
- Deutsches Kupferinstitut. CuCr1Zr. 2005, pp. 1–9. Available online: https://www.kupferinstitut.de/wp-content/uploads/2019/11/CuCr1Zr.pdf (accessed on 30 August 2021).
- Koza, J.R. Genetic Programming: Vol. 1, on the Programming of Computers by Means of Natural Selection; MIT Press: Cambridge, MA, USA, 1992. [Google Scholar]
- Heuristic and Evolutionary Algorithms Laboratory. HeuristicLab 3.3.15, (2019). Available online: http://dev.heuristiclab.com (accessed on 10 July 2020).
- Dassault Systems Simulia Corp. ABAQUS 2019. 2019. Available online: https://www.3ds.com/products-services/simulia/products/abaqus/abaqusstandard/ (accessed on 24 August 2021).
- Prabitz, K.M.; Pichler, M.; Antretter, T.; Schubert, H.; Hilpert, B.; Gruber, M.; Sierlinger, R.; Ecker, W. Validated multiphysical finite element modelling of the spot welding process of the advanced high strength steel DP1200HD. Materials 2021, 14. [Google Scholar] [CrossRef]
- Zhang, Y.; Evans, J.R.G. Corrected Values for Boiling Points and Enthalpies of Vaporization of Elements. J. Chem. Eng. Data 2011, 56, 328–337. [Google Scholar] [CrossRef] [Green Version]
- Bhattacharya, D.; Cho, L.; Marshall, D.; Walker, M.; Van Der Aa, E.; Pichler, A.; Findley, K.O.; Speer, J.G. Liquid metal embrittlement susceptibility of two Zn-Coated advanced high strength steels of similar strengths. Mater. Sci. Eng. A 2021, 141569. [Google Scholar] [CrossRef]
- Kim, J.; Murugan, S.P.; Kim, J.; Yook, W.; Lee, C.; Ji, C.; Jeon, J.B.; Park, Y. Liquid metal embrittlement during the resistance spot welding of galvannealed steels: Synergy of liquid Zn, α-Fe (Zn) and tensile stress. Sci. Technol. Weld. Join. 2021. [Google Scholar] [CrossRef]
- Van den Bosch, J.; Hosemann, P.; Almazouzi, A.; Maloy, S.A. Liquid metal embrittlement of silicon enriched steel for nuclear applications. J. Nucl. Mater. 2010, 398, 116–121. [Google Scholar] [CrossRef]
- Gorse, D.; Auger, T.; Vogt, J.B.; Serre, I.; Weisenburger, A.; Gessi, A.; Agostini, P.; Fazio, C.; Hojna, A.; Di Gabriele, F.; et al. Influence of liquid lead and lead-bismuth eutectic on tensile, fatigue and creep properties of ferritic/martensitic and austenitic steels for transmutation systems. J. Nucl. Mater. 2011, 415, 284–292. [Google Scholar] [CrossRef]
- Liu, J.; Yan, W.; Sha, W.; Wang, W.; Shan, Y.; Yang, K. Effects of temperature and strain rate on the tensile behaviors of SIMP steel in static lead bismuth eutectic. J. Nucl. Mater. 2016, 473, 189–196. [Google Scholar] [CrossRef] [Green Version]
- Barthelmie, J.; Schram, A.; Wesling, V. Liquid Metal Embrittlement in Resistance Spot Welding and Hot Tensile Tests of Surface-refined TWIP Steels. In Proceedings of the 18th Chemnitz Seminar on Materials Engineering, Chemnitz, Germany, 10–11 March 2016. IOP Conf. Ser. Mater. Sci. Eng. 2016, 118, 012002. [Google Scholar] [CrossRef] [Green Version]
- Kang, J.; Hong, S.; Kim, J.; Kim, S. Zn-induced liquid metal embrittlement of galvanized high-Mn steel: Strain-rate dependency. Mater. Sci. Eng. A 2020, 793, 139996. [Google Scholar] [CrossRef]
- Rice, B.J.R.; Tracey, D.M. On the ductile enlargement of voids in triaxial stress fields∗. J. Mech. Phys. Solids 1969, 17, 201–217. [Google Scholar] [CrossRef] [Green Version]
- Fischer, F.D.; Kolednik, O.; Shan, G.X.; Rammersdorfer, F.G. A note on calibration of ductile failure damage indicators. Int. J. Fract. 1995, 73, 345–357. [Google Scholar] [CrossRef]


| C (%) | Si (%) | Mn (%) | Cr (%) | Cu (%) | Nb (%) | Fe |
|---|---|---|---|---|---|---|
| 0.21 | 1.46 | 2.53 | 0.03 | 0.016 | 0.002 | Balanced |
Publisher’s Note: MDPI stays neutral with regard to jurisdictional claims in published maps and institutional affiliations. |
© 2021 by the authors. Licensee MDPI, Basel, Switzerland. This article is an open access article distributed under the terms and conditions of the Creative Commons Attribution (CC BY) license (https://creativecommons.org/licenses/by/4.0/).
Share and Cite
Prabitz, K.M.; Asadzadeh, M.Z.; Pichler, M.; Antretter, T.; Beal, C.; Schubert, H.; Hilpert, B.; Gruber, M.; Sierlinger, R.; Ecker, W. Liquid Metal Embrittlement of Advanced High Strength Steel: Experiments and Damage Modeling. Materials 2021, 14, 5451. https://doi.org/10.3390/ma14185451
Prabitz KM, Asadzadeh MZ, Pichler M, Antretter T, Beal C, Schubert H, Hilpert B, Gruber M, Sierlinger R, Ecker W. Liquid Metal Embrittlement of Advanced High Strength Steel: Experiments and Damage Modeling. Materials. 2021; 14(18):5451. https://doi.org/10.3390/ma14185451
Chicago/Turabian StylePrabitz, Konstantin Manuel, Mohammad Zhian Asadzadeh, Marlies Pichler, Thomas Antretter, Coline Beal, Holger Schubert, Benjamin Hilpert, Martin Gruber, Robert Sierlinger, and Werner Ecker. 2021. "Liquid Metal Embrittlement of Advanced High Strength Steel: Experiments and Damage Modeling" Materials 14, no. 18: 5451. https://doi.org/10.3390/ma14185451