
EEG-Based Emotion Recognition Using Deep Learning and M3GP
by
 , , and
Adrian Rodriguez Aguiñaga
1,†,‡ ,
,
Luis Muñoz Delgado
1,‡,
Víctor Raul López-López
1,‡ and
Andrés Calvillo Téllez
2,*,‡
1
Computation, Aeronautical and Mechanical Departments of the Tecnológico Nacional de México Campus, Tijuana 22414, Mexico
2
Telecommunications Department of the Instituto Politécnico Nacional, Tijuana 22435, Mexico
*
Author to whom correspondence should be addressed.
†
Current address: Av Castillo de Chapultepec 562, Tomas Aquino, Tijuana 22414, Mexico.
‡
These authors contributed equally to this work.
Appl. Sci. 2022, 12(5), 2527; https://doi.org/10.3390/app12052527
Submission received: 27 January 2022
/
Revised: 18 February 2022
/
Accepted: 24 February 2022
/
Published: 28 February 2022
(This article belongs to the Special Issue Applied Cognitive Sciences)
Abstract
:This paper presents the proposal of a method to recognize emotional states through EEG analysis. The novelty of this work lies in its feature improvement strategy, based on multiclass genetic programming with multidimensional populations (M3GP), which builds features by implementing an evolutionary technique that selects, combines, deletes, and constructs the most suitable features to ease the classification process of the learning method. In this way, the problem data can be mapped into a more favorable search space that best defines each class. After implementing the M3GP, the results showed an increment of 14.76% in the recognition rate without changing any settings in the learning method. The tests were performed on a biometric EEG dataset (BED), designed to evoke emotions and record the cerebral cortex’s electrical response; this dataset implements a low cost device to collect the EEG signals, allowing greater viability for the application of the results. The proposed methodology achieves a mean classification rate of 92.1%, and simplifies the feature management process by increasing the separability of the spectral features.
1. Introduction
Machine Learning and EEG
The development of techniques that facilitate human behavior analysis has been progressed notably in the last decade, which has driven the development of machine learning tools and signal processing technology that can perform complex analyses of our environments. This has led to a diversification of analysis techniques and even the development of hardware to analyze our environmental signals, such as intelligent voice assistants and wearable devices that can give a detailed follow-up of our vital signs. Similarly, this development has allowed certain fields, such as the analysis of electroencephalography (EEG) signals, to also notably develop in areas that have previously been restricted by costs and technological limitations.
EEG signal analysis is a non-invasive technique that is widely used to analyze brain activity. Traditionally, the analysis of these signals has focused on the diagnosis and monitoring of medical conditions [1]. However, the interest in this signal has diversified, and machine learning (ML) has played a significant role in EEG signal processing and analysis because it has allowed the development of analysis techniques that successfully perform recognition and classification tasks. Promising results have been achieved in fields as varied as the analysis of mental illness, object manipulation, and cognitive processes [2,3,4,5,6].
A central aspect for the study of EEG signals is the premise of obtaining information directly from the cognitive processes of a person and implementing ML to process traits that allow us to identify, analyze, associate, and even control these processes through cognitive responses [3,7,8]. When analyzing the EEG signals, it is expected that the data are closely related to the phenomenon and cannot be manipulated. However, it is also a technique that is highly susceptible to experimental noise, so signal processing methodologies need to be carefully established.
The novelty of our proposal lies in applying the ML tool M3GP to the conversion of the search space through selecting, combining, deleting, and constructing the most suitable features to ease the classification process of the learning method. This process allows us to improve the classification stage without changing the architectures, which are often obtained through extensive processes.
The literature shows that the community has proposed diverse EEG data processing architectures; some use large and complex neural networks since their features require it [9] and others argue that low complexity architectures could handle the problem but use distinct spectral feature extractions [10,11]. The proposed methodology enables the improvement of the recognition rate for this type of analysis without changing the topology.
Several techniques have been developed for signal processing and feature selection, which have been traditionally based on spectral components [12], since they reduce the computational load for ML processes [11]. Recent literature suggests that automatic feature selection can be achieved using ML algorithms, thereby reducing the signal processing stage and allowing an ML strategy to choose the best-fit features [13,14]. This proposal is based on implementing MP3G to transform and select the most suitable features by considering a spectral stage instead of performing a greedy search.
This work focuses on the BED dataset [15], which was developed to evoke and register emotional stimuli using low cost devices that can help to generalize the results of this type of research and also proposes precise experimentation strategies and performs a rigorous signal treatment process. State-of-the-art (SOA) works, as reported in [16], have demonstrated the viability and importance of implementing new and accessible methodologies that seek the greater applicability of this type of research.
2. Materials and Methods
2.1. Emotions in Machine Learning
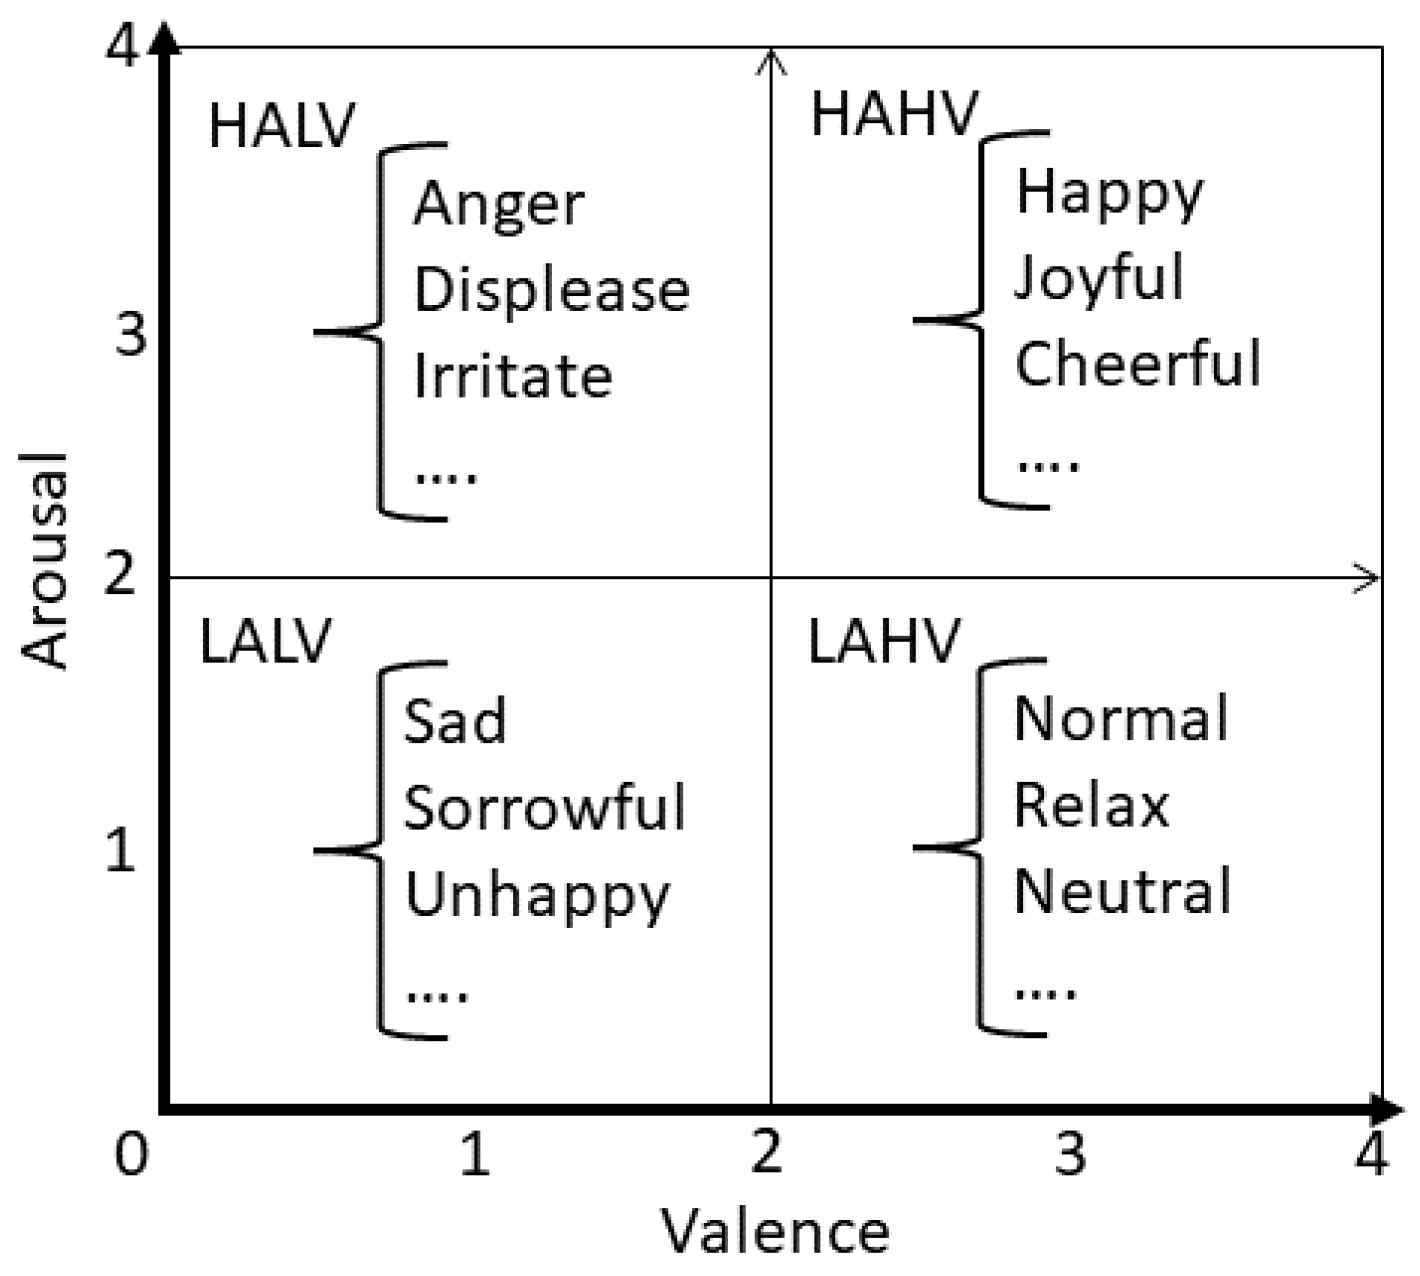
Russell’s arousal and valence levels [17] are used to measure how positive and intense an emotion is. This model subdivides the emotional responses into high arousal–high valence (HAHV), high arousal–low valence (HALV), low arousal–low valence (LALV), and low arousal–high valence (LAHV), as can be seen in Figure 1. We used this four subdivision model to create the classes our the ML process.
2.2. Dataset
This work used the BED, which is a dataset that is specialized for the analysis of emotional states. Although there are other datasets available, such as DEAP or SEED [18,19], BED was conceived and designed with the specific purpose of studying the brain’s response to an emotional stimulus; it is also a novel dataset that demonstrates an extensive and well-designed experimental process. In addition, BED was developed using low cost signal acquisition equipment, specifically the Emotiv EPOC+ [20] headband, which allows the experimental process to have a greater applicability.
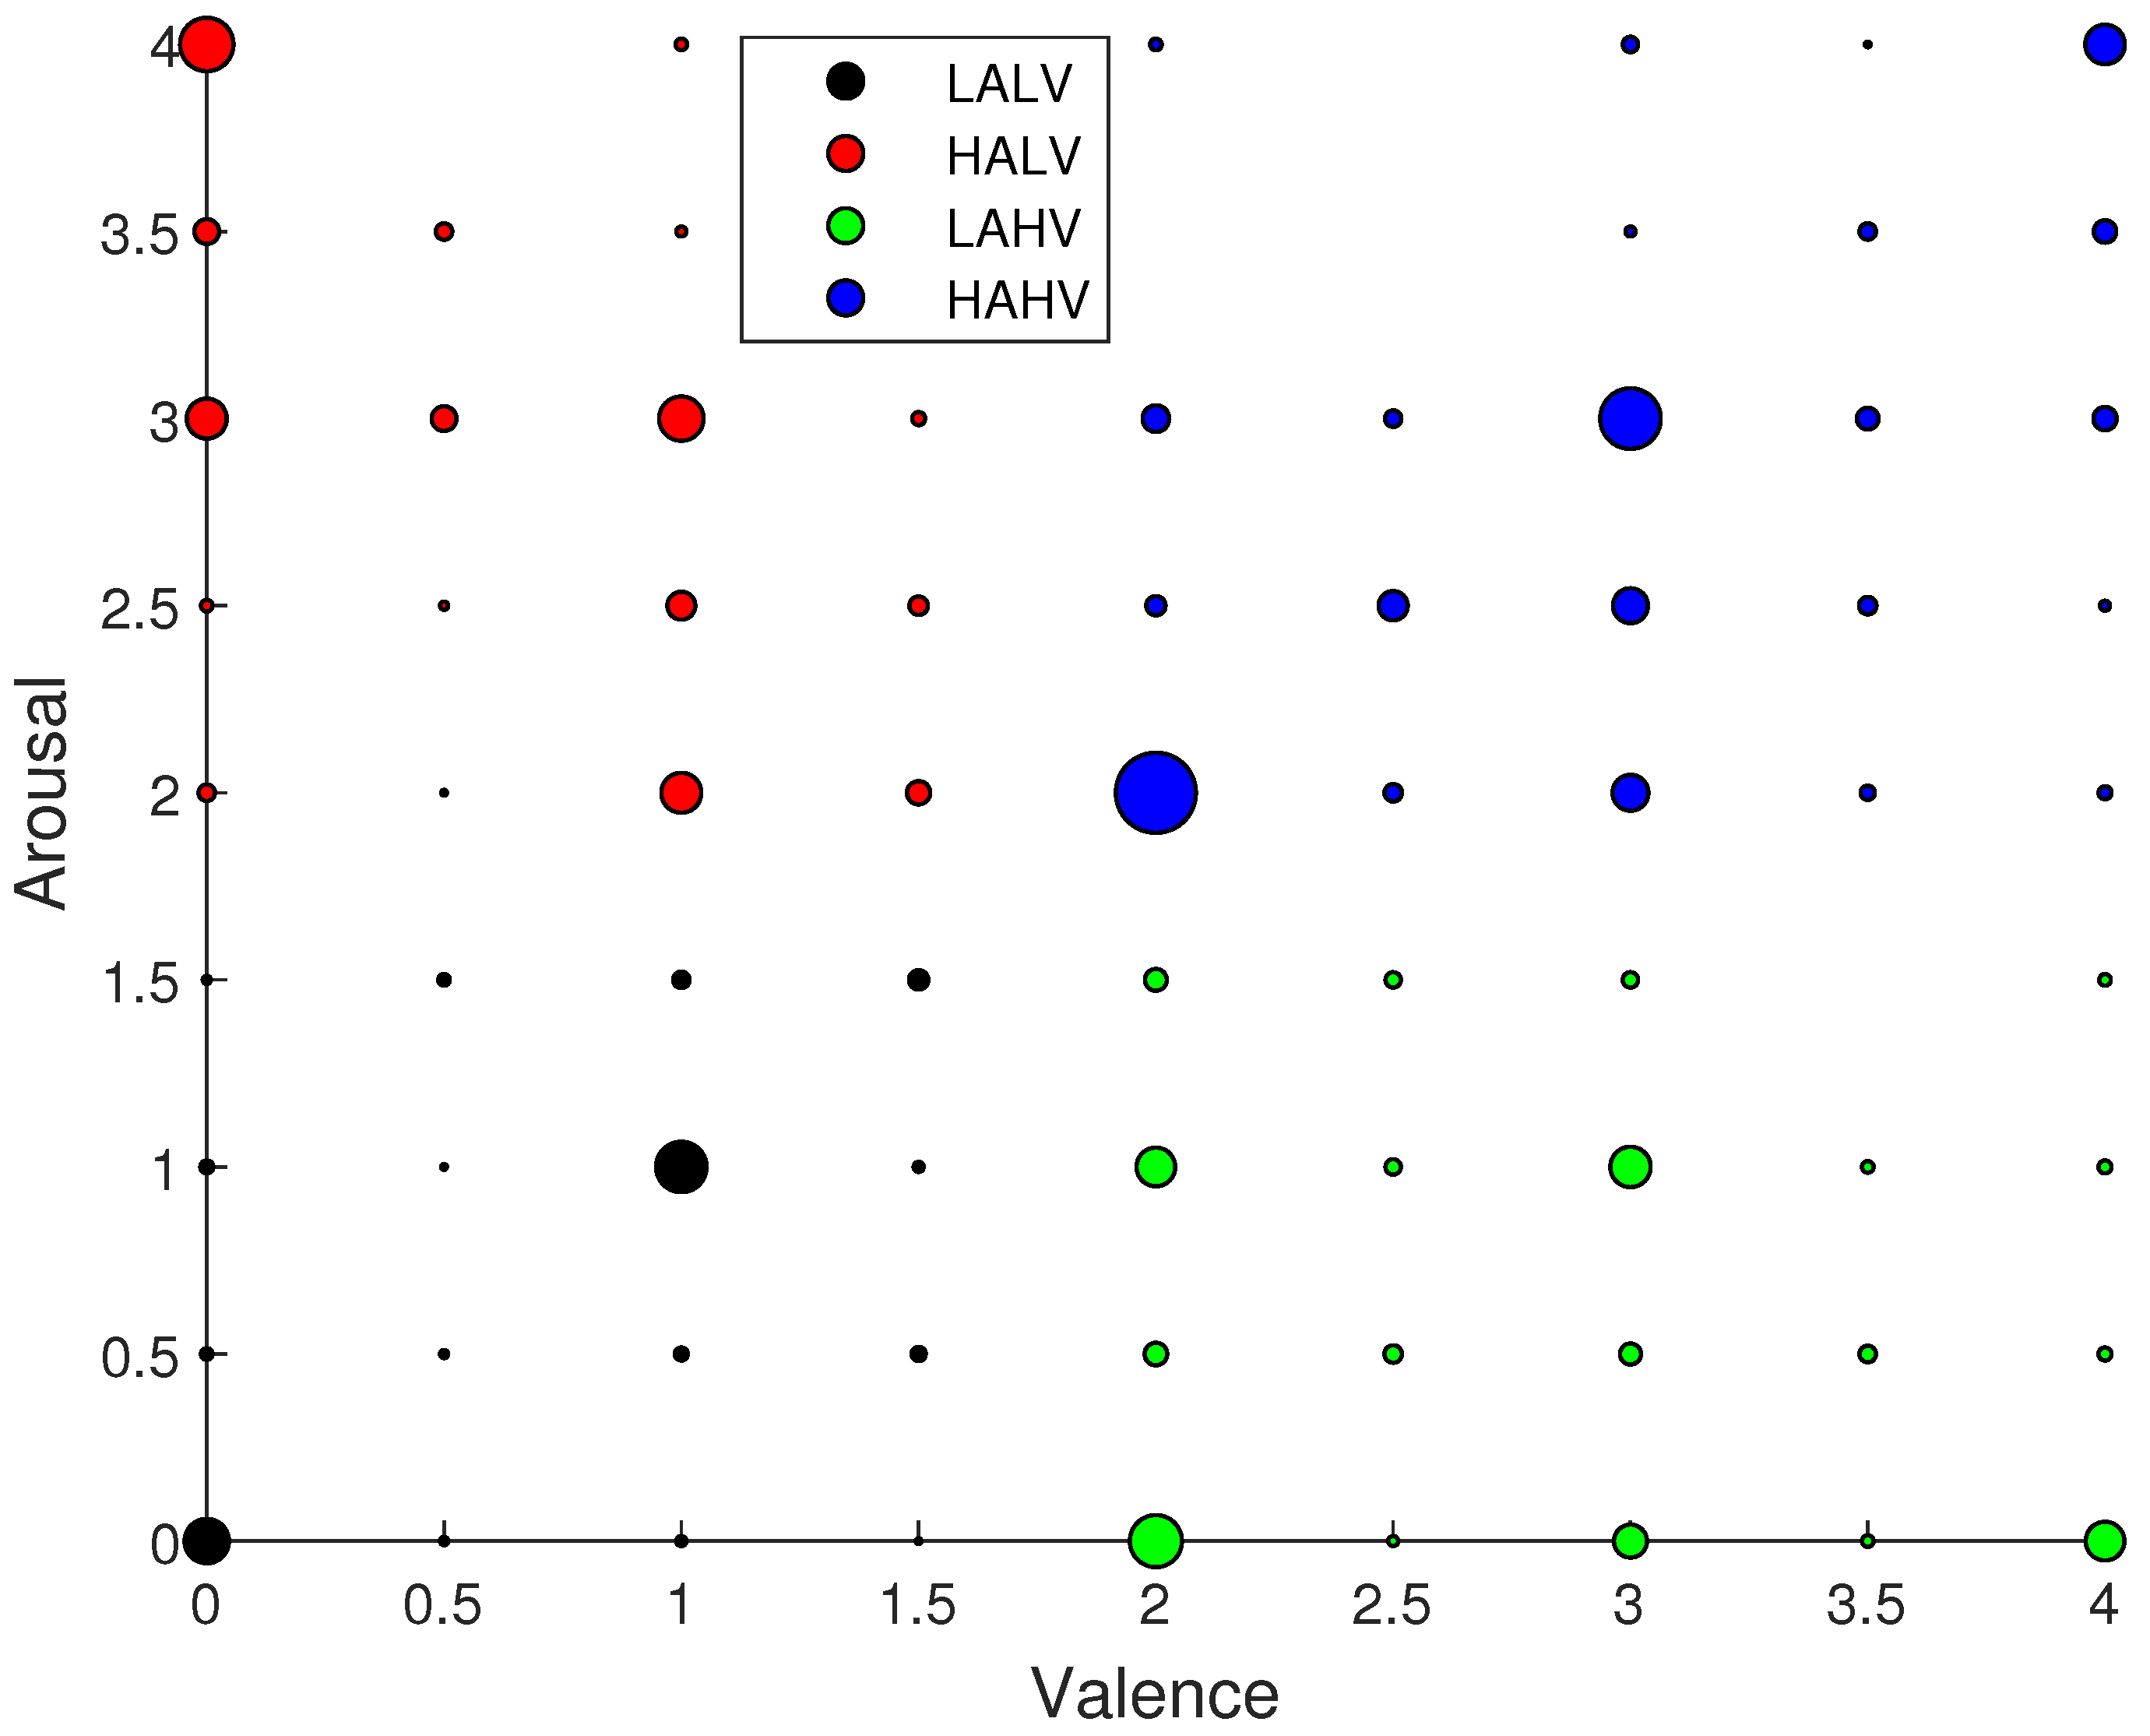
The BED implements a methodology of evoking emotional responses through audiovisual stimuli followed by an arousal and valence analysis. The dataset contains metadata that allow for the association of the expected responses from each stimulus. Even more important is that it reports the experience of the user: each experiment is associated with a survey that records the actual level of arousal and valence experienced by the users (scored on the scale 0–4). We relied on the responses provided by the users to associate each experiment to one of the Russell model classes, as shown in Figure 2. In this way, since we were working according to the user responses, we were able to ensure that we were working with the appropriate information.
The dataset contains 21 healthy participants (18 male and 3 female), aged between 23 and 47 years old. The dataset emphasizes that it was created with the specific purpose of evoking emotions using Visual Evoked Potentials (VEP). The experiment implements a prolonged rest period to mitigate against the fatigue or satiety of the participants by dividing the experimental sessions into two days.
Emotiv EPOC+ is a low cost wireless headset that records EEG signals using 16 contact sensors at 256 Hz. BED considers the 14 channels that are closely aligned with the modified combinatorial nomenclature (MCN) of the 10–20 system (AF3, F7, F3, FC5, T7, P7, O1, O2, P8, T8, FC6, F4, F8, and AF4) and the M1 and M2 mastoid locations are used as the references. Using this device was one of the main aspects of this analysis exercise since it is a portable device and a viable alternative to much more expensive equipment. The computational resources and software implemented in the development of this project are: Python Scikit Learn libraries, Python 3.7.6, NumPy 1.18.5, Pillow 8.3.1, imutils 0.5.4, TensorFlow GPU 1.15.0, keras 2.2.4, matplotlib 3.1.1, SciPy 1.2.0., Intel i7 (4th gen), 3.6 GHz, 16 RAM, and Nvidia GeForce 1080.
2.3. Feature Extraction
This work implemented two feature selection strategies. First, we used a configuration similar to that presented in [15] to obtain our reference by using the features already contained in the dataset. Second, we implemented a feature selection and transformation through a genetic programming (GP) [21] algorithm called M3GP [22], which helped us to improve the recognition rate.
Spectral Features Arrangement
This work uses 518,154 spectral features contained in the dataset (mel-frequency cepstral (MFCC), autoregression reflection coefficients (ARRC), and spectral features (SPEC)) distributed into four categories, as presented in Figure 2. Recent advances have proven that artificial intelligence (AI) and ML have numerous applications in all engineering fields for processing and analyzing signals [23,24,25].
2.4. Feature Transformation by M3GP
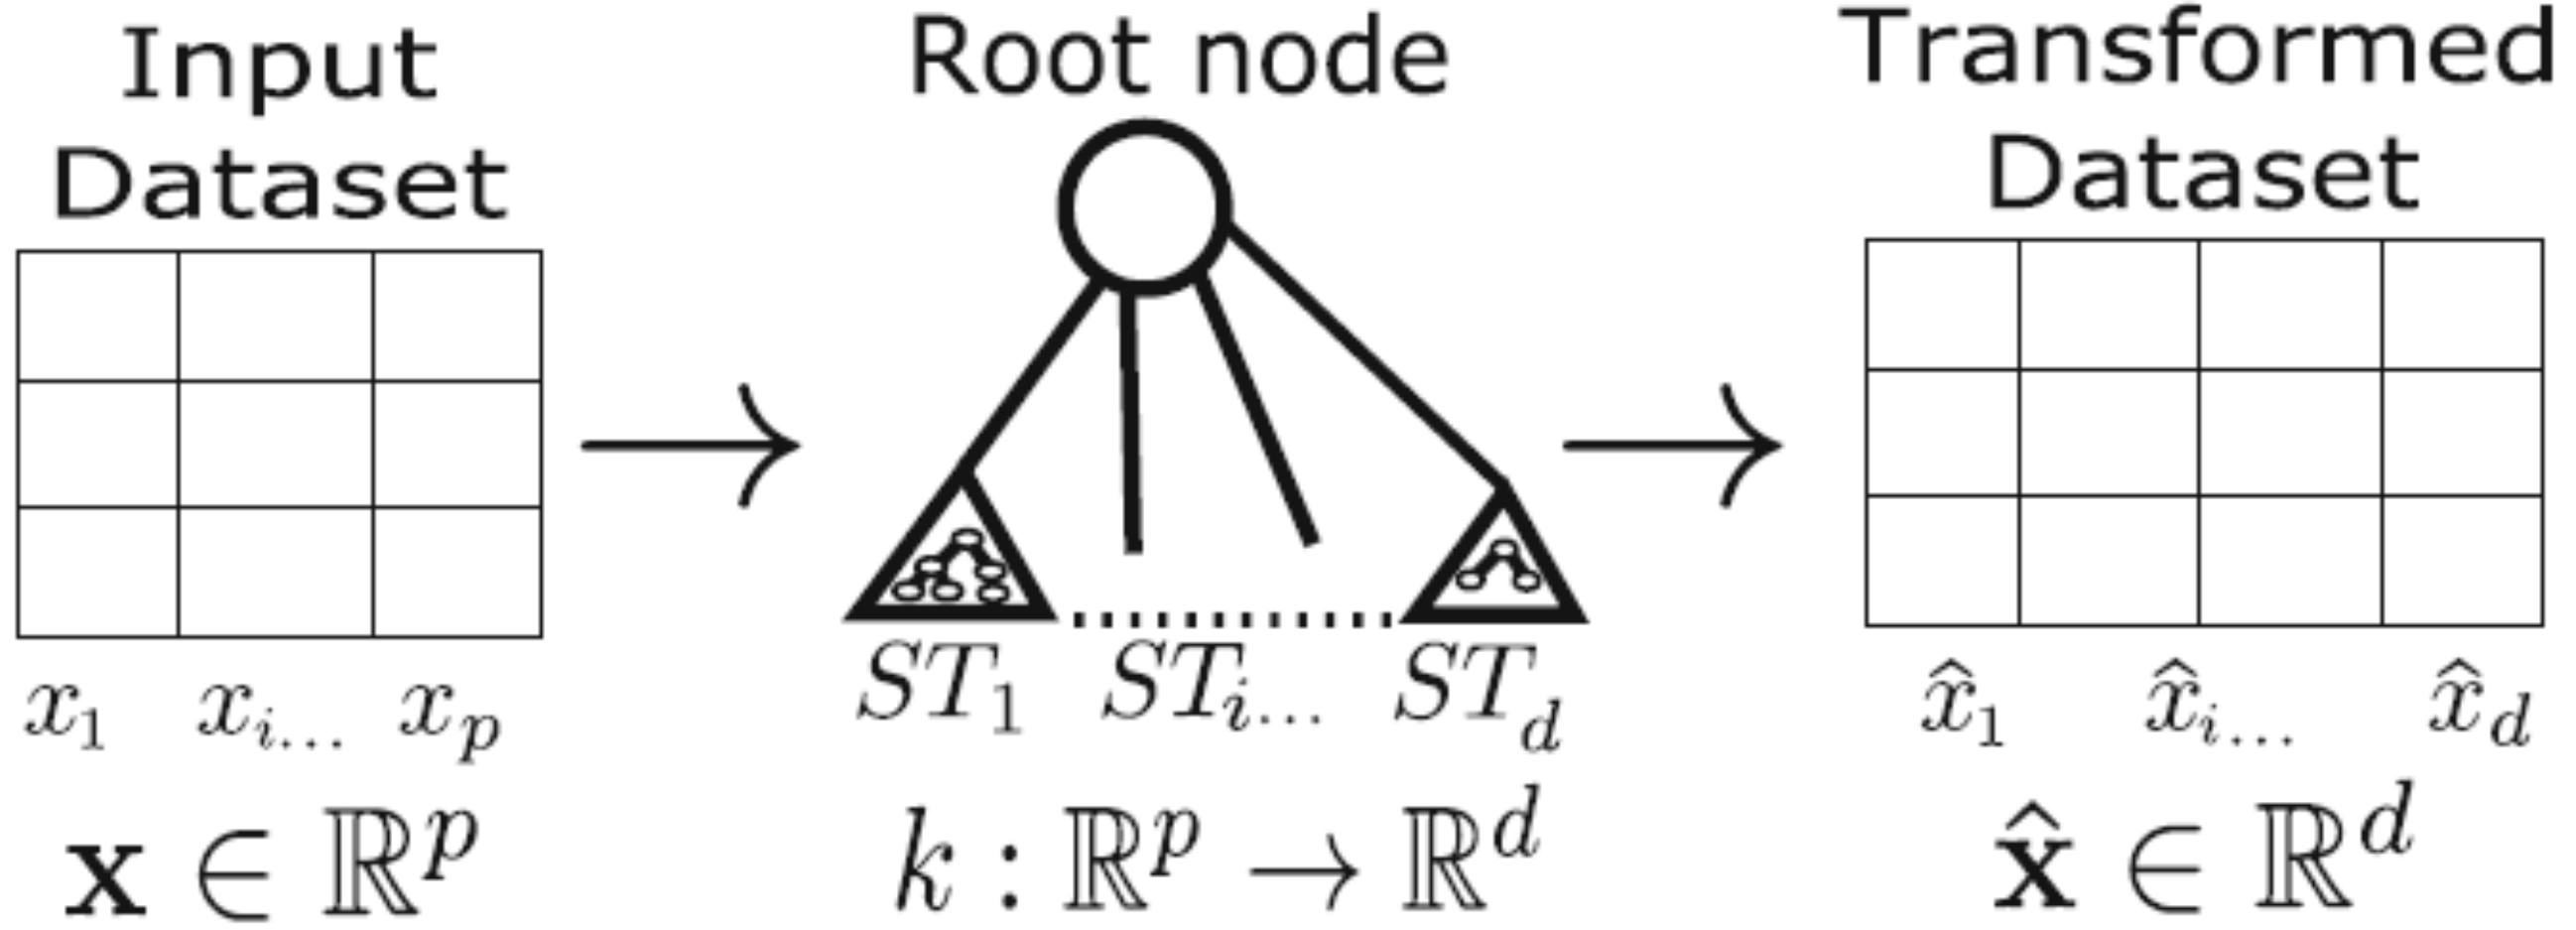
M3GP is an ML tool based on genetic programming that improves the search space in terms of locally maximizing the distance between classes and thus, increasing the performance of the classification and recognition algorithms. Our method used a variant of tree-based GP called multidimensional multiclass GP with multidimensional populations (M3GP) [22], which is a wrapper approach for supervised classification and regression [26]. M3GP enables a transformation of the form k from into using a special tree representation (see Figure 3), in essence mapping the p input features of the problem to a new feature space of size d. Afterward, M3GP applies the Mahalanobis distance classifier [27] to measure the quality of each transformation based on classification accuracy. In other words, M3GP is a wrapper-based GP classifier for multiclass problems that performs a feature treatment of the input data, thereby obtaining new data features with which the classification method can achieve better results.
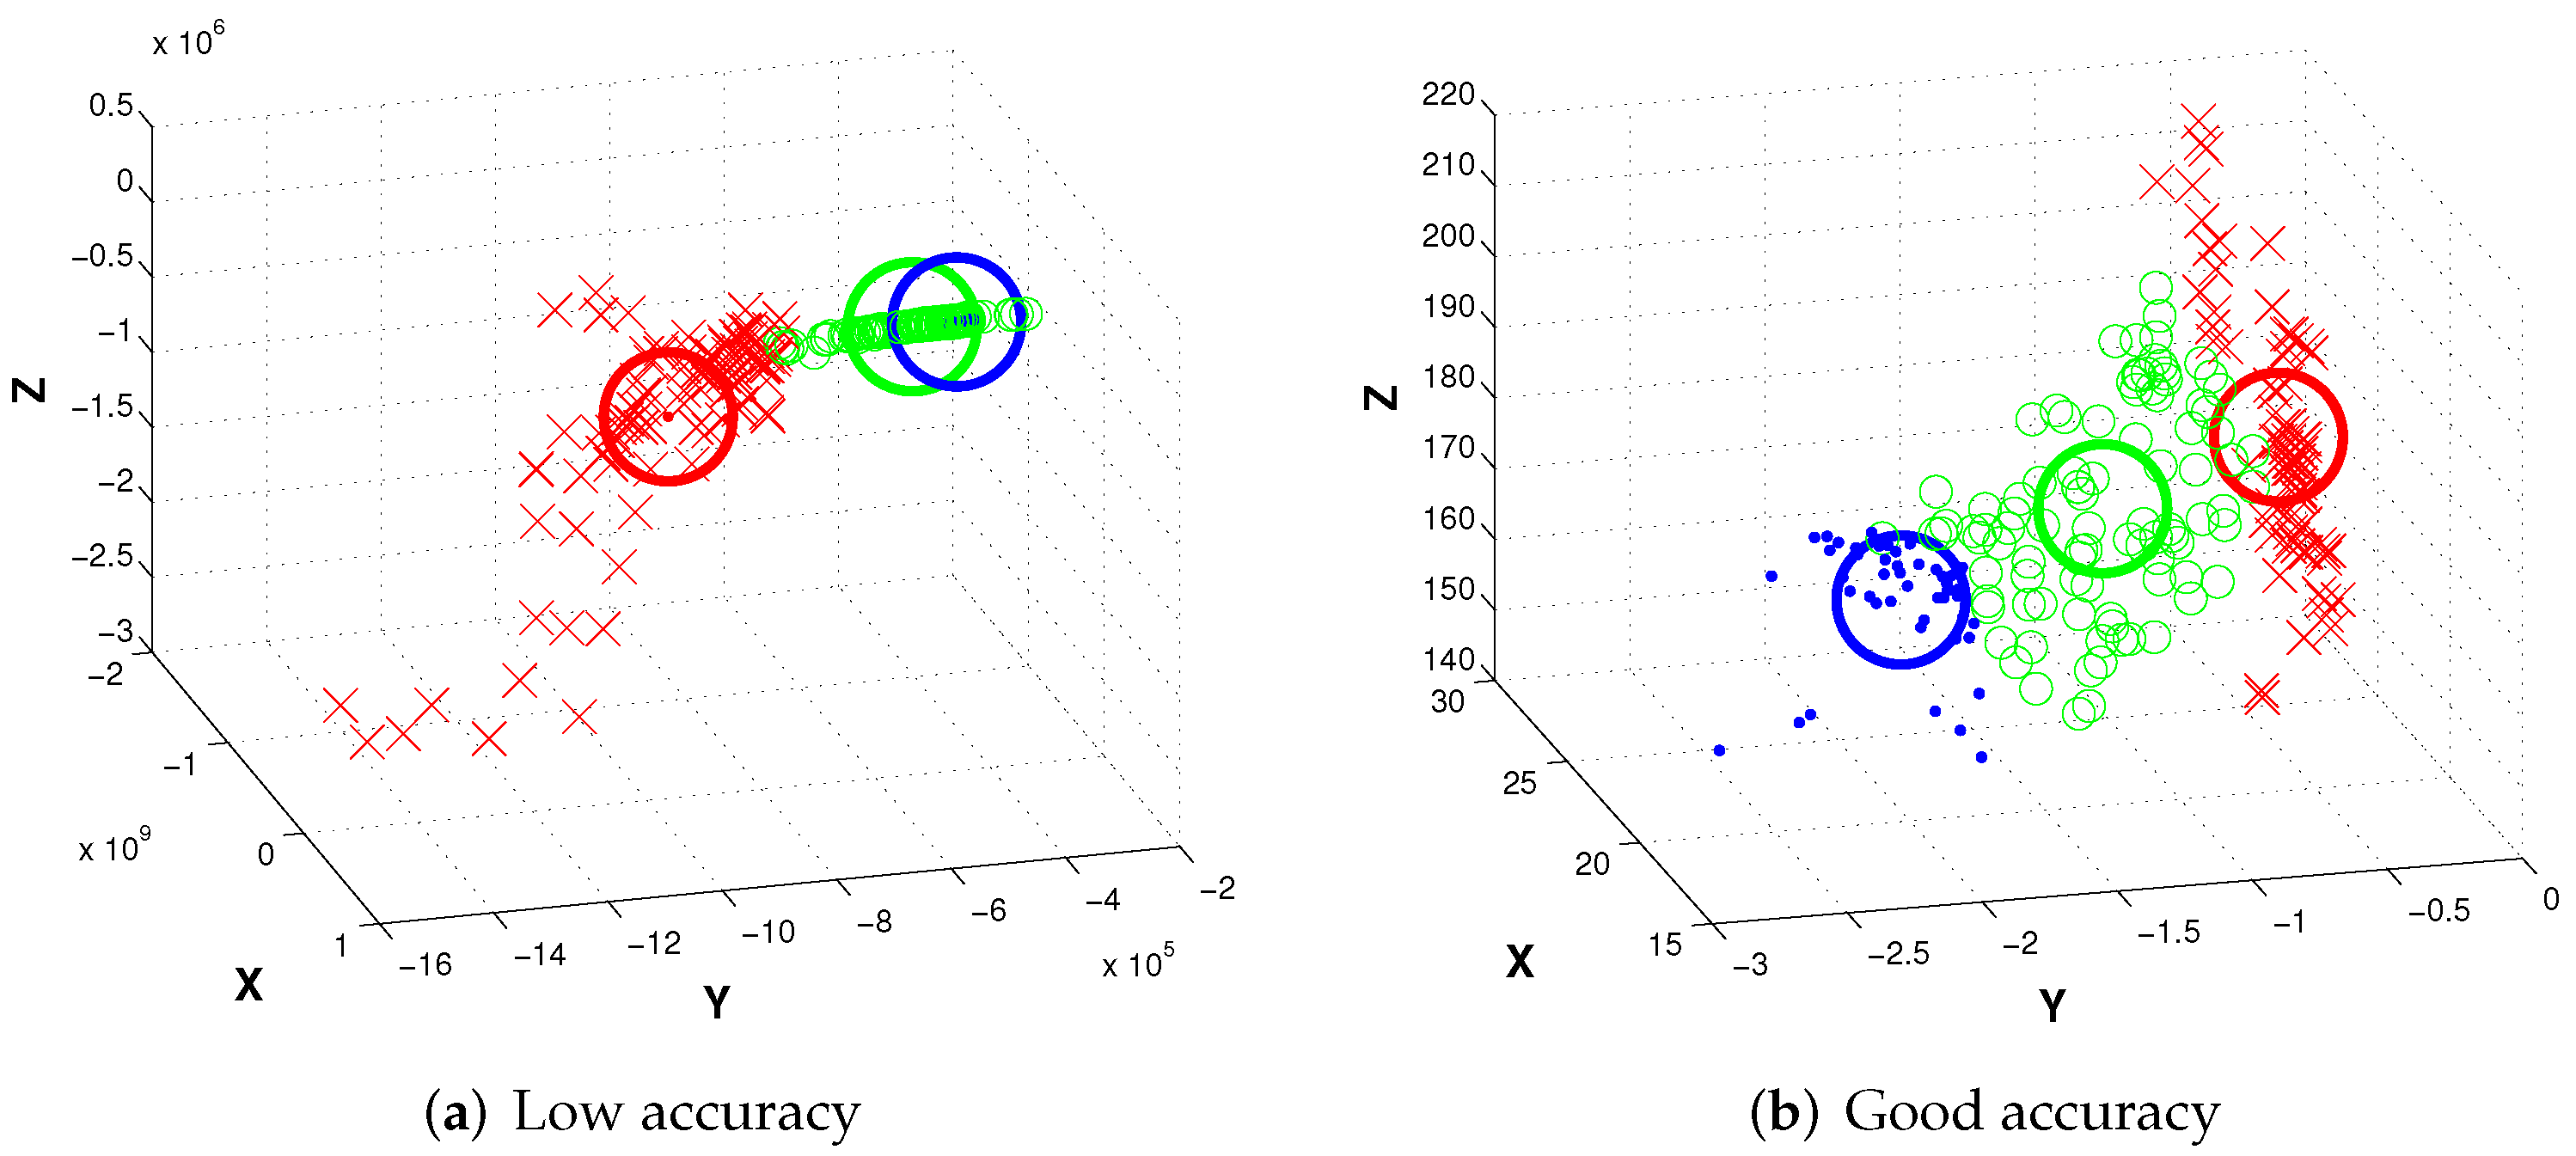
The evolutionary process of M3GP enables the transformation of the input feature space, such that the transformed data of each class can be grouped into a single cluster, as in Figure 4. To achieve this, M3GP uses a tree representation that allows it to perform the mapping . The representation is the same as in regular tree-based GP, except that the root node of the tree exists only to define the number of dimensions d of the new space. Each branch stemming directly from the root performs the mapping in one of the d dimensions (see Figure 3). The initial population can start with a single feature; to search for simpler and smaller transformations, the increase in features occurs through the genetic operators.
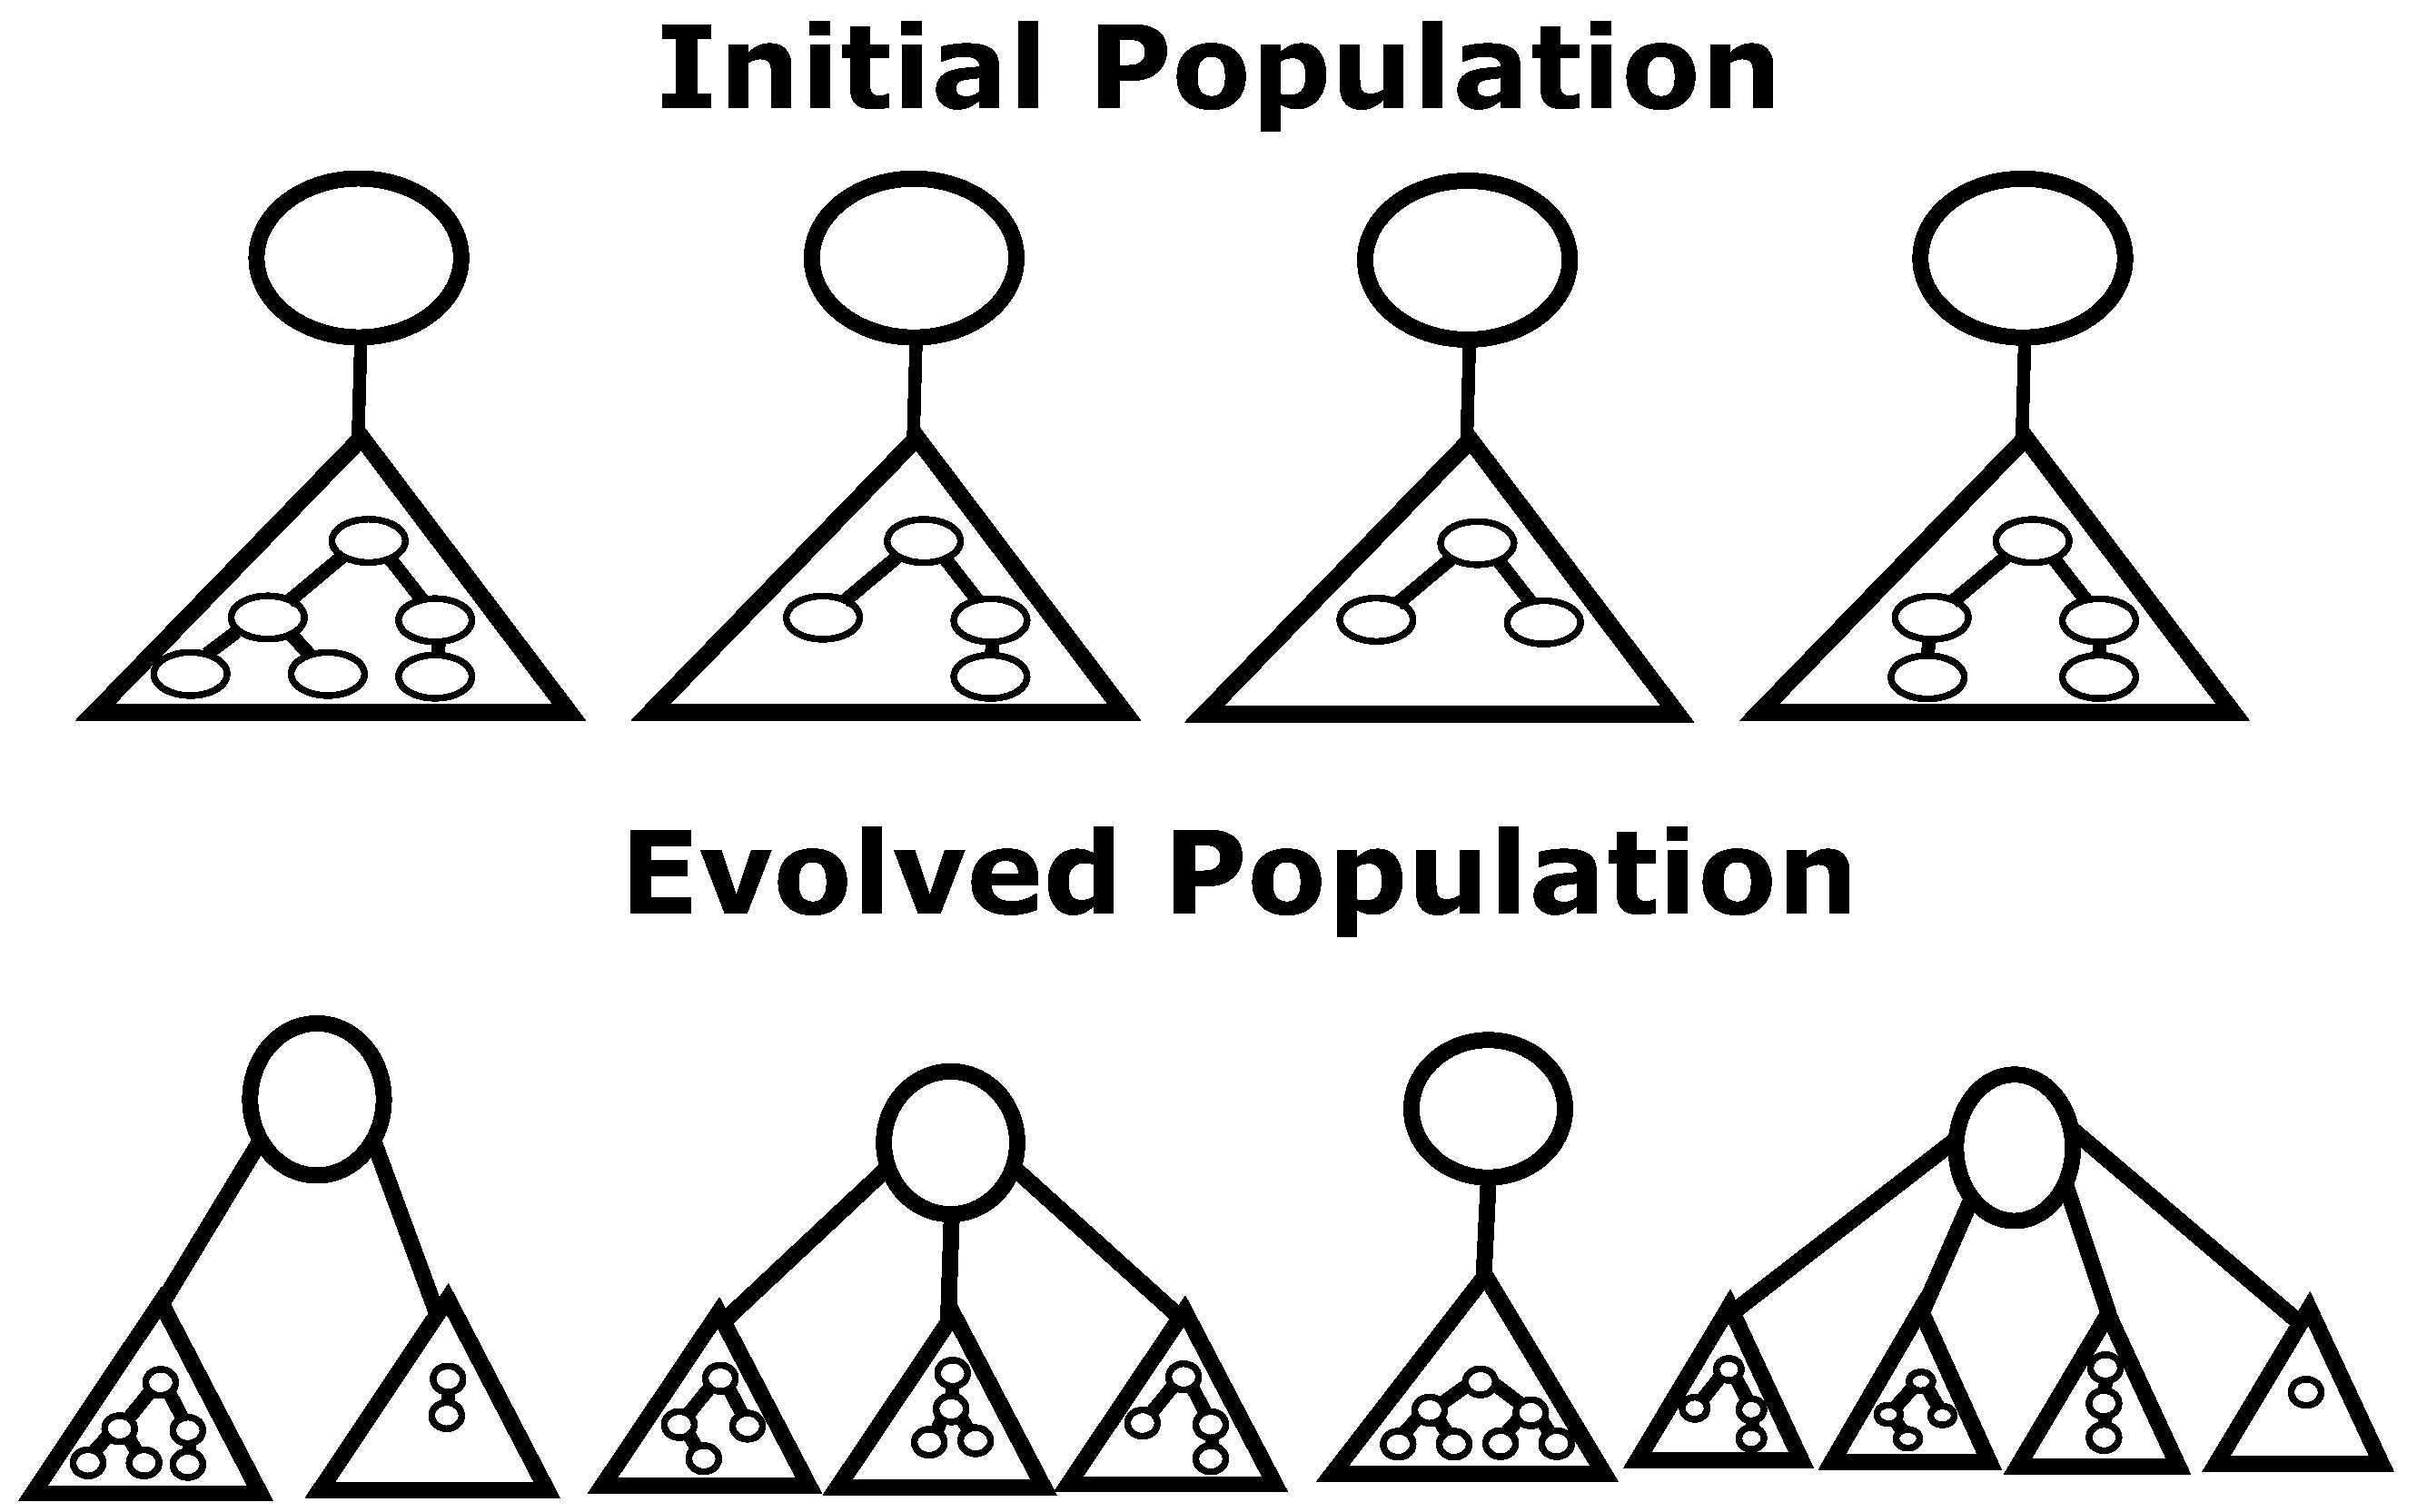
As with any evolutionary algorithm, M3GP involves a population that may contain individual features of several different dimensions, as shown in Figure 5. M3GP includes special genetic operators that can add or remove dimensions. It is assumed that the selection process is sufficient to discard the individuals with the least useful dimensions (also referred to as "features") whilst maintaining the best dimensions within the population.
2.4.1. Initial Population
M3GP starts the search with a random population where all features have only one dimension, see Figure 5. This ensures that the evolutionary search begins by looking for simple one-dimensional solutions before moving on to higher dimension solutions, which could also be more complex. If the problem has a high number of features, it is recommended to start with more features. For the experiments presented in this work, the number of starting dimensions was 10.
2.4.2. Mutation
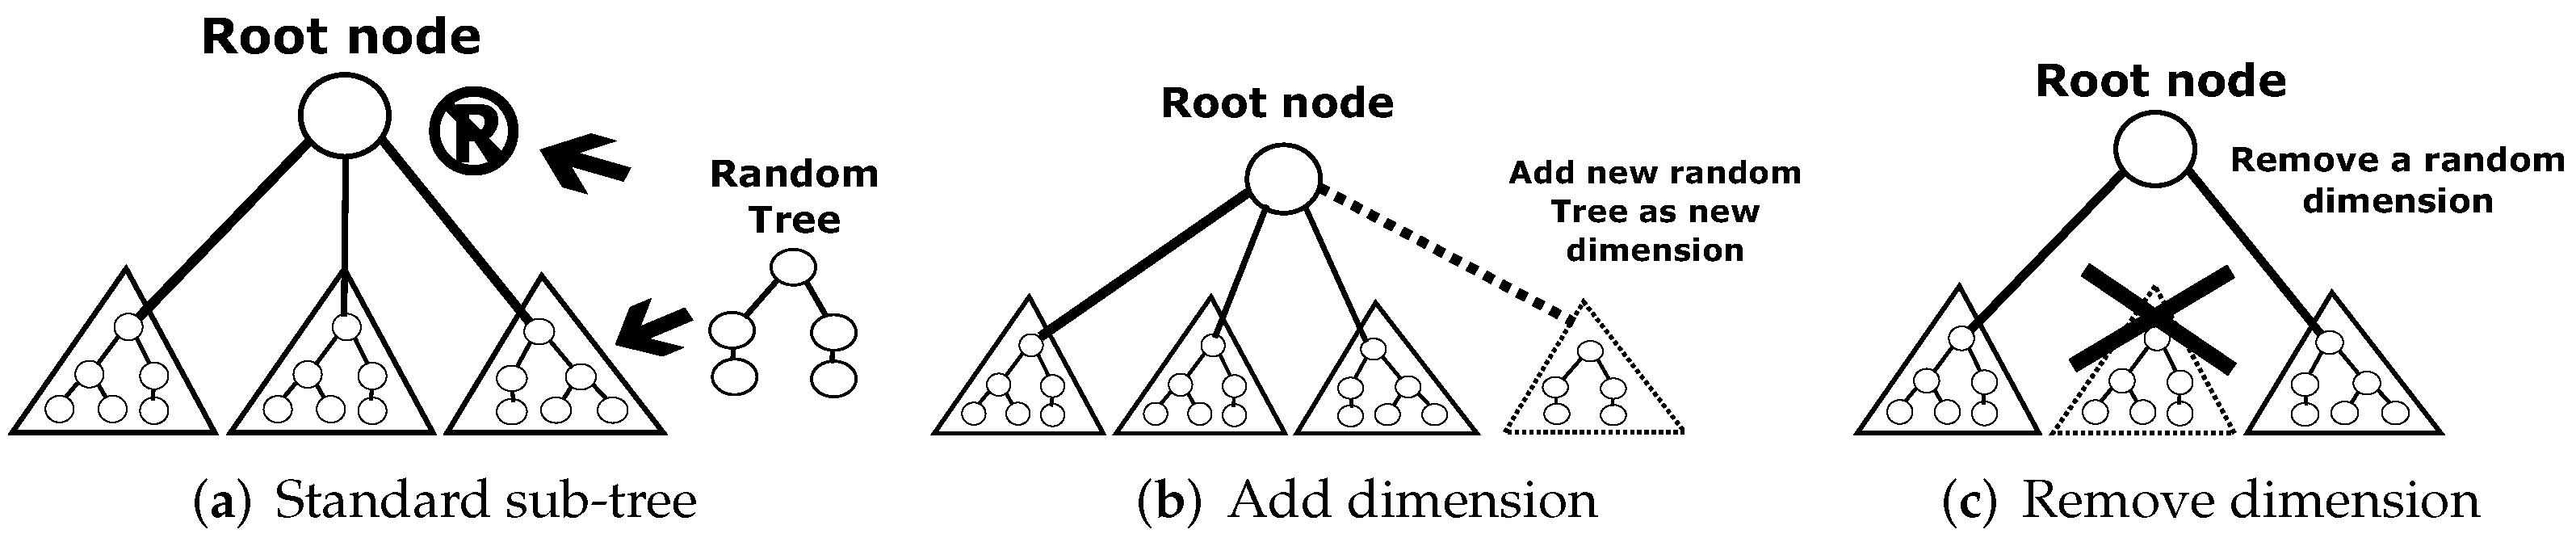
During the breeding phase, whenever mutation is the chosen genetic operator, one of three actions is performed with equal probability: (1) standard sub-tree mutation, where a new randomly created tree replaces a randomly chosen branch of the parent (excluding the root node); (2) adding a new randomly created tree as a new branch of the root node, effectively adding one dimension to the parent tree; and (3) randomly removing a complete branch of the root node, effectively removing one dimension from the parent tree (see Figure 6).
In M3GP, mutation is the only way of adding dimensions. Therefore, it has a probability of of guaranteeing a proper search for the best number of dimensions. Previous results have shown that this high mutation probability (compared to most GP algorithms) works best with M3GP [22].
2.4.3. Crossover
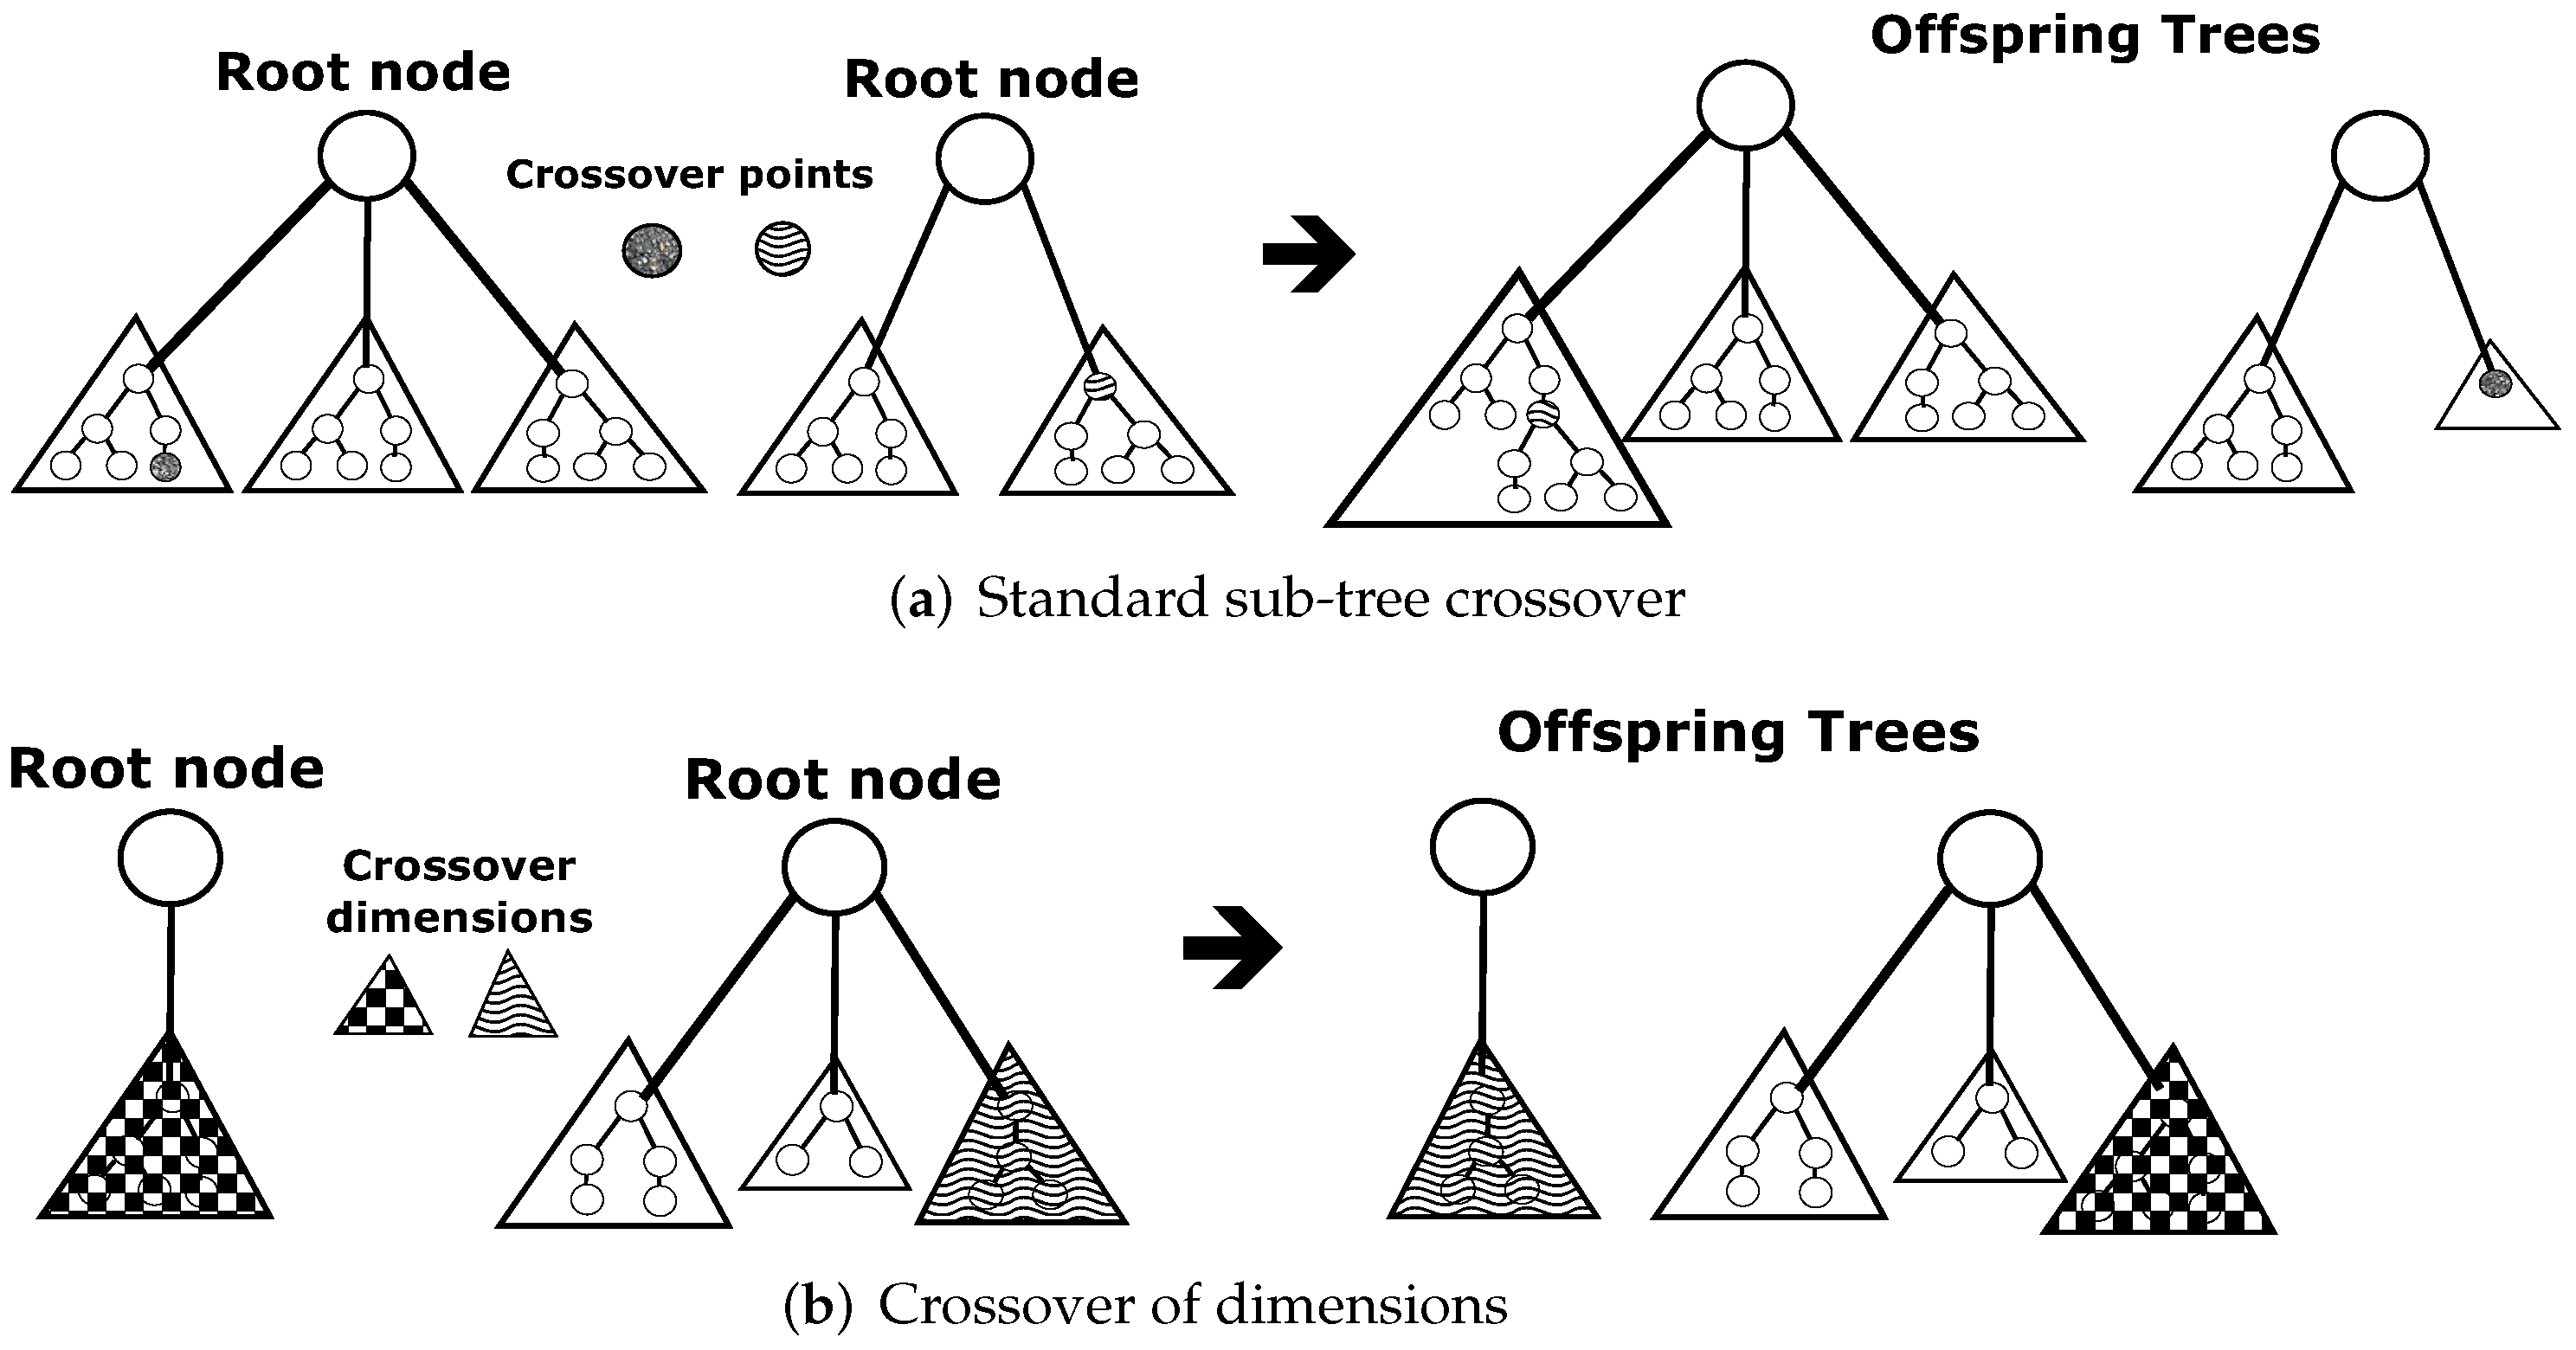
Whenever crossover is chosen, one of two actions is performed with equal probability: (1) standard sub-tree crossover, where a random node is chosen from each of the parents and the respective branches are swapped (excluding the root node); (2) the swapping of dimensions, where a randomly selected complete branch of the root node is chosen from each parent and swapped, effectively swapping how the input data are transformed into a new feature dimension. The second event is just a variant of the first, where the crossing nodes are guaranteed to belong to the root node (see Figure 7).
2.4.4. Pruning
Mutation, as described above, allows M3GP to easily add dimensions to the evolved solutions. However, some dimensions may degrade the individual’s fitness and so, they need to be removed. Mutation can also remove dimensions but it does so randomly and is blind to fitness, as described above. We removed the detrimental dimensions by pruning the best individual after the breeding phase to maintain the simplicity and stochasticity of the genetic operators.
The pruning procedure removes the first dimension and re-evaluates the tree. If the fitness improves, the pruned tree replaces the original and moves on to the pruning of the next dimension. Otherwise, the pruned tree is discarded and the original tree moves on to the pruning of the next dimension. The procedure stops after pruning the last dimension. Pruning applied to the whole population has a higher computational cost but controls the growth of dimensions; nevertheless, to offset the computational cost, we only pruned the best solution found in the population for each generation.
2.4.5. Elitism
This criterion ensures the survival of the individuals from one generation to the next. M3GP does not allow the best individual of any generation to be lost and always copies it to the next generation. Let us recall that this individual is highly optimized because it went through the pruning process. Another elitist criterion occurs when two solutions have the same accuracy: only the smallest is conserved, thereby simplifying the transformation tree.
3. Neural Network Configuration
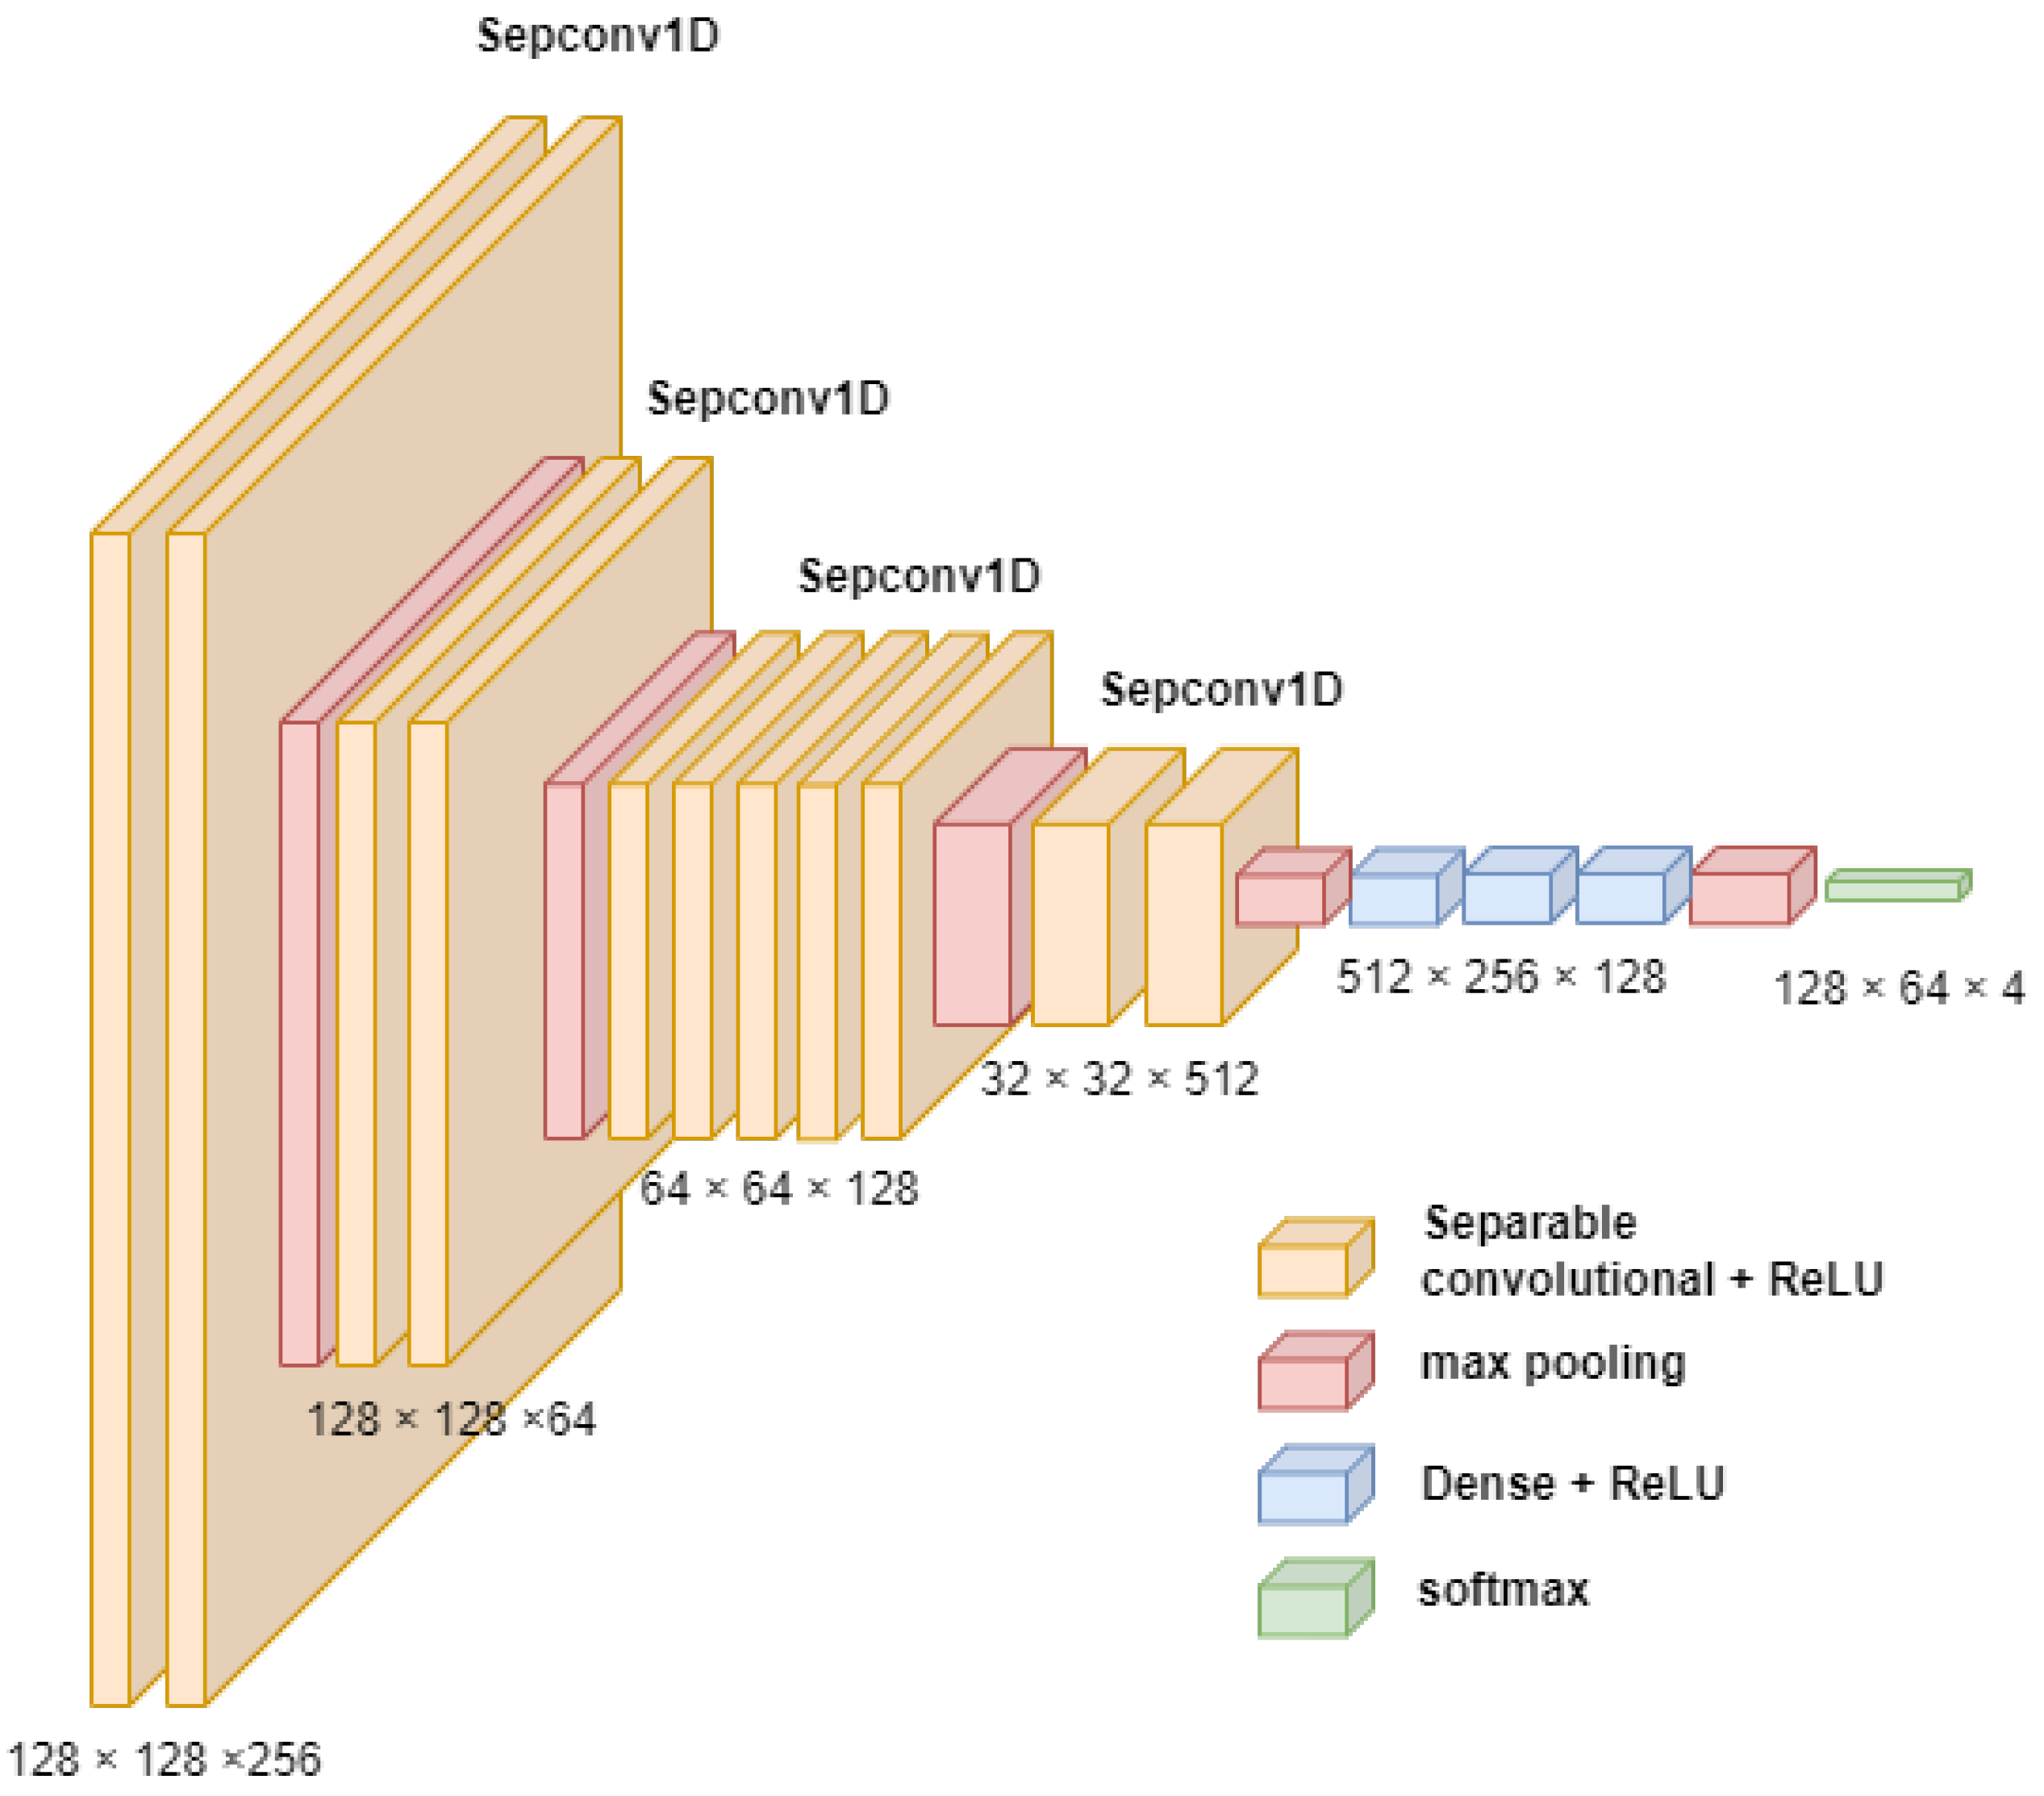
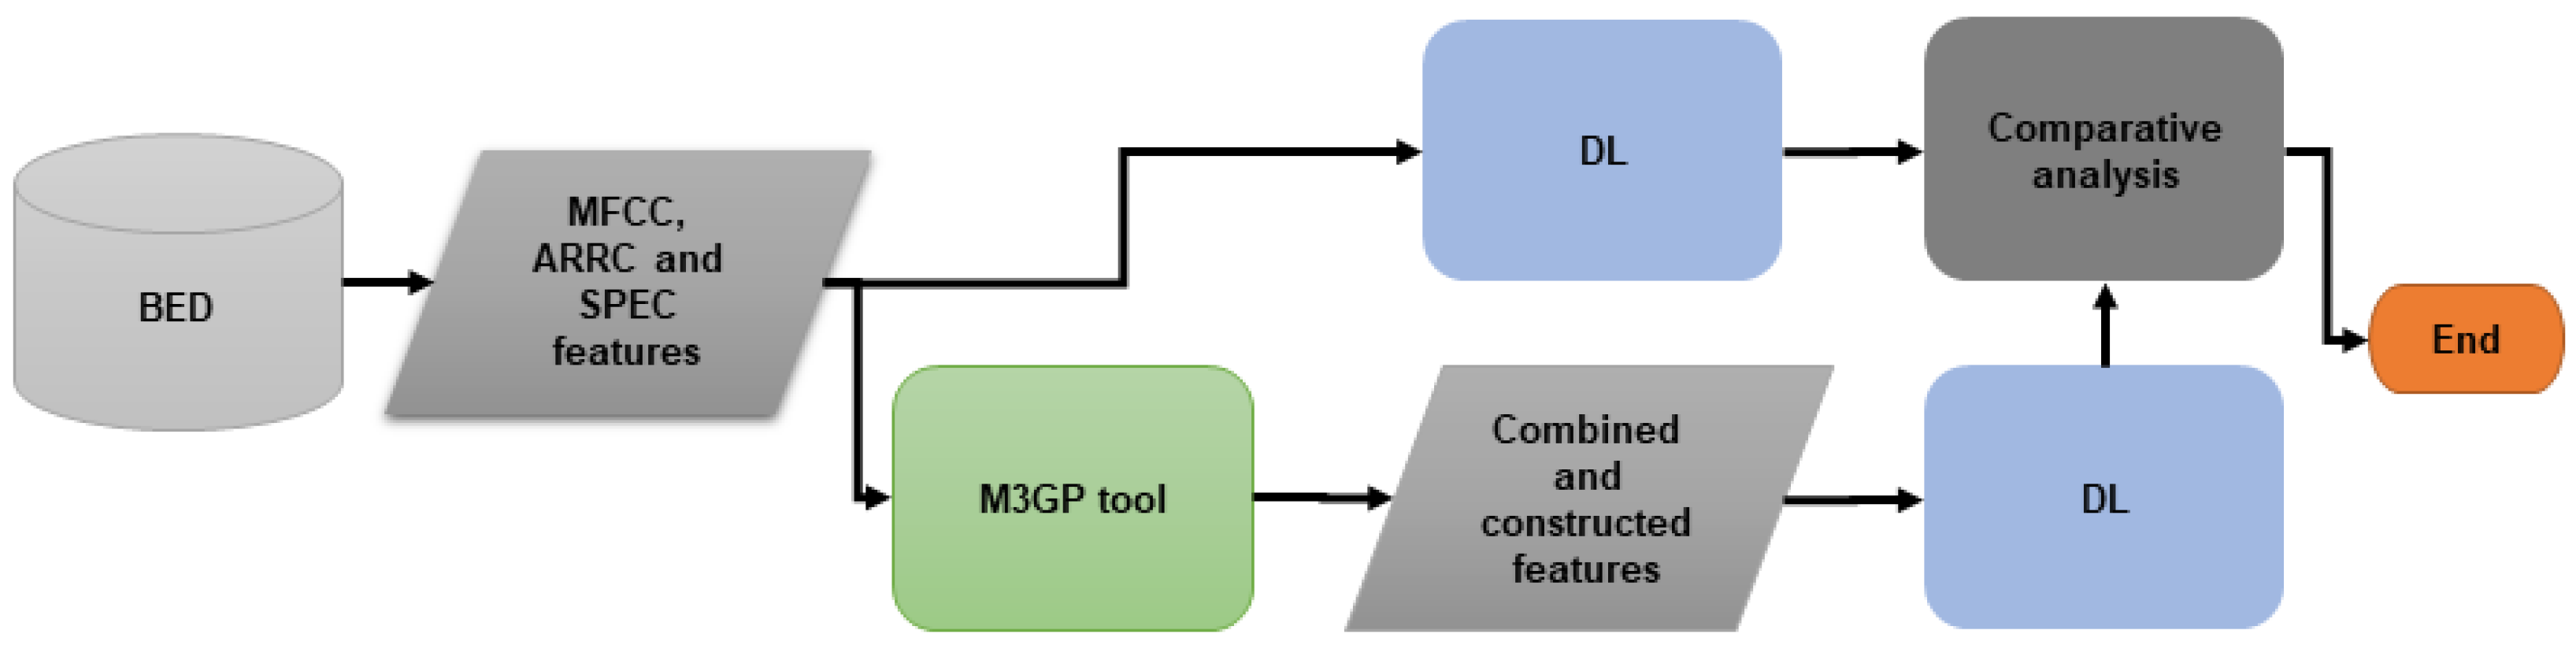
The implemented deep learning (DL) topology and configuration was extracted from the experimental process in [11], which determined that this kind of low-complexity neural network achieves an excellent performance without increasing the computational burden. The topology can be observed in Figure 8 and Table 1. The network uses the one-dimensional convolutional structure to perform a depthwise convolution that acts separately on the channels, followed by a pointwise convolution that mixes the channels [28]. The four emotional states define the four classes, as in the emotions model (see Figure 1). Also, this work considers ReLU, Tanh, and logistics functions to observe performance variations and demonstrate how they are affected by the change in traits. The proposed methodology uses the same topology but distinct features composition in the training process as can be observed in Figure 9. This allowed us to observe whether we could improve the classification rate by using the same topology with distinct feature configurations.
4. Results
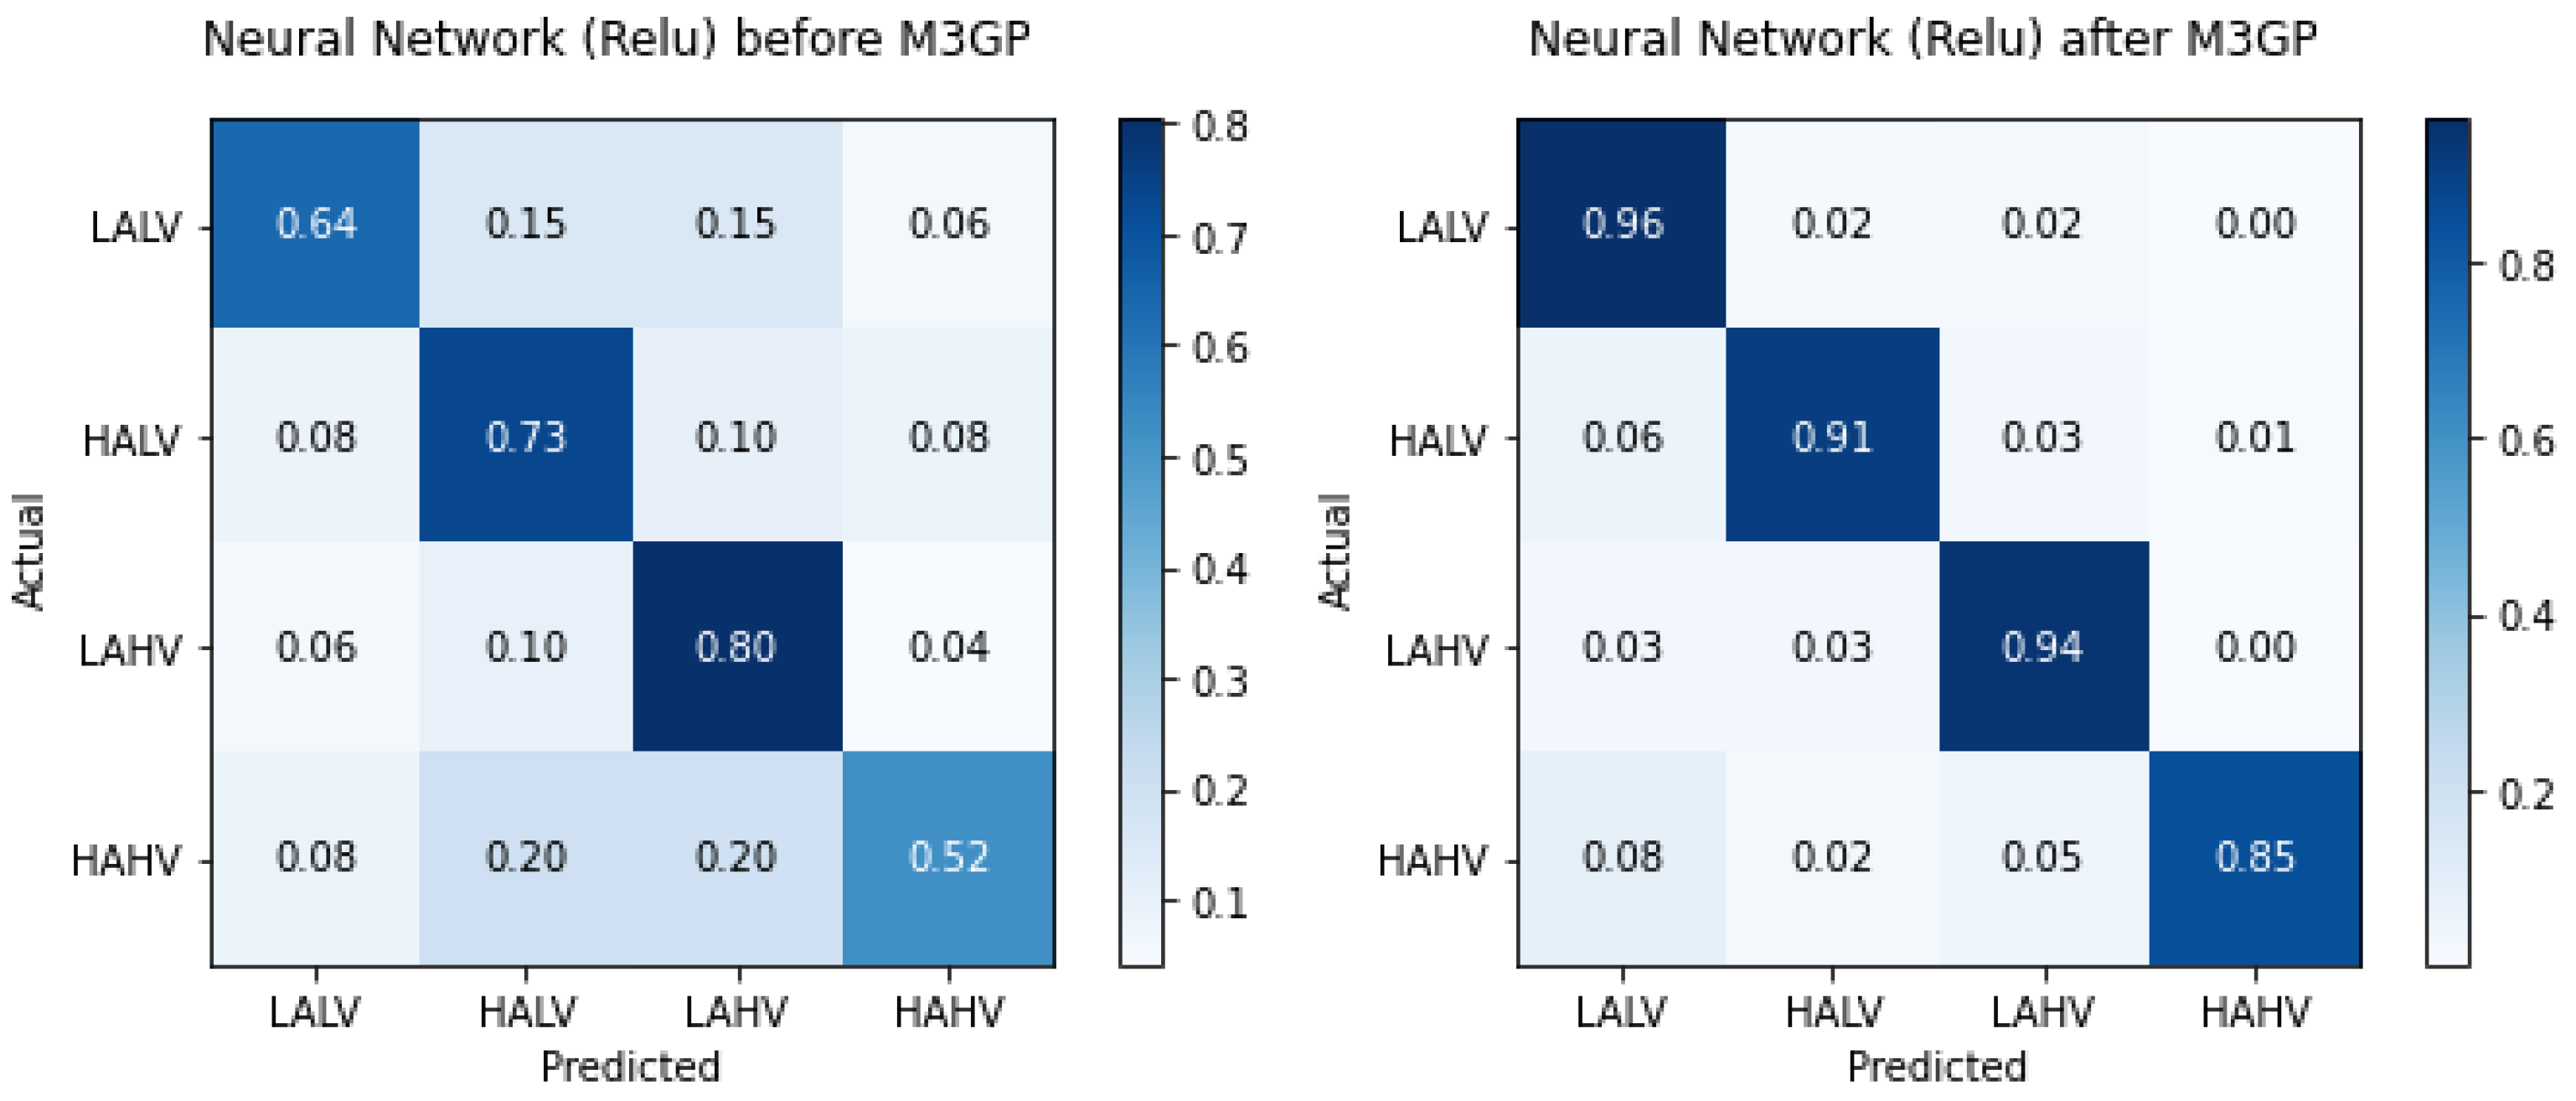
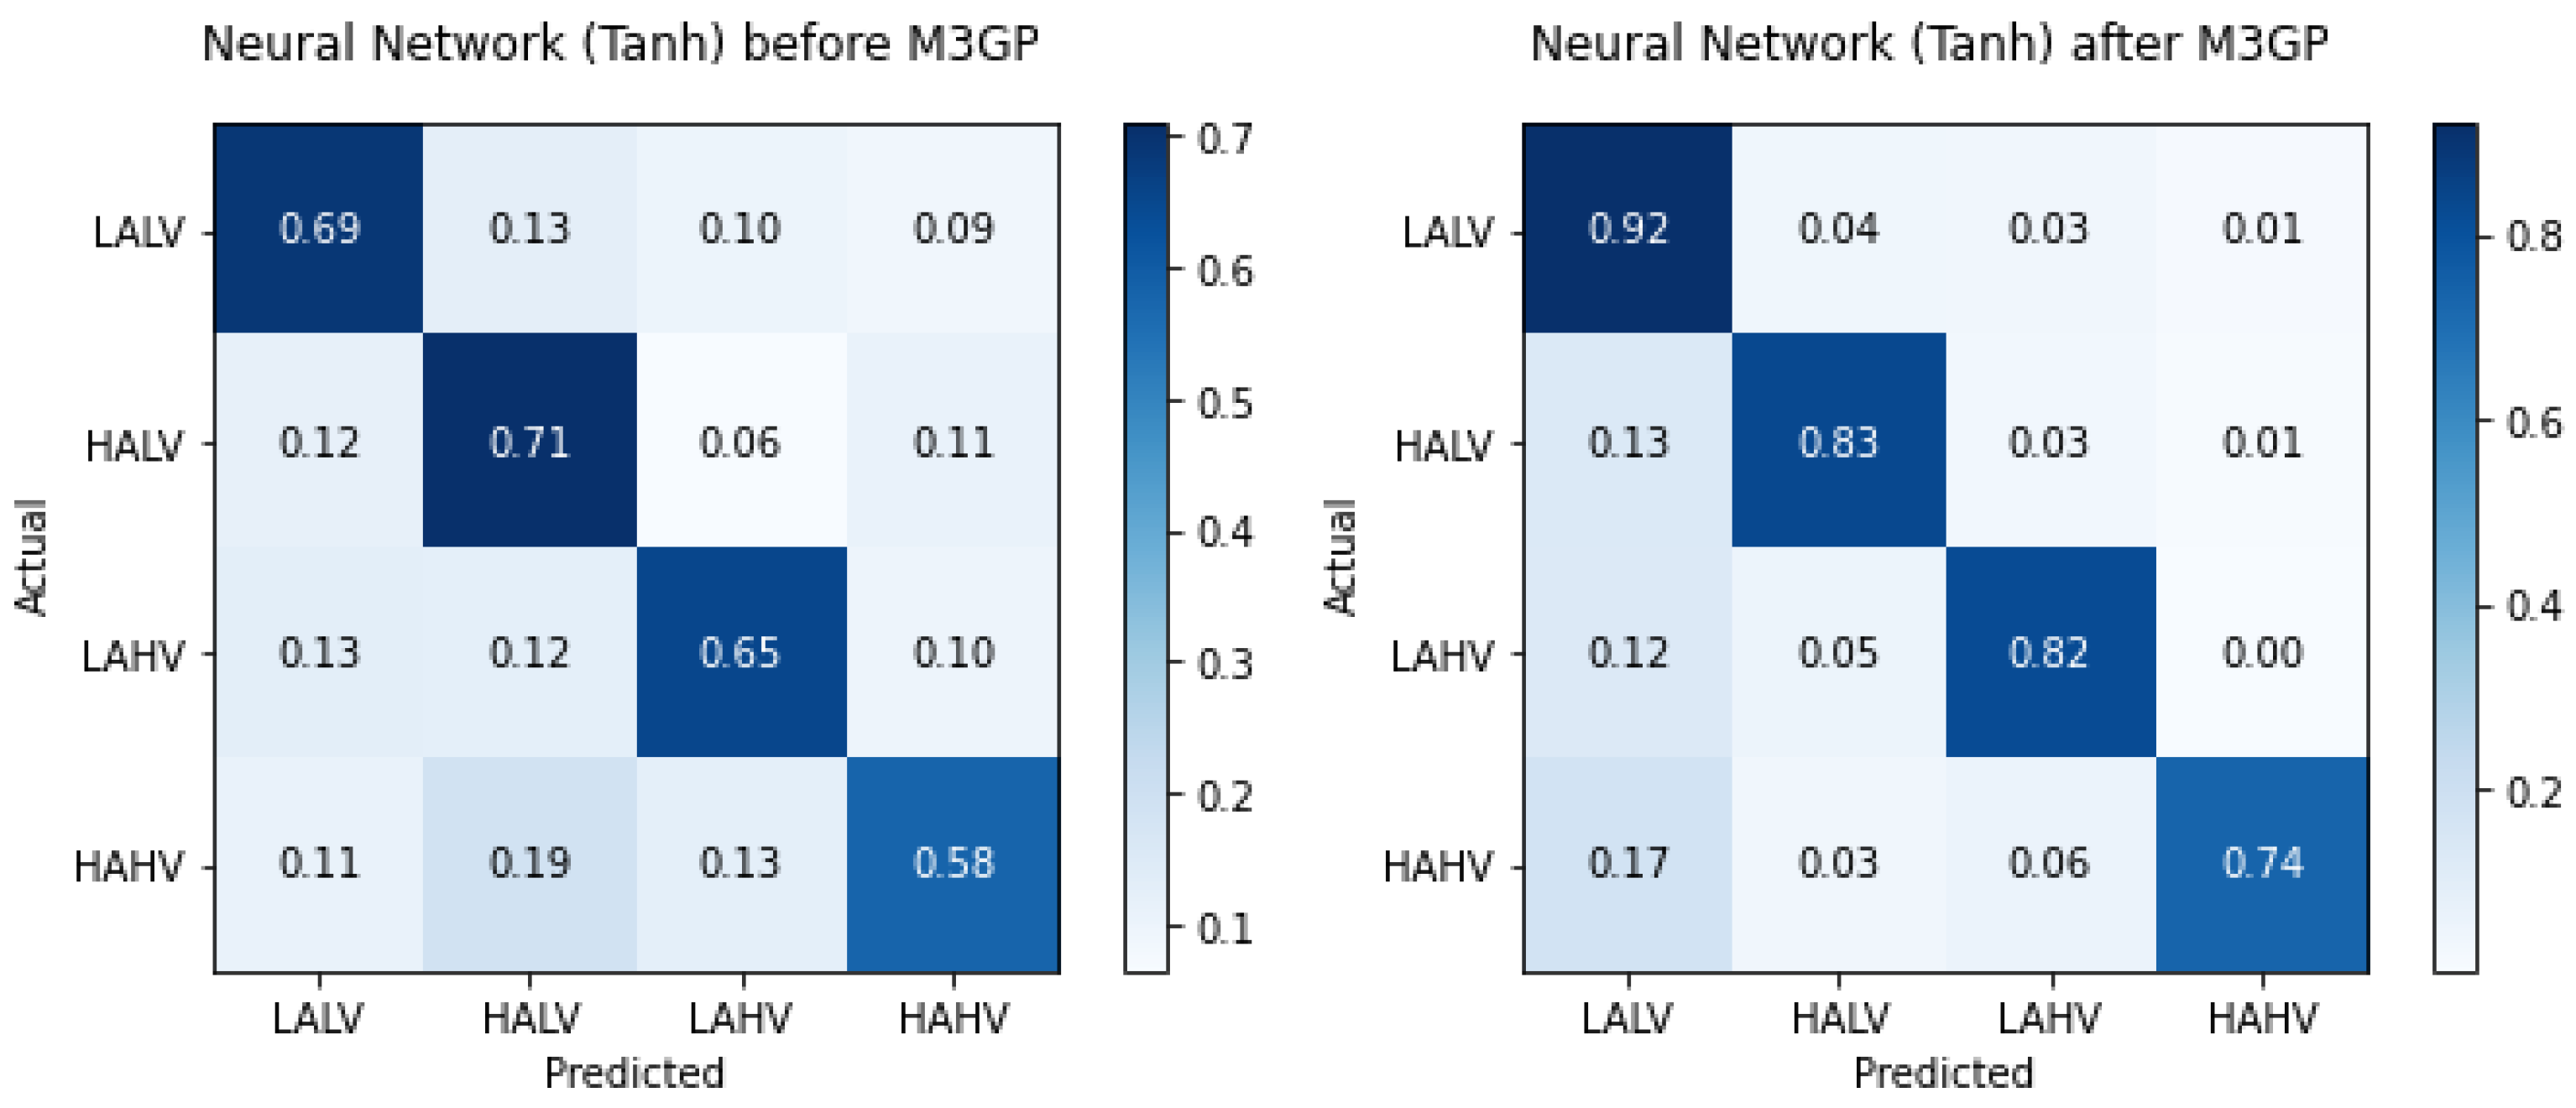
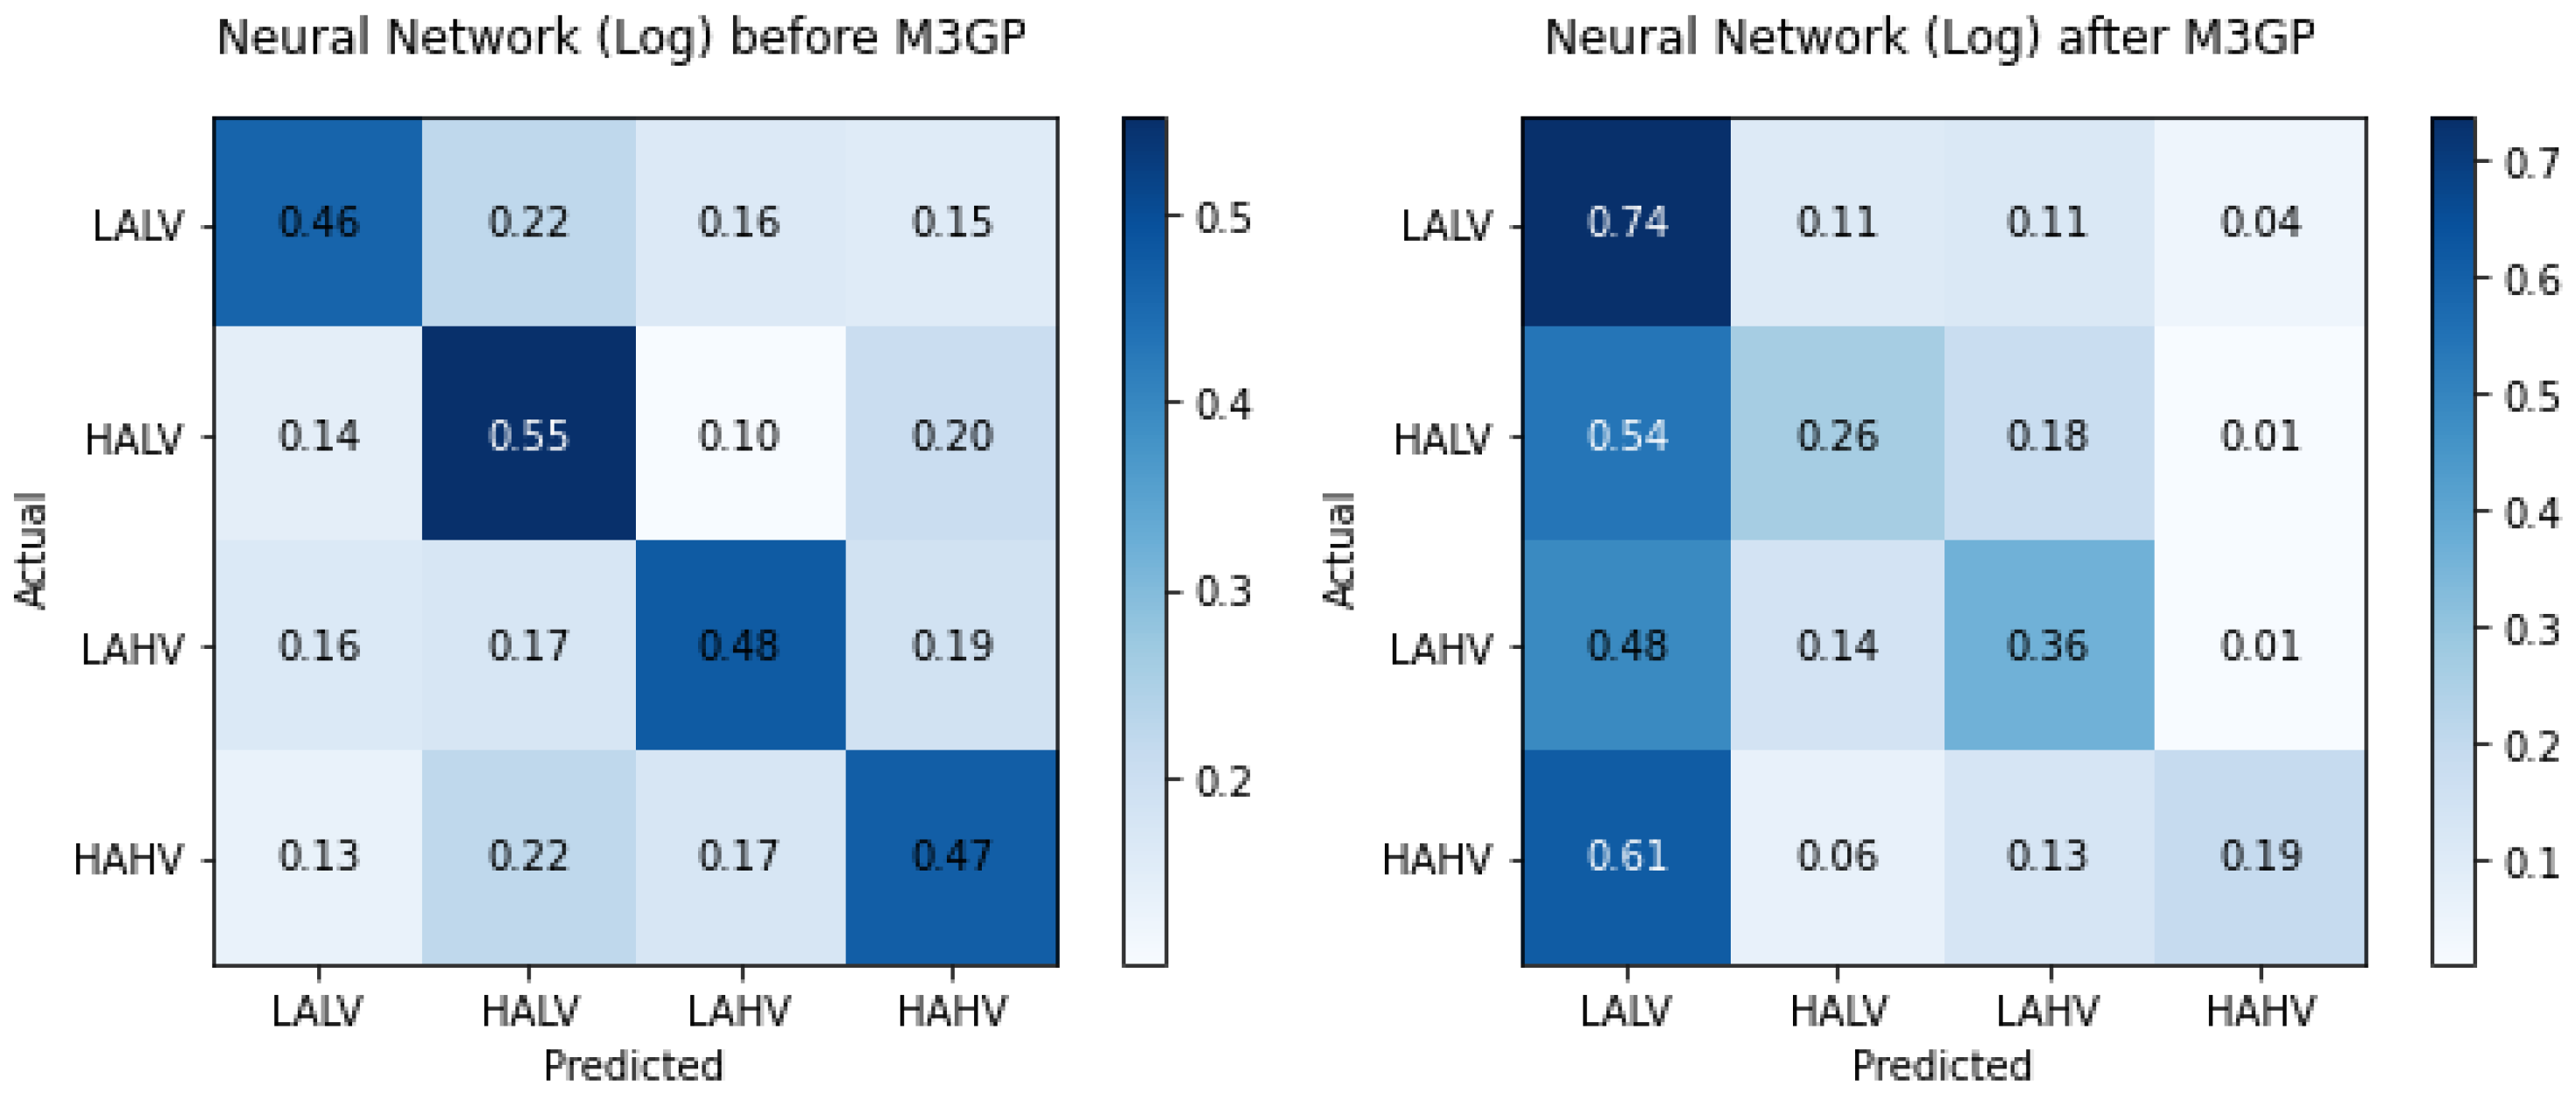
We performed tests with various neural network configurations, using ReLU, Tanh, and logistic functions, to demonstrate the performance improvement when implementing the M3GP. The performance of the network before M3GP is shown in Table 2, where it can be observed that the classification accuracy was around 65.9% for the cases of the ReLU and Tanh functions. In contrast, the logistic function achieved an inferior performance, which was expected since it does not usually perform well on non-binary systems. However, it was in our interest to show the impact of M3GP on the grouping of the elements.
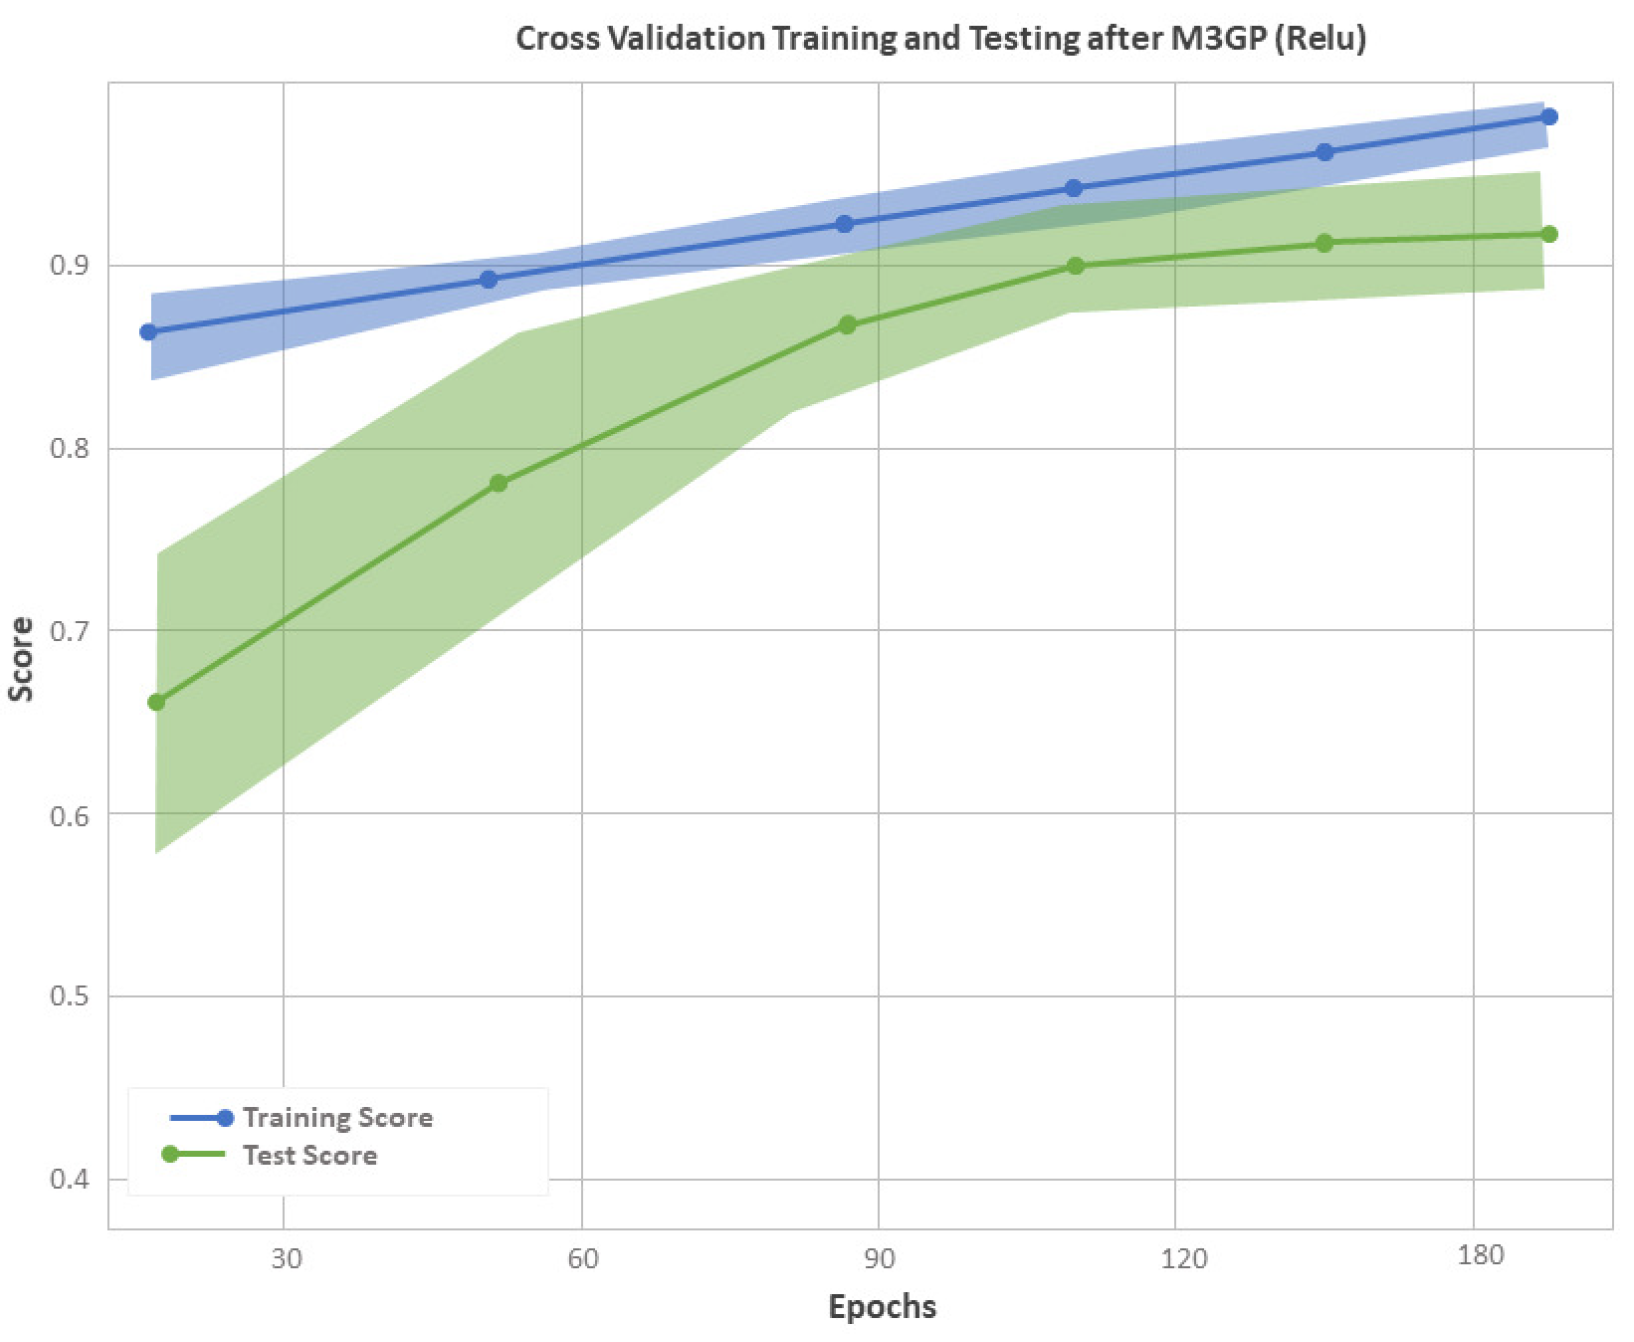
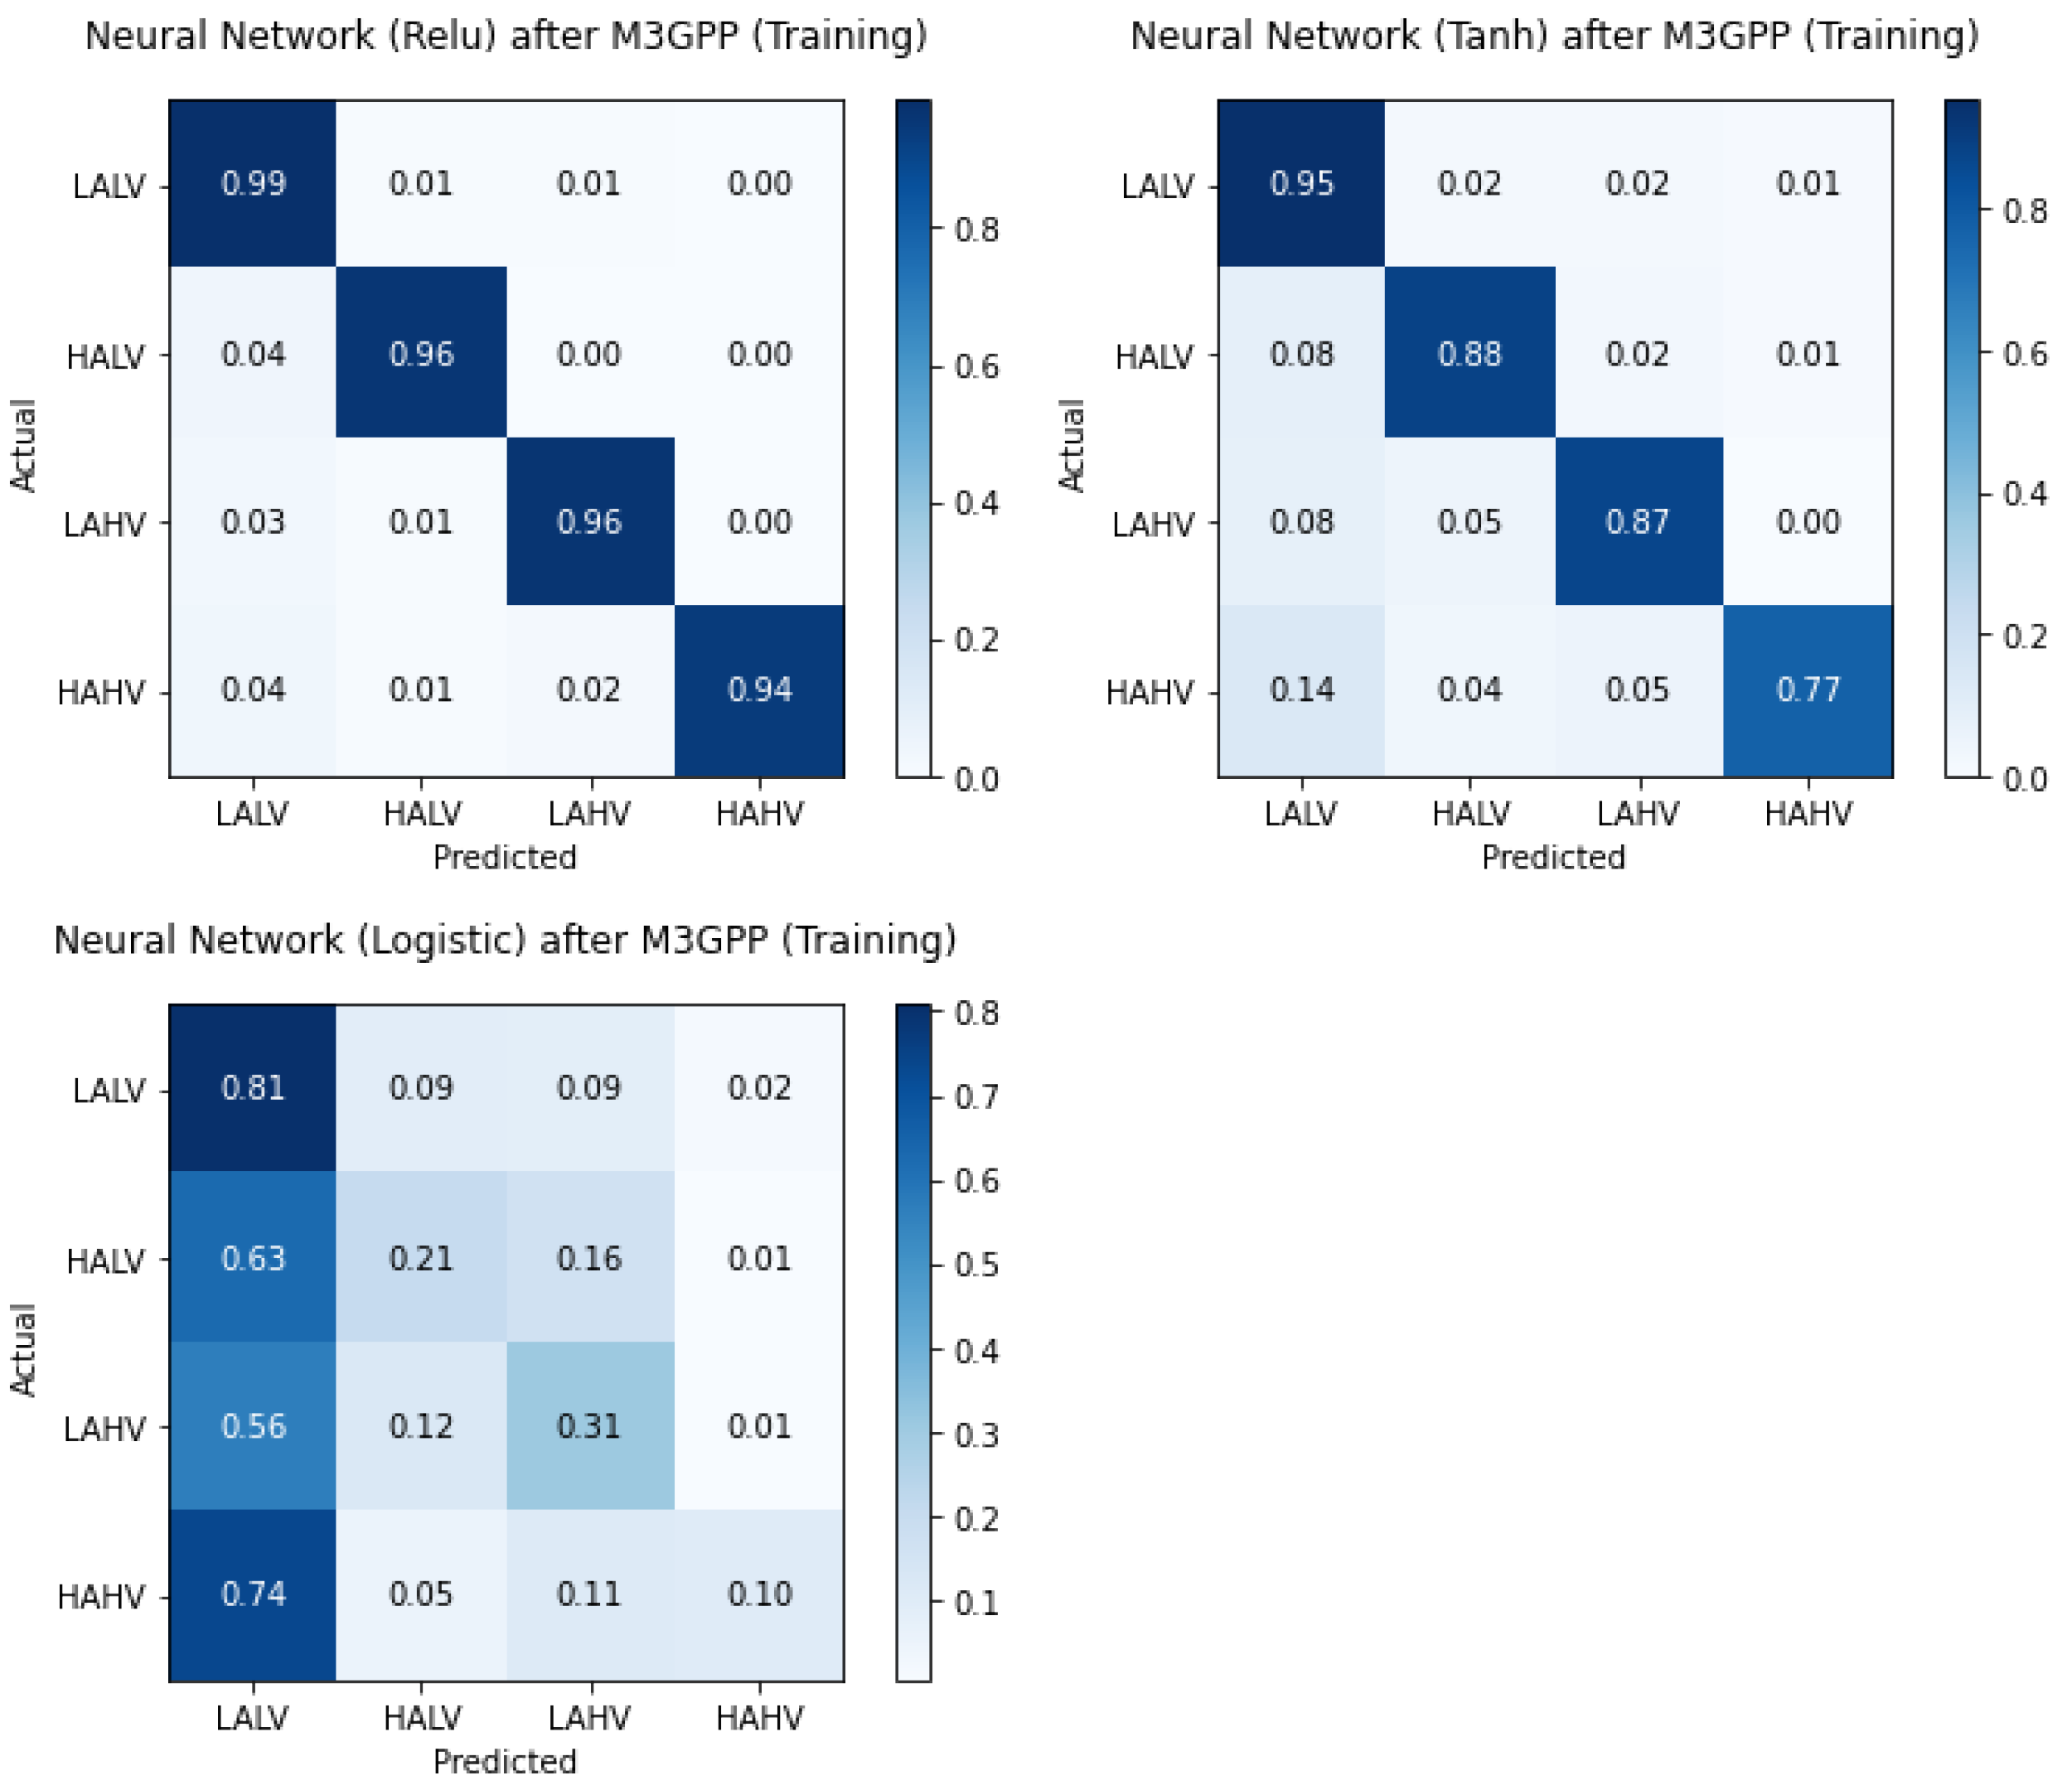
The improvements achieved in the classification rates can be seen in Table 3. It can be seen that the ReLU and Tanh functions had an improvement of 26% and 20.8%, respectively, and each class classification improvement is represented in Figure 10 and Figure 11. The logistic function showed a decrease in the recognition rate since it considers a binary scenario, which M3GP makes less feasible; this can be better appreciated in Figure 12. The best training and testing cross-validations for the ReLU function can be observed in Figure 13 and the training confusion matrix values can be observed in Figure 14.
4.1. Standalone M3GP
The main reason for using M3GP was not to obtain a classifier with superior results to the SOA algorithms, but to obtain a feature transformation that could improve the results obtained by the SOA algorithms.
M3GP was run with the settings shown in Table 4 with the spectral feature (MFCC, ARRC, and SPEC) arrangement of the BED dataset. The best results, presented in Table 5, were not significantly different from the SOA methods shown in Table 6. There are many reasons for the low performance of well-known algorithms (e.g., the number of features is too high, there are not enough samples, there is an unbalanced dataset) and when considering all possibilities, users may be tempted to apply some form of data treatment, but not letting the evolutionary process use all available data can affect the performance of the evolutionary algorithms by removing the possibility of letting the natural selection process find the ideal treatment.
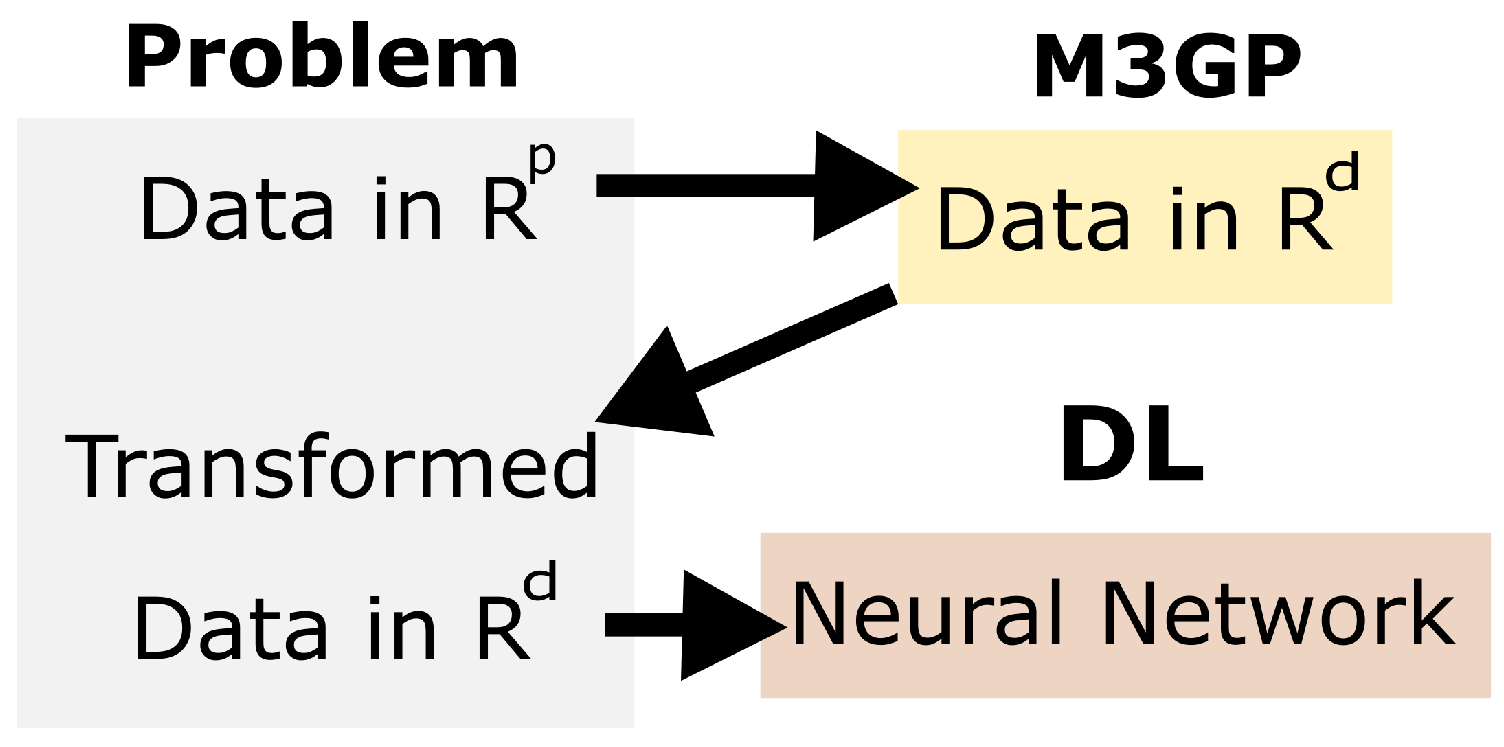
To improve on the performance of the SOA methods, we used the features generated by M3GP in Figure 15. This kind of transfer learning was used in [45] with success and the best training transformation found in M3GP was used to transform the dataset into a new one (M3GP tree in Section 4.2), considering that these new features contain more information to simplify the learning process of the SOA methods. The chosen dataset was MFCC, with a matrix of 1481 × 168 becoming a matrix of 1481 × 63 through the M3GP transformation. The improved result is shown in Table 3.
4.2. Transformation Tree
Root node(X23, X24, times(X139,X85), X147, X116, X6, X80, X118, X42, X67, X2, X167, times(X161,tanh(tanh(X130))), X56, X122, X158, X74, X111, X109, X121, X154, X75, X84, X19, X43, X149, X12, X139, X102, X96, X36, X112, X28, X45, X33, X29, plus(X152,X21), X166, X27, X31, X15, X159, X38, squareroot(X86), X34, X89, X126, X65, X161, X82, X123, X151, X136, X156, X103, X168, X162, X51, X57, X87, X155, X132, sine(X30)). Note that each X is an original feature of the BED MFCC dataset.
5. Discussion
The implementation of M3GP in the feature generation stage and the pattern recognition stage through deep learning allowed us to obtain competitive results. We carried out a similar test to that reported in [15] but implementing an architecture that we had previously tested in other benchmarks [12,28]. These results were still not significant compared to the SOA algorithms, although we obtained similar results to the original study (see Table 6). However, the results of maintaining the same architecture and changing the feature selection stage via a transformation of features using M3GP improved to the results obtained in [15] by 20.9% and even exceeded some of the SOA methods.
M3GP has shown competitive results in different benchmarks [22,26,46], especially regarding multiclass problems; but in this case, it was not able to obtain competitive results with EEG from the BED dataset. It also showed a high overfitting problem in the best solution found for the MFCC data. However, this experiment was not wasteful since, based on the results obtained in [45], M3GP feature transformations can still be used as feature optimizers by transferring the knowledge obtained from the evolutionary process to the transformation of features. The effect of the feature can be seen in Table 7.
An interesting result was the overfitting problem when using the Mahalanobis classifier being so high, as observed in Table 5. No other classifiers show any signs of overfitting when working with the transformed dataset, which makes the overfitting problem data independent.
6. Conclusions
A central aspect of the study of mental states through EEG signals is that it does not leave a clear marker on which to focus, unlike certain diseases, such as epilepsy. This means that we often cannot clearly define whether a stimulus exists or not when it begins or ends and which part of the signal is liked to the stimuli. By implementing M3GP, we presupposed that we could accentuate the differences between the behavior of the signals. As shown, once the spectral coefficients of the signals have been extracted, they are processed to increase the distance between them and facilitate the classification process.
This proposal reduced the complexity of the recognition process by reducing features through an evolutionary process that selects those features that best define each of the classes. Traditionally, this analysis process extracts the spectral features of the signals to carry out the pattern search process. However, these features could be linked to diverse phenomena that are inherent to the signals, such as artefact noise, or various physiological phenomena, such as closing eyes, or cognitive processes that are simply not associated with the experimental process. M3GP allowed us, through a selection process, to obtain only those individuals that best fit the description of each of the classes and thus, allowed us to improve the classification rate.
Another essential aspect of this work is the implementation of the BED dataset, which was conceived and built to study users’ emotional reactions. BED explores the use of low cost devices in a formal study, thereby promoting and establishing some basis for applicability in less controlled environments.
Our future work will based on integrating the feature selection process into the network architecture configuration, i.e., implementing the neat GP concept in the generalization and optimization of network operation [9,47]. To our knowledge, DL has shown outstanding performances when working with EEG signals; however, the community continues to propose architectures that can efficiently solve this type of problem. We hypothesize that we can establish the criteria for the network features and topology when implementing an evolutionary strategy. Another proposal for future work that is linked to this model lies in implementing GP as an AutoML methodology, with the premise that GP could be used to autonomously select features and DL topology (currently, this process is performed through digital signal processing by extracting spectral coefficients).
Author Contributions
Conceptualization, A.R.A.; methodology, A.R.A. and L.M.D.; software, A.R.A. and L.M.D.; validation, A.R.A., L.M.D., V.R.L.-L. and A.C.T.; investigation, A.R.A. and L.M.D.; resources, V.R.L.-L. and A.C.T.; data curation, A.R.A. and L.M.D..; writing—original draft preparation, A.R.A.; writing—review and editing, L.M.D.; visualization, V.R.L.-L. and A.C.T.; supervision, A.R.A., L.M.D., V.R.L.-L. and A.C.T.; project administration, A.R.A.; funding acquisition, V.R.L.-L. and A.C.T. All authors have read and agreed to the published version of the manuscript.
Funding
This research received funding from the National Technological of Mexico, project "Apply machine learning techniques to correlate EEG and facial expressions produced by emotional states".
Institutional Review Board Statement
Not applicable.
Informed Consent Statement
Not applicable.
Data Availability Statement
BED dataset: https://zenodo.org/record/4309472 (accessed on 21 October 2021).
Acknowledgments
The authors would like to thank the Tecnológico Nacional de México for making this work possible.
Conflicts of Interest
The authors declare no conflict of interest.
References
- Holzinger, A. Explainable AI and Multi-Modal Causability in Medicine. I-com 2021, 19, 171–179. [Google Scholar] [CrossRef]
- Akbarian, B.; Erfanian, A. Automatic Seizure Detection Based on Nonlinear Dynamical Analysis of EEG Signals and Mutual Information. Basic Clin. Neurosci. 2018, 9, 227–240. [Google Scholar] [CrossRef] [PubMed]
- Vahid, A.; Mückschel, M.; Stober, S.; Stock, A.K.; Beste, C. Applying deep learning to single-trial EEG data provides evidence for complementary theories on action control. Commun. Biol. 2020, 3, 112. [Google Scholar] [CrossRef] [Green Version]
- Chen, Y.; Chang, R.; Guo, J. Effects of Data Augmentation Method Borderline-SMOTE on Emotion Recognition of EEG Signals Based on Convolutional Neural Network. IEEE Access 2021, 9, 47491–47502. [Google Scholar] [CrossRef]
- Hussain, I.; Park, S.J. Quantitative Evaluation of Task-Induced Neurological Outcome after Stroke. Brain Sci. 2021, 11, 900. [Google Scholar] [CrossRef]
- Hussain, I.; Young, S.; Park, S.J. Driving-Induced Neurological Biomarkers in an Advanced Driver-Assistance System. Sensors 2021, 21, 6985. [Google Scholar] [CrossRef]
- Jadhav, N.K.; Momin, B.F. Eye blink pattern controlled systemusing wearable EEG headband. In Proceedings of the 2018 3rd IEEE International Conference on Recent Trends in Electronics, Information Communication Technology (RTEICT), Bengaluru, India, 18–19 May 2018; pp. 2382–2386. [Google Scholar] [CrossRef]
- Guo, Y.; Wang, M.; Zheng, T.; Li, Y.; Wang, P.; Qin, X. NAO robot limb control method based on motor imagery EEG. In Proceedings of the 2020 International Symposium on Computer, Consumer and Control (IS3C), Newcastle upon Tyne, UK, 17–19 November 2020; pp. 521–524. [Google Scholar] [CrossRef]
- Stanley, K.O.; Miikkulainen, R. Evolving Neural Networks Through Augmenting Topologies. Evol. Comput. 2002, 10, 99–127. [Google Scholar] [CrossRef]
- Mustaqeem; Kwon, S. Att-Net: Enhanced Emotion Recognition System Using Lightweight Self-Attention Module. Appl. Soft Comput. 2021, 102, 107101. [Google Scholar] [CrossRef]
- Aguinaga, A.R.; Ramirez, M.A.L.; del Rosario Baltazar Flores, M. Classification model of arousal and valence mental states by EEG signals analysis and Brodmann correlations. Int. J. Adv. Comput. Sci. Appl. 2015, 6, 230–238. [Google Scholar] [CrossRef] [Green Version]
- Aguiñaga, A.R.; Hernández, D.E.; Quezada, Á.; Téllez, A.C. Emotion Recognition by Correlating Facial Expressions and EEG Analysis. Appl. Sci. 2021, 11, 6987. [Google Scholar] [CrossRef]
- Aquino-Brítez, D.; Ortiz, A.; Ortega, J.; León, J.; Formoso, M.; Gan, J.Q.; Escobar, J.J. Optimization of Deep Architectures for EEG Signal Classification: An AutoML Approach Using Evolutionary Algorithms. Sensors 2021, 21, 2096. [Google Scholar] [CrossRef] [PubMed]
- Hernández, D.E.; Trujillo, L.; Rodriguez, A. AutoML for emotion recognition in EEG signals. In Proceedings of the 4th Conference on Computer Science and Computer Engineering, LatinIndex, Tijuana, Baja California, Mexico, 13 May 2021; pp. 139–146. [Google Scholar]
- Arnau-González, P.; Katsigiannis, S.; Arevalillo-Herráez, M.; Ramzan, N. BED: A New Data Set for EEG-Based Biometrics. IEEE Internet Things J. 2021, 8, 12219–12230. [Google Scholar] [CrossRef]
- Hussain, I.; Park, S.J. HealthSOS: Real-Time Health Monitoring System for Stroke Prognostics. IEEE Access 2020, 8, 213574–213586. [Google Scholar] [CrossRef]
- Posner, J.; Russell, J.A.; Peterson, B.S. The circumplex model of affect: An integrative approach to affective neuroscience, cognitive development, and psychopathology. Dev. Psychopathol. 2005, 17, 715–734. [Google Scholar] [CrossRef]
- Zheng, W.L.; Lu, B.L. Investigating Critical Frequency Bands and Channels for EEG-based Emotion Recognition with Deep Neural Networks. IEEE Trans. Auton. Ment. Dev. 2015, 7, 162–175. [Google Scholar] [CrossRef]
- Koelstra, S.; Muhl, C.; Soleymani, M.; Lee, J.S.; Yazdani, A.; Ebrahimi, T.; Pun, T.; Nijholt, A.; Patras, I. DEAP: A Database for Emotion Analysis; Using Physiological Signals. IEEE Trans. Affect. Comput. 2012, 3, 18–31. [Google Scholar] [CrossRef] [Green Version]
- Emotiv. Emotiv EPOC+ Headset; Emotiv: San Francisco, CA, USA, 2022. [Google Scholar]
- Koza, J.R. Genetic Programming: On the Programming of Computers by Means of Natural Selection; MIT Press: Cambridge, MA, USA, 1992; Volume 1. [Google Scholar]
- Muñoz, L.; Silva, S.; Trujillo, L. M3GP—Multiclass Classification with GP. In Proceedings of the European Conference on Genetic Programming, Copenhagen, Denmark, 8–10 April 2015. [Google Scholar]
- Sattari, M.A.; Roshani, G.H.; Hanus, R.; Nazemi, E. Applicability of time-domain feature extraction methods and artificial intelligence in two-phase flow meters based on gamma-ray absorption technique. Measurement 2021, 168, 108474. [Google Scholar] [CrossRef]
- Reddy, A.P.; Vijayarajan, V. Audio Compression with Multi-Algorithm Fusion and Its Impact in Speech Emotion Recognition. Int. J. Speech Technol. 2020, 23, 277–285. [Google Scholar] [CrossRef]
- Roshani, M.; Sattari, M.A.; Ali, P.J.M.; Roshani, G.H.; Nazemi, B.; Corniani, E.; Nazemi, E. Application of GMDH neural network technique to improve measuring precision of a simplified photon attenuation based two-phase flowmeter. Flow Meas. Instrum. 2020, 75, 101804. [Google Scholar] [CrossRef]
- Muñoz, L.; Trujillo, L.; Silva, S.; Castelli, M.; Vanneschi, L. Evolving multidimensional transformations for symbolic regression with M3GP. Memetic Comput. 2018, 11, 111–126. [Google Scholar] [CrossRef]
- Xiang, S.; Nie, F.; Zhang, C. Learning a Mahalanobis Distance Metric for Data Clustering and Classification. Pattern Recogn. 2008, 41, 3600–3612. [Google Scholar] [CrossRef]
- Rodriguez Aguiñaga, A.; Realyvásquez-Vargas, A.; López R., M.; Quezada, A. Cognitive Ergonomics Evaluation Assisted by an Intelligent Emotion Recognition Technique. Appl. Sci. 2020, 10, 1736. [Google Scholar] [CrossRef] [Green Version]
- Luke, S.; Panait, L. Lexicographic parsimony pressure. In Proceedings of the GECCO-2002; Morgan Kaufmann Publishers: San Francisco, CA, USA, 2002; pp. 829–836. [Google Scholar]
- Suhaimi, A.S.; Mountstephens, J.T.J. EEG-Based Emotion Recognition: A SOA Review of Current Trends and Opportunities. Comput. Intell. Neurosci. 2020, 19, 171–179. [Google Scholar] [CrossRef]
- Song, T.; Zheng, W.; Song, P.; Cui, Z. EEG Emotion Recognition Using Dynamical Graph Convolutional Neural Networks. IEEE Trans. Affect. Comput. 2020, 11, 532–541. [Google Scholar] [CrossRef] [Green Version]
- Shi, W.; Feng, S. Research on music emotion classification based on lyrics and audio. In Proceedings of the 2018 IEEE 3rd Advanced Information Technology, Electronic and Automation Control Conference (IAEAC), Chongqing, China, 12–14 October 2018; pp. 1154–1159. [Google Scholar] [CrossRef]
- Ullah, H.; Uzair, M.; Mahmood, A.; Ullah, M.; Khan, S.D.; Cheikh, F.A. Internal Emotion Classification Using EEG Signal with Sparse Discriminative Ensemble. IEEE Access 2019, 7, 40144–40153. [Google Scholar] [CrossRef]
- Li, Y.; Zheng, W.; Zong, Y.; Cui, Z.; Zhang, T.; Zhou, X. A Bi-Hemisphere Domain Adversarial Neural Network Model for EEG Emotion Recognition. IEEE Trans. Affect. Comput. 2021, 12, 494–504. [Google Scholar] [CrossRef]
- Hidaka, K.; Qin, H.; Kobayashi, J. Preliminary test of affective virtual reality scenes with head mount display for emotion elicitation experiment. In Proceedings of the 2017 17th International Conference on Control, Automation and Systems (ICCAS), Jeju, Korea, 18–21 October 2017; pp. 325–329. [Google Scholar] [CrossRef]
- Marín-Morales, J.; Higuera-Trujillo, J.L.; Greco, A.; Guixeres, J.; Llinares, C.; Scilingo, E.P.; Alcañiz, M.; Valenza, G. Affective computing in virtual reality: Emotion recognition from brain and heartbeat dynamics using wearable sensors. Sci. Rep. 2018, 8, 13657. [Google Scholar] [CrossRef] [PubMed]
- Fan, J.; Wade, J.W.; Key, A.P.; Warren, Z.E.; Sarkar, N. EEG-Based Affect and Workload Recognition in a Virtual Driving Environment for ASD Intervention. IEEE Trans. Biomed. Eng. 2018, 65, 43–51. [Google Scholar] [CrossRef]
- Soroush, M.Z.; Maghooli, K.; Setarehdan, S.K.; Nasrabadi, A.M. Emotion Classification through Nonlinear EEG Analysis Using Machine Learning Methods. Int. Clin. Neurosci. J. 2018, 5, 135–149. [Google Scholar] [CrossRef]
- Al-Galal, S.A.Y.; Alshaikhli, I.F.T.; bin Abdul Rahman, A.W.; Dzulkifli, M.A. EEG-based emotion recognition while listening to quran recitation compared with relaxing music using valence-arousal model. In Proceedings of the 2015 4th International Conference on Advanced Computer Science Applications and Technologies (ACSAT), Kuala Lumpur, Malaysia, 8–10 December 2015; pp. 245–250. [Google Scholar] [CrossRef]
- Saeed, S.M.U.; Anwar, S.M.; Majid, M.; Bhatti, A.M. Psychological stress measurement using low cost single channel EEG headset. In Proceedings of the 2015 IEEE International Symposium on Signal Processing and Information Technology (ISSPIT), Abu Dhabi, United Arab Emirates, 7–10 December 2015; pp. 581–585. [Google Scholar] [CrossRef]
- Subramanian, R.; Wache, J.; Abadi, M.K.; Vieriu, R.L.; Winkler, S.; Sebe, N. ASCERTAIN: Emotion and Personality Recognition Using Commercial Sensors. IEEE Trans. Affect. Comput. 2018, 9, 147–160. [Google Scholar] [CrossRef]
- Bai, J.; Luo, K.; Peng, J.; Shi, J.; Wu, Y.; Feng, L.; Li, J.; Wang, Y. Music emotions recognition by cognitive classification methodologies. In Proceedings of the 2017 IEEE 16th International Conference on Cognitive Informatics & Cognitive Computing, (ICCI*CC), Oxford, UK, 26–28 July 2017; pp. 121–129. [Google Scholar]
- Dabas, H.; Sethi, C.; Dua, C.; Dalawat, M.; Sethia, D. Emotion classification using EEG signals. In Proceedings of the 2018 2nd International Conference on Computer Science and Artificial Intelligence, Association for Computing Machinery. New York, NY, USA, 24–26 February 2018; pp. 380–384. [Google Scholar] [CrossRef]
- An, Y.; Sun, S.; Wang, S. Naive bayes classifiers for music emotion classification based on lyrics. In Proceedings of the 2017 IEEE/ACIS 16th International Conference on Computer and Information Science (ICIS), Wuhan, China, 24–26 May 2017; pp. 635–638. [Google Scholar] [CrossRef]
- Muñoz, L.; Trujillo, L.; Silva, S. Transfer learning in constructive induction with Genetic Programming. Genet. Program. Evolvable Mach. 2019, 21, 529–569. [Google Scholar] [CrossRef]
- Silva, S.; Luis Muñoz, L.T.V.I.M.C.; Vanneschi, L. Multiclass classification through multidimensional clustering. In Genetic Programming Theory and Practice XIII; Springer: Berlin/Heidelberg, Germany, 2016. [Google Scholar]
- Trujillo, L.; Muñoz, L.; Galván-López, E.; Silva, S. neat Genetic Programming: Controlling bloat naturally. Inf. Sci. 2016, 333, 21–43. [Google Scholar] [CrossRef] [Green Version]
Figure 1.
Emotion distribution and classes distribution based on the Russell circumplex model. This structure allowed us to carry out a multiclass classification scheme.
Figure 1.
Emotion distribution and classes distribution based on the Russell circumplex model. This structure allowed us to carry out a multiclass classification scheme.

Figure 2.
The responses from the research subjects were distributed according to an arousal and valence scale. Higher diameter circles indicate the higher sample frequency of a class.
Figure 2.
The responses from the research subjects were distributed according to an arousal and valence scale. Higher diameter circles indicate the higher sample frequency of a class.

Figure 3.
The special tree with d dimensions stemming from the root node.

Figure 4.
An example of a transformation produced by M3GP for a problem with three classes. On the left are the original data with a low classification accuracy Figure 4a. On the right are the same data transformed into a space where the resulting classification achieves a very good accuracy Figure 4b. The large circles represent the centroids of each class and each data point is marked by a different symbol depending on the class (i.e., dot, cross, small circle).

Figure 5.
M3GP starts with (but is not limited to) a population of one-dimensional transformations. Through mutation (Figure 6b,c), the search can evolve into a multi-dimensional population.
Figure 5.
M3GP starts with (but is not limited to) a population of one-dimensional transformations. Through mutation (Figure 6b,c), the search can evolve into a multi-dimensional population.

Figure 6.
The three possible mutation types in M3GP standard sub-tree, add dimensions and remove dimensions.
Figure 6.
The three possible mutation types in M3GP standard sub-tree, add dimensions and remove dimensions.

Figure 7.
The two possible crossover types in M3GP, standard sub-tree and dimensional.

Figure 8.
The EEG neural network architecture. The basis for this configuration is presented in [11,28].

Figure 9.
The integration of DL into the recognition process. The DL architecture was trained with spectral coefficients and features created by M3GP.
Figure 9.
The integration of DL into the recognition process. The DL architecture was trained with spectral coefficients and features created by M3GP.

Figure 10.
Classification results with ReLU: on the left-hand side is the classification without treatment; on the right-hand side is the classification with the M3GP transformation.
Figure 10.
Classification results with ReLU: on the left-hand side is the classification without treatment; on the right-hand side is the classification with the M3GP transformation.

Figure 11.
Classification results with Tanh: on the left-hand side is the classification without treatment; on the right-hand side is the classification with the M3GP transformation.
Figure 11.
Classification results with Tanh: on the left-hand side is the classification without treatment; on the right-hand side is the classification with the M3GP transformation.

Figure 12.
Classification results with Logistic (Log): on the left-hand side is the classification without treatment; on the right-hand side is the classification with the M3GP transformation.
Figure 12.
Classification results with Logistic (Log): on the left-hand side is the classification without treatment; on the right-hand side is the classification with the M3GP transformation.

Figure 13.
Training and testing validations scores for the DL after M3GP (ReLU function).

Figure 14.
The confusion matrix of the training stages of the reported results obtained after the M3GP transformation for different neural networks (Relu, Tanh and Logistic).
Figure 14.
The confusion matrix of the training stages of the reported results obtained after the M3GP transformation for different neural networks (Relu, Tanh and Logistic).

Figure 15.
The setup flow: M3GP produces a data transformation tree and the neural network runs with the new data in R.
Figure 15.
The setup flow: M3GP produces a data transformation tree and the neural network runs with the new data in R.


Table 1.
The experimentation parameters considered in our DL architecture.
| Parameters | Configuration |
|---|---|
| Train/Test | 70/30 |
| Validation | 10-Fold |
| Alpha value | 0.0002 |
| Maximum iterations | 200 |
| Functions | ReLU, Tanh, and Logistic |
| Output layer | Softmax |
Table 2.
The best results before the M3GP transformation of the dataset.
| Function | AUC | CA | F1 | Precision |
|---|---|---|---|---|
| ReLU | 0.880 | 0.650 | 0.651 | |
| Tanh | 0.880 | 0.655 | 0.655 | |
| Logistic | 0.748 | 0.478 | 0.477 |
Table 3.
The best results after the M3GP transformation of the dataset.
| Function | AUC | CA | F1 | Precision |
|---|---|---|---|---|
| ReLU | 0.991 | 0.920 | 0.920 | |
| Tanh | 0.972 | 0.859 | 0.859 | |
| Logistic | 0.692 | 0.457 | 0.425 |
Table 4.
M3GP setup settings.
| Runs | 10 |
| Population Size | 500 individuals |
| Generations | 100 generations |
| Initial Dimension | 10 dimensions |
| Initialization | 6-depth full initialization [21] |
| Data | 70% Training −30% Tests |
| Operator Probabilities | Crossover , Mutation |
| Function Set | protected as in [21], sine, cosine, exponential, logarithm (abs), power, power, square root (positive), tangent (tan), hyperbolic tangent (tanh) |
| Terminal Set | Ephemeral random constants |
| Bloat Control | 17-depth limit [21] |
| Selection | Lexicographic tournament [29] of size 5 |
| Elitism | Keep best individual |
Table 5.
The accuracy obtained by M3GP, the number of root node features of the best solution found in each dataset, and the original features of each set.
Table 5.
The accuracy obtained by M3GP, the number of root node features of the best solution found in each dataset, and the original features of each set.
| M3GP | MFCC | ARRC | SPEC |
|---|---|---|---|
| Train | 94.4 | 59.9 | 46.3 |
| Test | 39.1 | 39.6 | 40 |
| Root Node Features | 63 | 23 | 13 |
| Original Features | 168 | 168 | 224 |
Table 6.
Performance comparisons between SOA techniques reported in [30]. Similar EEG-based works have reported an overall recognition rate of 82.9%.
Table 6.
Performance comparisons between SOA techniques reported in [30]. Similar EEG-based works have reported an overall recognition rate of 82.9%.
| Classifier | Average Performance |
|---|---|
| Neural Network [31,32,33] | 85.80% |
| Support Vector Machine [34,35,36] | 77.80% |
| K-Nearest Neighbor [33,37,38] | 88.94% |
| Multi-layer Perceptron [38,39,40] | 78.16% |
| Bayes [41,42,43] | 69.62% |
| Extreme Learning Machine [41] | 87.10% |
| K-Means [43] | 78.06% |
| Linear Discriminant Analysis [42] | 71.30% |
| Gaussian Process [44] | 71.30% |
Table 7.
The percentage of classification improvement.
| Fuction | AUC % | CA % | F1 % | Precision % |
|---|---|---|---|---|
| ReLU | 11.1 | 27 | 26.9 | 26 |
| Tanh | 9.2 | 20.4 | 20.4 | 20.8 |
| Logistic | −5.6 | −2.1 | −5.2 | −2.5 |
Publisher’s Note: MDPI stays neutral with regard to jurisdictional claims in published maps and institutional affiliations. |
© 2022 by the authors. Licensee MDPI, Basel, Switzerland. This article is an open access article distributed under the terms and conditions of the Creative Commons Attribution (CC BY) license (https://creativecommons.org/licenses/by/4.0/).
Share and Cite
MDPI and ACS Style
Rodriguez Aguiñaga, A.; Muñoz Delgado, L.; López-López, V.R.; Calvillo Téllez, A. EEG-Based Emotion Recognition Using Deep Learning and M3GP. Appl. Sci. 2022, 12, 2527. https://doi.org/10.3390/app12052527
AMA Style
Rodriguez Aguiñaga A, Muñoz Delgado L, López-López VR, Calvillo Téllez A. EEG-Based Emotion Recognition Using Deep Learning and M3GP. Applied Sciences. 2022; 12(5):2527. https://doi.org/10.3390/app12052527
Chicago/Turabian StyleRodriguez Aguiñaga, Adrian, Luis Muñoz Delgado, Víctor Raul López-López, and Andrés Calvillo Téllez. 2022. "EEG-Based Emotion Recognition Using Deep Learning and M3GP" Applied Sciences 12, no. 5: 2527. https://doi.org/10.3390/app12052527
Note that from the first issue of 2016, this journal uses article numbers instead of page numbers. See further details here.