
Abstract
In the implementation of traditional GP algorithm as models are evolved in a single deme (an environment in which a population of models is evolved) it may tend to produce sub-optimal models with poor generalisation skills due to lack of model diversity. As a solution to above issue, in this study the potential of evolving models in parallel multiple demes with different genetic attributes (parallel heterogeneous environments) and subsequent further evolution of some of the fittest models selected from each deme in another deme called the master deme was investigated, in relation to downscaling of large-scale climate data to daily minimum temperature (Tmin) and daily maximum temperature (Tmax). It was discovered that independent of the climate regime (i.e. warm or cold) and the geographic location of the observation station, a fraction of the fittest models (e.g. 25%) obtained from the last generation of each deme alone are sufficient for the formulation of a diverse initial population of models for the master deme. Also, independent of the climate regime and the geographic location of the observation station, both daily Tmin and Tmax downscaling models developed with the parallel multi-population genetic programming (PMPGP) algorithm showed better generalisation skills compared to that of models developed with the traditional single deme GP, even when the amount of redundant information in the data of predictors was high. The models developed for daily Tmin and Tmax with the PMPGP algorithm simulated fewer unphysically large outliers compared to that of models developed with the GP algorithm.
1 Introduction
For the simulation of the historical climate and the projection of climate into future general circulation models (GCMs) are widely used (Mujumdar and Kumar 2012). Though GCMs are able to adequately simulate the large-scale climate (i.e. global or continental) (Wang et al. 2015) since catchment-scale characteristics such as fine topographical features, land use, and convective processes are coarsely represented in their structures, they are not able to correctly simulate climate at catchment-scale (Chu and Yu 2010). As a solution to this matter, statistical (Liu et al. 2013a; Pour et al. 2014; Erhardt et al. 2015; Manzanas et al. 2018) and dynamical (Laprise 2008; Liu et al. 2013b) downscaling techniques have been developed. In statistical and dynamical downscaling coarse-scale climate data from GCMs are used to derive catchment-scale climate information. Readers are referred to Fowler et al. (2007) and Maraun et al. (2010) for detailed reviews on statistical and dynamical downscaling.
The main objectives of statistical downscaling are; enhancement of spatial details of a predictand, reduction of bias in reanalysis/GCM outputs which may migrate to predictands, and simulation of hydroclimatic variables that are not explicitly produced by GCMs (e.g. streamflows) (Lanzante et al. 2018). The framework of a statistical downscaling exercise in general encompasses; predictand and predictor selection, delineation of an atmospheric domain, reanalysis data and GCM selection, selection of a downscaling technique and a strategy for calibration and validation of the model, model calibration and validation, bias-correction, and projection of catchment-scale climate into future (Sachindra et al. 2014a, b). The performance of a statistical downscaling model depends on the downscaling framework and the data used in model development. In any downscaling framework, predictor selection is regarded as one of the foremost steps (Hammami et al. 2012) which can have a significant impact on the capabilities of a downscaling model. The inclusion of predictors irrelevant to the underlying process, the inclusion of redundant predictors and the omission of relevant predictors are some of the issues related to the development of statistical downscaling models. Irrelevant predictors are uninformative of the underlying process and inject noise into the downscaling model and, hence detrimental to the model performance. Meanwhile, the inclusion of redundant predictors may unnecessarily increase the model complexity without providing any improvement to its performance, and this can even increase the model run time. The omission of relevant predictors from the set of predictors may make the downscaling model incapable of successfully describing the predictand. Therefore, careful selection of relevant predictors omitting redundant and irrelevant information is a paramount requirement in the development of robust and parsimonious downscaling models (Fowler et al. 2007; Maraun et al. 2010).
Selection approaches of predictors for statistical downscaling models can be grouped into three categories; (1) model-independent approaches (or filters), (2) model-dependant approaches (or wrappers), and (3) hybrid approaches. The model-independent predictor selection approaches are based on the strength of linear (Anandhi et al. 2009) or non-linear association between the predictors and the predictand (Sharma 2000). The use of Pearson correlation (Pearson 1896) to identify linear associations and mutual information to identify non-linear associations between predictors and the predictands are examples for the use of model-independent predictor selection approaches. Model-independent approaches are computationally inexpensive but may tend to select a set of predictors with data redundancies. In order to reduce the redundancies in the data of predictors identified using model-independent approaches, principal component analysis (PCA) is widely used (Anandhi et al. 2008). Furthermore, partial correlation (Stennett-Brown et al. 2017) and partial mutual information criterion (Sharma 2000) can also reduce the influx of redundant information into a model.
The model-dependant predictor selection approaches are dependent on the calibration/validation and the structure of the downscaling model (Coulibaly 2004). The use of genetic programming (GP) or stepwise regression to identify inputs to a downscaling model are examples of model-dependant input selection approaches. In model-dependant predictor selection approaches, inputs are selected based on the performance of the downscaling model, and in general iterative calibration/validation of the model is required. Since, models are specifically tuned to a set of predictor data they achieve a better degree of performance (Galelli and Castelletti 2013). However, the higher computational cost associated with model-dependant predictor selection approaches is a concern. Hybrid predictor selection approaches are a combination of both model-independent and model-dependant approaches.
The correlated nature of predictors induces information redundancy and collinearity in the input set to any statistical model (Galelli and Castelletti 2013). This is more pronounced in the case of downscaling models since the data of any predictor of interest are highly correlated over space (Sachindra et al. 2014c). The non-linearity in the predictor–predictand relationships and inherent complexities in the natural processes of interest make it ineffective to apply traditional predictor selection approaches, such as correlation analysis (May et al. 2008, 2011) and traditional dimensionality/redundancy reduction techniques such as PCA (Sachindra et al. 2013). In comparison to other environmental modelling exercises where the dimensionality of the predictor data set is mostly in the order of tens (e.g. streamflow forecasting), in some statistical downscaling exercises the dimensionality of the predictor data set could be in the order of hundreds or even thousands (Spak et al. 2007). It is accepted that a combination of predictors leads to a statistical downscaling model with better performance in comparison to a downscaling model built with a single predictor (Lutz et al. 2012). However, the selection of a proper combination of predictors to a statistical downscaling model still remains a challenge (Yang et al. 2017). Therefore, there is a need to further investigate on non-linear input selection approaches which can effectively reduce information redundancy, omit irrelevant information, reduce the dimensionality of input data and hence select an optimum set of predictors to statistical downscaling models.
The relationships between catchment-scale hydroclimatic variables (predictands) and large-scale atmospheric information (predictors) are often highly non-linear. Machine learning techniques have been proven effective in capturing highly non-linear relationships between predictors and predictands (Sachindra et al. 2013; Devak et al. 2015). However, most of the machine learning techniques suffer from the drawback of being black-box in nature, where the relationships between predictors and predictands and the underlying processes remain hidden (Sehgal et al. 2018). Among the plethora of regression techniques used in statistical downscaling, genetic programming (GP) which is inspired by Darwin’s theory of biological evolution can be considered as a unique technique as it; (1) models both linear and non-linear relationships, (2) identifies an optimum set of predictors while evolving predictors–predictand relationships, (3) produces explicit equations relating predictors to the predictand (predictors–predictand relationships) and (4) filters out irrelevant and redundant information in the set of predictors through evolution (Koza 1992). The traditional/conventional GP algorithm starts with the generation of a random population of models and continues to evolve them (improve model fitness) by performing genetic operations. Although traditional GP algorithm possesses the above advantages, as models are evolved in a single deme (an environment in which a population of models is evolved) it may tend to produce sub-optimal models with poor generalization skills due to limited model diversity (variety among models) (Fernandez et al. 2003). Also, owing to the inherent randomness in the algorithm, GP often displays limited ability to identify a unique optimum set of predictors influential on a given predictand (Sachindra et al. 2018a). The evolution of populations of models in parallel multiple demes is seen as a potential way to increase model diversity and hence it may reduce the chances of evolving sub-optimal models.
In this study the potential of evolving populations of models in parallel multiple demes with different genetic attributes (parallel heterogeneous environments) and subsequent further evolution of some of the fittest models selected from each deme in an environment called the “master deme” was investigated, in relation to downscaling of large-scale climate information to daily minimum and maximum temperature. The performance of downscaling models evolved with novel PMPGP was also compared with that of models developed with traditional single deme GP. So far in the literature of the field of hydroclimatology, the use of parallel multiple demes to evolve models employing GP has not been seen (Danandeh Mehr et al. 2018).
The major innovations of this study are:
-
Use of parallel heterogeneous environments for boosting model diversity to evolve optimal models
In the PMPGP algorithm, models were initially evolved in parallel environments where cross-over, mutation and replication probabilities are different. Since the models were evolved in different parallel environments the diversity among the models was expected to be high. Therefore, the possibility of evolving optimal models was also high.
-
Investigation of impacts of different migration policies on model performance
In the PMPGP algorithm, some of the models evolved in different parallel environments were allowed to migrate into a common environment called the “master deme” where further evolution occurred. Different migration policies govern which models will migrate into the master deme.
-
Investigation of degree of resistance of this novel PMPGP algorithm to redundant information in inputs
Redundant information in inputs can increase the model complexity and reduce model generalization skills. The ability of the models developed with PMPGP algorithm to minimise the adverse impacts of redundant information present in the inputs was investigated.
-
Investigation of generation of unphysically large outliers produced by models developed with traditional GP algorithm and this novel PMPGP algorithm
Traditional GP-based models, in general, tend to simulate unphysically large outliers (e.g. a value 100 times or larger than the observed maximum). It was investigated whether PMPGP-based models also generate such unphysically large outliers.
2 Study area and data
In this research, Japan was selected as the study area as it is an ideal location for testing statistical downscaling approaches due to its diverse topography and climate. The total areal extent of Japan is about 377,727 km2, and its climate varies significantly over land. The southern region of Japan displays a subtropical climate, while the northern region experiences sub-arctic (sub-frigid) climate (Murazaki et al. 2010). In this study, 15 temperature observation stations were considered in such way that they represent; relatively cold and warm conditions, different geographic locations (e.g. the side of the Sea of Japan and the side of the North Pacific Ocean) and elevations. Also, caution was exercised to select stations that contained a minimum amount of missing observations. Table 1 shows the details of the 15 temperature observation stations selected for this investigation. As seen in Table 1 the percentages of missing data at the majority of the stations for both daily minimum and maximum temperature were extremely small. These small amounts of missing data were infilled with the average values of temperature computed from the preceding and succeeding days. At Ebina, Yamanaka and Otsuki stations the missing data percentages were relatively higher, and hence using a regression equation with the data at Kawaguchiko station those missing data were infilled. Figure 1 shows the locations of these observation stations in Japan.

Study area with locations of observation stations considered in this study
For calibrating and validating downscaling models large-scale climate information is required. For this purpose, daily NCEP/NCAR (National Centres for Environmental Prediction/National Centre for Atmospheric Research) reanalysis data were obtained corresponding to the period 1977–2017 from the National Oceanic and Atmospheric Administration/Earth System Research Laboratory (NOAA/ESRL) Physical Sciences Division. Reanalysis data provide comprehensive portraits of climate conditions over long periods of time covering large spatial extents (Parker 2016). NCEP/NCAR reanalysis data are produced employing data assimilation, a process that uses both observations and numerical model simulations to estimate climate conditions (Kalnay et al. 1996). As stated by Brands et al. (2012) NCEP/NCAR reanalysis data set is the most popularly used reanalysis data set in the field of climate research. The observations of daily minimum and maximum temperature for the 15 stations were obtained from the Japan Meteorological Agency (www.data.jma.go.jp/gmd/risk/obsdl/index.php) for the same period. The observations of daily minimum and maximum temperature used in this study have originated from the automated meteorological data acquisition system (AMeDAS) of the Japan Meteorological Agency. The AMeDAS is a network of automated weather monitoring stations located across Japan with an average density of a station per 17 km2 (Vuillaume and Hearth 2018). These stations relay weather information at every 1 or 10-min to a data centre where quality control measures are in place to remove any abnormal values. In addition to that weather stations are periodically inspected, and instruments are calibrated to ensure the quality of observations (Yato et al. 2017). These observations were used to provide point scale information to downscaling models in their calibration phase. In validation, simulations produced by downscaling models were verified against these observations.
3 Techniques
In this study two non-linear regression techniques were employed to develop downscaling models; (1) traditional genetic programming (GP) and (2) parallel multi-population genetic programming (PMPGP). Sections 3.1 and 3.2 provide the details of GP and PMPGP.
3.1 Genetic programming
GP algorithm mimics Darwin’s theory of biological evolution which states that ‘the fittest individuals in a population will survive and reproduce’. GP is inspired by the popular optimisation technique genetic algorithm (GA). A detailed review of the applications of GP algorithm and some of its variants (e.g. gene expression programming) in the field of water resources research is provided by Danandeh Mehr et al. (2018). The traditional/conventional GP algorithm involves several main steps as listed below (Koza 1992). Figure 2 depicts the traditional GP algorithm in a flow chart. The details of the main attributes of the GP algorithm are given in Table 2.

GP algorithm in a flow chart
-
1.
Randomly generate an initial population of downscaling models (predictor–predictand relationships).
-
2.
Assess the fitness/performance of downscaling models in the initial population.
-
3.
Create a mating pool by randomly selecting downscaling models from the initial population, considering their fitness.
-
4.
Generate the next population of models by executing genetic operations on models in the mating pool.
-
5.
Continue steps 2–4 until a certain termination criterion is met, and then select the fittest (best) downscaling model.
3.2 Parallel multi population genetic programming
In the traditional GP algorithm, steps shown in Sect. 3.1 are employed within a single deme (single environment) with a single set of attributes (e.g. probabilities of crossover, mutation and replication). One major shortcoming of the traditional GP algorithm is that since models are evolved in a single deme with a single set of GP attributes it limits the diversity among model. For the effective evolution of a population of models, there should be a sufficient degree of diversity in the population. In nature, limited genetic diversity may lead to the evolution of individuals with abnormalities, and in GP, limited diversity among models may lead to premature convergence of the algorithm resulting in a sub-optimal model (Fernandez et al. 2003) with poor generalisation skills. The limited diversity among models in a population is mainly caused by the lack of uniqueness among the models in the initial population and, high replication and low mutation probabilities.
This study employed a novel evolutionary algorithm in which downscaling models were initially evolved in parallel multiple demes with different GP attributes. The parallel multiple demes refer to independent environments where the evolution of downscaling models was performed with the traditional GP algorithm with different GP attributes (heterogeneous demes). Then, some of the better performing models in each parallel deme were allowed to migrate to another deme called the ‘master deme’ where they were further evolved with the traditional GP algorithm, and then the fittest model was selected. This novel approach allowed the generation of a diverse initial population of models for the master deme. The main steps of this novel PMPGP algorithm are listed below.
-
1.
Execution of steps 1–5 shown in Sect. 3.1 with different GP attributes in each parallel deme (e.g. different crossover and mutation probabilities).
-
2.
Selection of a subset of mathematical equations (i.e. downscaling models) from each parallel deme based on fitness (e.g. 25% of the fittest models in the last generation of each deme).
-
3.
Formation of an initial population of models for the master deme using the models selected in step 2.
-
4.
Execution of steps 2–5 shown in Sect. 3.1 in the master deme, and selection of the fittest model from the master deme.
The topology/architecture of the PMPGP algorithm used in this study is shown in Fig. 3. As depicted in Fig. 3, in the current study 5 parallel heterogeneous demes were used to evolve models for the master deme. The migration policy is the criterion that decides which models in each parallel deme will migrate to the master deme (e.g. 25% of the fittest models in the last generation of each deme). In the current study, the impact of different migration policies on the model performance was also investigated. For details on the migration policies used in this study, readers are referred to Sect. 4.7.1.

Topology/architecture of parallel multi-population genetic programming used in this study
4 Methodology
The main steps involved in overall methodology (downscaling framework) employed in this study are; predictand selection, atmospheric domain delineation, probable predictor selection, determination of association between probable predictors–predictands, ranking of probable predictors (based on strength of correlation, mutual information and predictive potential), identification of a subset of probable predictors as potential predictors (based on rankings), reduction of data redundancies in larger sets of potential predictors, evolution of downscaling models with the PMPGP and GP algorithms, assessment of model performance and comparison of performance of models evolved with the PMPGP and GP algorithms. Figure 4 shows the main steps in the overall methodology used in this study in a flow chart. In Fig. 4, in each box, the number of the section in the paper which contains the details of the step/s is also indicated within square brackets (e.g. [4.2] refers to Sect. 4.2).

Overall methodology used in this study in a flow chart
4.1 Predictand selection
In this study, daily minimum temperature (Tmin) and daily maximum temperature (Tmax) were selected as the predictands. Tmin and Tmax are inputs to most of the hydrological models as they are influential on the water availability in a catchment (e.g. temperature governs evaporation rate) (Abbaspour et al. 2015). Also, daily Tmin and Tmax are indicative of cold snaps and heatwaves, respectively. Therefore, in order to demonstrate the methodology, in this study daily Tmin and Tmax were selected as the predictands.
4.2 Delineation of an atmospheric domain
In a statistical downscaling study atmospheric domain is the area of the atmosphere corresponding to which the large-scale atmospheric information is obtained in order to provide inputs to a downscaling model (Sachindra and Perera 2016). The location and extent of the atmospheric domain are decided based on the location of the study area and the nature of the atmospheric processes which influence the predictand. Japan’s climate is influenced by several large-scale atmospheric phenomena as shown in Table 3. In order to adequately capture the influence of these large-scale atmospheric phenomena on the catchment-scale climate, an atmospheric domain with 21 × 25 (N = 21 × 25 = 525) grid points along the latitudinal and longitudinal directions was delineated over Japan, as depicted in Fig. 5. The atmospheric domain spans over latitudes 10.0N°–60.0N° and longitudes 110.0E°–170.0E°, and it has a resolution of 2.5° in both directions. In this study, the atmospheric domain shown in Fig. 5 was used for both daily Tmin and Tmax for all observation stations to select inputs to downscaling models.

Atmospheric domain used in this study
4.3 Probable predictor selection
Probable predictors are the most likely predictors to influence a given predictand (Sachindra et al. 2014a). In general, probable predictors are identified considering the past downscaling exercises and also studying the physical processes of the atmosphere influential on the predictand (Anandhi et al. 2009). Probable predictors are common to all calendar months and may vary depending on the predictands as well as the region of interest. It is important to select probable predictors based on the physics governing the predictand of interest. This avoids the likely introduction of irrelevant information to the downscaling model. In this study, 5 probable predictors common to both daily Tmin and Tmax, and all stations were chosen. These probable predictors are; surface air temperature (SAT), mean sea level pressure (MSLP), net shortwave radiation (NSWR), net longwave radiation (NLWR) and net latent heat flux (NLHF). SAT is indicative of the mean status of air temperature, MSLP is indicative of the large-scale circulations that are responsible for the distribution of thermal energy, NSWR, NLWR and NLHF are main components of the Earth’s radiative budget which governs its temperature.
4.4 Probable predictor–predictand association
As demonstrated by Wilby et al. (2002), the influence of individual predictors on daily Tmin and Tmax may vary markedly on a calendar monthly basis. Therefore, it is important to identify the most influential predictors on predictands for each calendar month to well characterise the predictor–predictand relationships for each observation station. In this study, each probable predictor data set had a dimensionality of 21 × 25 = 525, which is equal to the number of grid points in the atmospheric domain. Since there were 5 probable predictors the dimensionality of the entire probable predictor data set was 21 × 25 × 5 = 2625 (per predictand).
As stated above, the dimensionality of the probable predictor data set in this study was in the order of thousands and contained large amounts of redundant and irrelevant information. Due to potential issues such as overfitting/underfitting in calibration/validation and increased computational time, it is not advised to introduce a large number of predictors to a downscaling model (Mujumdar and Kumar 2012). In the current study, in order to reduce the amount of redundant and irrelevant information in the probable predictor data, firstly, the association between each probable predictor at each grid point in the atmospheric domain and each predictand (i.e. daily Tmin and Tmax) for each calendar month was computed using three different filters; (1) Pearson correlation coefficient (CC), (2) mutual information (MI) and (3) predictive potential (PP). Then based on the strength of probable predictor–predictand association, subsets of probable predictors called potential predictors were extracted (detailed in Sect. 4.5). The use of three different filters enabled the assessment of their impacts on the model performance. Apart from the above three filters, another filter which is essentially an extension of CC was also tested as a special case (detailed in Sect. 4.6).
CC between data of probable predictor Px1 at a given grid point in the atmospheric domain and data of predictand Py1 (e.g. daily Tmin) at an observation station is given by Eq. 1. In Eq. 1, t = number of data pairs in the data sets of Px1 and Py1, and \(\bar{P}_{x1}\) and \(\bar{P}_{y1}\) refer to their respective averages. The values of CC range between − 1 and + 1, where a CC value of 0 refers to no liner association and a value of − 1 or + 1 refers to a perfect negative or positive linear association between a predictor and a predictand (Ratner 2009). In this investigation, the absolute values of CC (magnitude only) were considered in quantifying the strength of association between the probable predictors and the predictands. Unlike MI and PP, CC is a measure of linear association between the predictors and the predictand.
MI is a measure that quantifies the amount of information contained in one random variable about another random variable. In this investigation, MI is the information obtained about a predictand, from a predictor. MI between predictand Py1 and any probable predictor Px1 at a given grid location in the atmospheric domain was computed using Eq. 2. Values of MI range between 0 and + ∞, where a value of 0 refers to no mutual information while the larger the value of MI the higher the mutual information. In Eq. 2, P(Px1) and P(Py1) refer to the marginal distributions of Px1 and Py1 respectively, and P(Px1·Py1) refers to the joint distribution of Px1 and Py1.
PP is a measure of the ability of any probable predictor Px1 at a given grid point in the atmospheric domain to solely explain a predictand Py1 at an observation station. In this investigation, for each probable predictor Px1 for each grid point in the atmospheric domain, a GP-based model was evolved to simulate predictand Py1. The performance of each of these models was assessed in terms of root mean square error (RMSE). RMSE is an indicator of the average absolute bias per data point in a time series, and its inverse is an indicator of the ability of a probable predictor to independently simulate the predictand of interest. PP of a probable predictor Px1 at a given grid point was calculated using Eq. 3. In Eq. 3, t = number of data points in the data set of Py1, and Oi and Mi refer to the observed and simulated values of Py1 respectively. PP varies between 0 and + ∞, and the higher the value the better the ability of a given probable predictor Px1 at a given grid point to independently simulate the predictand Py1.
4.5 Ranking of probable predictors and extraction of potential predictors
Once the association between probable predictors and predictands (i.e. daily Tmin and Tmax) was determined using CC, MI and PP, for each station for each calendar month, the grid points in the atmospheric domain were ranked from the best to the worst corresponding to each of the above three filters separately. Then a k (1 ≤ k ≤ N; N = number of grid points) number of best-ranked grid points in the atmospheric domain were selected for each predictand for each calendar month considering each of the above three filters separately. Above step was applied to each station separately. This procedure enabled the selection of data of probable predictors corresponding to the most influential grid locations, and they are called potential predictors (subsets of data of probable predictors). This process yielded k × n number of data sets for each predictand for each calendar month, where n is the number of probable predictors (in this study n = 5). The value of k was increased from 1 to 5 (k = {1, 2, 3, 4, 5}) progressively to define sets of potential predictors with increasing amounts of information. As an example; when k = 1, each probable predictor contributed with one set of data forming a set of potential predictors of size 1 × n; when k = 2, each probable predictor contributed with two sets of data forming a set of potential predictors of size 2 × n. Each potential predictor data set for each calendar month was then standardised with its mean and standard deviation. Standardisation removes the effect of the order of magnitude of data and their units. The increase in the value of k increased the amount of redundant information flowing into the downscaling models. This enabled the assessment of the impact of redundant information in inputs on the performance of GP and PMPGP-based downscaling models. Also, since all probable predictors {SAT, MSLP, NSWR, NLWR, NLHF} were allowed to contribute to each set of potential predictors (defined by different values of k) with some of their data sets, above predictor selection approach presented a unique opportunity to experiment the performance of evolutionary algorithms GP and PMPGP with various different combinations of predictors.
4.6 Reduction of data redundancies in large sets of predictors
As stated earlier when the value of k is increased, the amount of information flowing into the downscaling models also increases. Larger values of k may enable the inclusion of large-scale atmospheric influences originating in different regions of the atmospheric domain in the set of potential predictors. Therefore, there is a need to investigate the impacts of large-scale atmospheric influences originating in different regions of the atmospheric domain on the performance of downscaling models. However, with the increase in the information flowing into the models (i.e. increase in the value of k), there is a significant chance for some data redundancies to occur in the sets of potential predictors. This is because each probable predictor contains data that are highly correlated over the atmospheric domain (Ghosh and Mujumdar 2008).
The presence of redundancies in predictor data is limited for relatively smaller values of k, but when the value of k increases the chances of redundancies to occur in the predictor data largely increase. Minor data redundancies (caused by smaller values of k = {1, 2, 3, 4, 5}) in the inputs to downscaling models are not expected to affect the performance of the downscaling models, as evolution is likely to discard most of the redundant information. However, large data redundancies may delay the evolution of models, and lead to unnecessary complexities in models. As an example, if k = 10, then the dimensionality of the potential predictor data set becomes k × n = 10×5 = 50 (in this study n = 5). Although the dimensionality of the set of potential predictors has reduced drastically compared to that of probable predictors (21×25×5 = 2625), still it contains a significant amount of redundant information owing to the strong spatial associations between the data sets. Therefore, when the value of k is large (say k > 5), the data set should be further refined to reduce the overly large amounts of redundant information which will flow into the models.
The use of principal component analysis (PCA) to extract a few principal components (PCs) which preserve bulk of the variance present in the original set of predictors can be regarded as the most commonly used redundancy and dimensionality reduction technique in downscaling (Anandhi et al. 2009; Salvi and Ghosh 2013; Devak and Dhanya 2016). However, it has been documented that, in certain instances, the use of PCs as inputs can deteriorate the model performance (Klein and Walsh 1983; Huth 1999; Sachindra et al. 2013). Furthermore, Sehgal et al. (2018) stated that the use of PCA with a set of predictors with different distributions violates the assumption that predictors are drawn from the same underlying distribution. Owing to the above issues associated with PCA, in this study instead of PCA, a representative grid location (RGL) technique was used in reducing the redundancies (and dimensionality) in the data of predictors. This RGL technique identified the least inter-correlated (spatially) data sets for each predictor for values of k = {5, 10, 15, 20, 25}. The main steps involved in the application of the RGL technique are given below. These steps were applied to each station for each predictand (i.e. daily Tmin and Tmax) for each calendar month (i.e. January–December) for each value of k (k = {5, 10, 15, 20, 25}) separately.
-
1.
Calculate the spatial-correlations (using Pearson correlation) between the data sets pertaining to all grid locations in the atmospheric domain for a given probable predictor Pxi. In other words, as shown in Fig. 6, the correlations between the data of any probable predictor Pxi at any grid point {i, j} and data of probable predictor Pxi at all other grid points are calculated. In this study, the values of i and j varied between 1–25 (longitudinal direction) and 1–21 (latitudinal direction), respectively. This procedure yields a correlation matrix which provides the correlation between the data of probable predictor Pxi at any two grid points.
Fig. 6 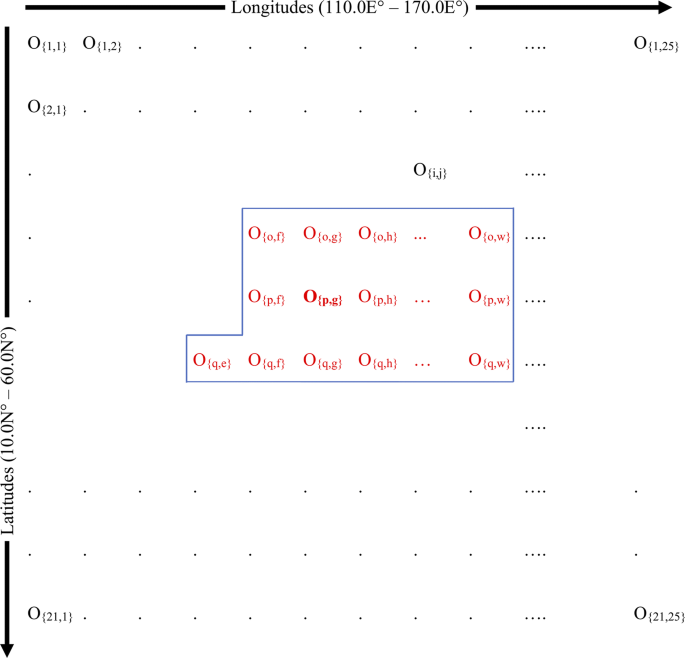
Identification of representative grid locations (grid points are denoted with “Ο”)
-
2.
Using the above correlation matrix identify the data set of Pxi which displays the highest number of high correlations (in this study above the correlation threshold = 0.90) with the data sets of Pxi at other grid locations. The grid location of the data set which displayed the highest number of high correlations with the data sets at other grid locations is identified as the first RGL for Pxi. In Fig. 6, for example, data at grid point {p, g} (shown in bold red text) are highly correlated with the data at z number of grid points (shown in non-bold red text bounded by the blue box). Since, there is no other grid point where data of Pxi show more than z number of highly correlated grid points, the grid point {p, g} is identified as the first RGL.
-
3.
Remove the data pertaining to the first RGL along with the data sets that are highly correlated with the data at the first RGL from the original data set of Pxi. For example, data of Pxi pertaining to the grid points bounded by the blue box shown in Fig. 6 are removed from the original data set of Pxi, thus the correlation matrix shrinks.
-
4.
Perform above steps 2 and 3 on the rest of the data of Pxi to identify the second RGL and continue until no more RGLs can be found for Pxi.
-
5.
Calculate the correlations between the data of Pxi corresponding to each RGL and the observations of the predictand.
-
6.
Based on the correlations calculated in step 5 rank the data sets of RGLs of Pxi from the most correlated to the least correlated with the observations. Then for each value of k = {5, 10, 15, 20, 25} the most correlated 5, 10, 15, 20 and 25 sets of data of RGLs of Pxi are selected, respectively.
-
7.
Thereafter, perform steps 1–6 on all other probable predictors (e.g. Px1, Px2, … Pxi, … Pxn). Finally, combine the data sets of all probable predictors identified in step 6 for each k value separately, and use as the input data to the downscaling models. For example, when k = 10, each probable predictor contributed with the 10 most correlated data sets of RGLs (with the data of the predictand) identified in step 6 to the set of inputs to the downscaling models.
-
8.
Repeat the above steps 1–7 for each calendar month for each station for each predictand (i.e. Tmin and Tmax).

The data corresponding to RGLs for a given predictor Pxi are least correlated over space, hence the chances of data redundancies in the inputs to downscaling models are minimised. Henceforth, the use of CC in conjunction with RGL is referred to as CC + RGL. Although, CC + RGL filters out some of the redundant information, during this process the data sets that are most correlated with the predictand may also be discarded.
4.7 Downscaling model development
In the past literature, downscaling models based on; the calendar months (e.g. Sachindra et al. 2018b), wet and dry seasons (e.g. Chen et al. 2010), four seasons; summer, autumn, winter and spring (e.g. Timbal et al. 2009) and the whole set of data considering all 12 calendar months together (e.g. Goly et al. 2014) have been developed. Sachindra et al. (2018a) stated that the development of downscaling models for each calendar month with the potential predictors separately selected for each calendar month yields better performing models. This is due to the fact that calendar monthly potential predictor selection and model development enables better characterization of both intra and inter-seasonal variations in the predictor–predictand relationships. Hence, in the current study, once the potential predictors were identified, downscaling models were developed for each calendar month for each station separately. For calibration (i.e. evolution) of GP and PMPGP-based downscaling models, data of potential predictors and predictands corresponding to the period 01st Jan 1977–31st Dec 1996 (the 1st 50% of data) were used. The data pertaining to the period 01st Jan 1997–31st Dec 2016 (the 2nd 50% of data) were used for the model validation. In general, in statistical modelling, 50–80% of data are used for the calibration and the rest is used for the validation of the models (Koukidis and Berg 2009; Anandhi et al. 2009). The partitioning of data into equal proportions enabled a fair comparison between the performance of a model in the calibration and validation phases avoiding any impact of population size on the model performance assessment. In the present investigation, downscaling models were initially built with the PMPGP algorithm and then their performances were compared with that of models developed with the GP algorithm. Sections 4.7.1 and 4.7.2 detail the development of models with the PMPGP and GP algorithms respectively.
4.7.1 PMPGP-based model development
For the development of downscaling models for daily Tmin and Tmax with the PMPGP algorithm, the combinations of filters and k values shown in Table 4 were considered. For the execution of the PMPGP algorithm, the set of attributes shown in Table 5 were used. As seen in Table 5, 5 demes with different mutation and crossover probabilities were employed to evolve a diverse initial population of models for the master deme. The other attributes were common to all demes (e.g. mathematical function set). Different combinations of mutation and crossover probabilities assisted in increasing diversity among models across the demes. In each deme, 100 models were evolved up to 100 generations, and the number of models in the master deme varied depending on the migration policy. The 5 migration policies tested in this study are detailed in Table 6. As seen in Table 4 there were 20 combinations of filters and k values, and each of these combinations was used under 5 migration policies yielding a total of 100 experimental setups (per station) for the models based on the PMPGP algorithm.
As stated earlier, in this study, 5 different migration policies were tested and their details are provided in Table 6. The number of models that migrated from each deme to the master deme was dependant on the nature of the migration policy. As shown in Table 6, the 1st migration policy which is the simplest of all policies only allowed models from the last generation of each deme to migrate to the master deme, whereas all other policies allowed the migration of models also from some of the subsequent generations (e.g. 99th, 98th …). The notion behind the selection of models from the last generation was that in each deme the most evolved models (fittest models) exist in the last generation, hence it is logical to allow a certain percentage of the fittest models from the last generation to migrate to the master deme. Nonetheless, certain traits of models (e.g. sub-trees) in the subsequent generations might be lost as evolution continues but such traits may still be useful in evolving models in the master deme. Therefore, in the migration policies 2–5, apart from the selection of models from the last generation of each deme, models were also selected from some of the subsequent generations. In addition to that, policies 2–5 allowed the formation of larger populations of models in the master deme compared to that of policy 1, enabling the investigation of the impact of population size in the master deme on the performance of PMPGP-based models (larger populations of models may implicitly increase the model diversity).
Once the models were developed for each station using the PMPGP algorithm, by assessing the model performance using normalised mean square error (NMSE), the most suitable migration policy and the combinations of filters and k values were identified. In this study, NMSE was computed by dividing the mean square error with the standard deviation of observations of the predictand. Unlike, mean square error and root mean square error, NMSE is less sensitive to the order of the magnitude of data of the predictands, hence it can be used to compare the performance of models pertaining to different climate regimes (Sachindra et al. 2018b).
4.7.2 GP-based model development
In this investigation, the GP-based downscaling models were developed for the comparison of their performance with that of PMPGP-based downscaling models. For a fair performance comparison between PMPGP-based models and GP-based models, it was required to decide the values of the attributes of the GP algorithm to be in compliance with those of the PMPGP algorithm pertaining to the most suitable migration policy. Therefore, after the performance assessment of the PMPGP-based downscaling models, for the development of the GP-based downscaling models, the GP algorithm’s attributes were defined as given in Table 7. The stopping criterion and the population size of the GP algorithm were decided based on the most suitable migration policy employed in the PMPGP algorithm as detailed in Sect. 5.2. In the execution of the GP-algorithm, as the stopping criterion, the number of generations was set to 600. This was because, in the execution of the PMPGP algorithm, models in each of the 5 demes and the master deme were evolved up to 100 generations (equivalent to a total of 600 generations). All the other attributes in the GP algorithm were the same as the ones used in the master deme of the PMPGP algorithm (see Tables 5 and 7).
5 Results and discussion
5.1 Impacts of different filters, k values and migration policies on performance of PMPGP-based models
Figures 7 and 8 show the NMSE of the fittest model extracted from each deme and the master deme for daily Tmin and Tmax pertaining to stations at Fuji and Kawaguchiko respectively. For the demonstration of the performance of PMPGP-based models, stations located at Fuji and Kawaguchiko were selected as they represent relatively very cold and very warm temperature regimes, respectively. In each sub-figure in Figs. 7 and 8 the horizontal axis refers to calibration and validation phases of each deme and the master deme (e.g. ‘Deme 1 C’ and ‘Deme 1 V’ respectively refer to the calibration and validation phases of deme 1, and similarly ‘Deme M C’ and ‘Deme M V’ respectively refer to the calibration and validation phases of the master deme). The vertical axis of each sub-figure in Figs. 7 and 8 refers to different combinations of filters and k values (e.g. ‘CC k = 1’ refers to the use of correlation coefficient along with a k value of 1 and similarly ‘CC + RGL k = 20’ refers to the use of correlation coefficient in conjunction with representative grid location technique with a k value of 20).

NMSE of the fittest model in each deme and the master deme for daily Tmin at Fuji observation station

NMSE of the fittest model in each deme and the master deme for daily Tmax at Kawaguchiko observation station
As seen in Figs. 7 and 8, for daily Tmin at Fuji station and daily Tmax at Kawaguchiko station, the models displayed characteristic patterns of performance across all migration policies. The characteristic pattern for daily Tmin was a bit different from that of daily Tmax, however, for a given predictand (i.e. Tmin) the pattern was consistent across all migration policies. Similar patterns of performance were also seen at all station for daily Tmin and Tmax (results not shown). This indicated that the PMPGP algorithm was insensitive to the migration policy, on condition that some of the fittest models in the last generation of each deme were allowed to migrate to the master deme. In other words, it was evident that a fraction (e.g. 25%) of the fittest models in the last generation of each deme alone is sufficient for the formulation of a diverse initial population of models for the master deme. Also, the population size in the master deme (see Table 6 for population sizes) did not show any clear impact on the performance of the fittest model in the master deme. Furthermore, irrespective of the migration policy it was clear that the fittest model in the master deme, in general, shows better performance compared to the fittest models in all other demes, in both calibration and validation. This was because the initial population of models in the master deme was pre-evolved (in other demes initial population was randomly generated) and the diversity among the models in the master deme was higher compared to that of other demes (models originated in different environments).
In general, at all stations for both daily Tmin and Tmax the fittest model in the master deme evolved by the PMPGP algorithm with the potential predictors identified by CC, MI and PP filters (CC and MI in particular) showed good generalisation skills, irrespective of the k value and the migration policy. This indicated that the PMPGP algorithm was able to resist data redundancies in the sets of potential predictors. However, it was found that at all stations for both daily Tmin and Tmax, the models (in all demes and the master deme) developed with potential predictors identified by CC + RGL filter show signs of significant underfitting in validation, irrespective of the k value and the migration policy. The poor generalisation skills of models developed with potential predictors identified by CC + RGL filter was most likely caused by the fact that while the RGL technique removes highly spatially correlated predictor data sets, it may also remove data sets of predictors which show high correlations with the predictand. Therefore, it should be noted that in the use of CC + RGL filter there is a trade-off between the reduction of data redundancies and the loss of some of the most correlated predictor data with the predictand. Considering the above finding, it can be stated that in developing a model using the PMPGP algorithm it is more important to include the most correlated predictor data with the predictand in the set of potential predictors rather than attempting to reduce redundancies or to include influences originating in different regions of the atmospheric domain.
5.2 Comparison of performance of GP and PMPGP-based downscaling models
As detailed in Sect. 5.1, the performance of the fittest model in the master deme was insensitive to migration policy on condition that a fraction of the fittest models in each deme were allowed to migrate to the master deme. Also, CC + RGL filter was proven to be unsuccessful in producing a model with good generalisation skills. Furthermore, CC, MI and PP filters showed more or less similar performance in terms of NMSE. Therefore, for the performance comparison between the GP-based and PMPGP-based models, the GP-based models were only run with the potential predictors identified by CC and MI filters. Both MI and PP are non-linear filters whereas CC is a linear filter, hence, only CC and MI filters were used to provide inputs to the GP-based models. In the execution of the GP algorithm, its attributes were defined as shown in Table 7 (see Sect. 4.7.2). Under migration policy 1, the master deme contained 125 models per generation, in order to compare the performance of GP-based models, the GP algorithm was run with 125 models per generation up to 600 generations. Figures 9 and 10 show the NMSE of the fittest models evolved by the PMPGP and GP algorithms for all 15 stations for daily Tmin and Tmax respectively. In Figs. 9 and 10, ‘Master D C’ and ‘Master D V’ refer to the performance of the fittest model in the master deme evolved by the PMPGP algorithm in calibration and validation respectively, whereas ‘Single P C’ and ‘Single P V’ refer to the performance of the fittest model evolved by the traditional single deme GP algorithm respectively. Figures S1 and S2 in the supplementary material show the box plots depicting the performance of models developed with the PMPGP and GP algorithms with different k values (1, 2, 3, 4 and 5) and different association measures (i.e. CC and MI).


Performance of downscaling models developed for daily Tmin with the PMPGP (100 models per deme per generation) and GP (100 models per generation) algorithms in terms of NMSE


Performance of downscaling models developed for daily Tmax with the PMPGP (100 models per deme per generation) and GP (100 models per generation) algorithms in terms of NMSE
In Figs. 9 and 10 it was seen that at all stations for the majority of filter and k value combinations, the GP-based models displayed higher NMSE values in validation compared to that of PMPGP-based models. According to Fig. 9, at Ebina (MI, k = 4), Yamanaka (CC, k = 5) and Nagasaki (CC, k = 5; MI, k = 3) stations abnormally high NMSE values associated with PMPGP-based Tmin models were seen. Similarly, according to Fig. 10, at Fuji (CC, k = 5) and Otsuki (CC, k = 4) stations abnormally high NMSE values associated with PMPGP-based Tmax models were seen. Thus, it was understood that abnormally high NMSE values associated with PMPGP-based models were seen only when the k values were high (k = 3, 4, and 5). However, even when the k values were relatively smaller (e.g. k = 1, 2), unlike PMPGP-based models, GP-based models displayed abnormally high NMSE values in many instances. According to Fig. 9, at Fuji (CC, k = 1), Kawaguchiko (MI, k = 1), Otsuki (CC, k = 3), Cape Muroto (MI, k = 4), Kitami (CC, k = 3), Wajima (CC, k = 2), Niigata (CC, k = 1) and Maebashi (MI, k = 4) stations abnormally high NMSE values associated with GP-based Tmin models were observed. Similarly, according to Fig. 10 at Fuji (CC, k = 2), Kofu (MI, k = 1), Ebina (CC, k = 1; MI, k = 2), Kawaguchiko (CC, k = 1; MI, k = 2), Yamanaka (MI, k = 1), Cape Muroto (MI, k = 5), Sukumo (CC, k = 4; MI, k = 3; MI, k = 4), Kitami (CC, k = 1) and Niigata (CC, k = 1; MI, k = 3) stations abnormally high NMSE values associated with GP-based Tmax models were observed. From the above details, it is clear that GP-based models were more vulnerable to failure even when the inputs do not contain a lot of redundant information. On the other hand, PMPGP-based models showed a higher degree of resistance to redundant information and were far less vulnerable to failure due to the presence of redundant information in inputs. This indicated that the models evolved with the PMPGP algorithm display better generalisation skills compared to those developed with the traditional single deme GP. Hence, it can be stated that an increase in the model diversity assists in evolving models with better generalisation skills.
Furthermore, it was observed that PMPGP algorithm takes significantly much less time to complete evolving models compared to that of GP algorithm. In a model test run PMPGP algorithm (with migration policy 1) took 55 min to complete evolving models for a station (12 calendar monthly models) while traditional GP algorithm took 108 min for the same task. It was clear that the simpler traditional GP algorithm took almost twice as much time as the PMPGP algorithm. In other words, the more complex PMPGP algorithm ran almost twice as fast as the traditional GP algorithm. This was because unlike GP, PMPGP algorithm systematically boosts the diversity among the models and hence evolution occurs faster.
In certain instances, models developed with the GP algorithm, in particular, showed very high NMSE (the ceiling value of NMSE in Figs. 7 and 8 was set to 2, but some values of NMSE largely exceeded this ceiling). A close examination of the time series of simulations revealed that the models developed with both GP and PMPGP algorithms tend to produce unphysically large outliers (e.g. 100 times larger than the observed maximum) and these outliers lead to large values of NMSE. This aspect was significantly more pronounced in the simulations produced by the GP-based models, indicating that the GP-based downscaling models are more likely to simulate unphysically large values compared to that of PMPGP-based downscaling models. However, for both GP and PMPGP-based models this tendency of simulating unphysically large values of the predictands did not display a clear relationship with the k values. This indicated that data redundancies are not in direct connection with the simulation of unphysically large values of predictands. Sachindra et al. (2018b) stated that quite often machine learning techniques simulate outliers and some of these outliers can be unphysically large. In the GP and PMPGP algorithms, the mathematical function set contained ex (exponential) and ln (natural logarithm) which are useful in capturing extremes in the time series of a predictand. However, these functions may create hyper-sensitive regions such as asymptotic regions in the predictor–predictand relationships in downscaling models, where some value/s of potential predictors may trigger unphysically large values of the predictand.
As an example, Fig. 11 shows the scatter plots for daily Tmin at Fuji observation station and daily Tmax at Kawaguchiko observation station corresponding to models developed with the GP and PMPGP algorithms. As seen in Fig. 11a, c, the models developed with both the GP and PMPGP algorithms produced very similar scatter for daily Tmin at Fuji observation station in the calibration phase. Whereas in the validation phase, the scatter produced by the models developed with both the GP and PMPGP algorithms for daily Tmin at Fuji observation station also looked very similar to each other as seen in Fig. 11b, d. However, the model developed with the GP algorithm for daily Tmin at Fuji observation station, simulated an unphysically large outlier with a magnitude of 65,535.5 °C in its validation phase. Since that outlier is overwhelmingly large it was not shown in the scatter plot in Fig. 11b. This was the reason why in Fig. 9a, the GP based model displayed a high NMSE in its validation phase (since the value of NMSE was very large it was not shown). In Fig. 11e, f, the scatter of daily Tmax at Kawaguchiko observation station for the calibration and validation periods of the GP-based model are presented respectively. As seen in Fig. 11e, f it was clear that the scatter has a major island and a minor island in both calibration and validation periods. The major island of the scatter lies along the 45-degree line while the minor island of the scatter lies on the x-axis of the plots. The minor island of the scatter was due to the fact that in a certain calendar month the model did not evolve as expected (even after 600 generations of evolution) due to the lack of model diversity in the initial population. However, the generation of such sub-optimal models was not seen in the implementation of the PMPGP algorithm owing to relatively higher model diversity in the master deme.

Scatter plots for daily Tmin at Fuji station and daily Tmax at Kawaguchiko station corresponding to models developed with GP and PMPGP algorithms
5.3 Impact of increase in population size in GP algorithm on model performance
In general, GP is sensitive to the number of models in a population. In fact, larger populations of models may even lead to higher levels of diversity. In the implementation of GP, the initial population is randomly generated. When the population size is increased, purely due to the increase in the number of models the diversity/variety among the models can also increase by chance. Nonetheless, in such case, since there is no dedicated mechanism to increase model diversity, increasing the population size is not seen as an effective way to increase model diversity and hence enhance the model optimality. In order to determine the validity of this theoretical argument, using GP algorithm models were evolved up to 100 generations with populations of 600 models per generation (other attributes remained as shown in Table 7). Then the performances of these GP-based models were compared with that of original PMPGP-based models which were evolved up to 100 generations with 100 models per generation per deme (see PMPGP attributes in Table 5). The performances of these models in terms of NMSE are shown in Figs. 12 and 13 for Tmin and Tmax respectively. According to Figs. 12 and 13, it was understood that when the GP algorithm was run with 600 models per generation, models tend to show fewer abnormally high NMSE values compared to that when the GP algorithm was run with 100 models per generation (see Figs. 9, 10). Also, when the number of models was increased from 100 to 600 per generation, GP-based models began to show a higher degree of resistance to redundant information in inputs. However, yet, the models evolved using the PMPGP-algorithm with 100 models per generation per deme displayed better generalisation skills owing to parallel evolution which systematically boosted the diversity among models. This leads to the conclusion that an increase in the population size may increase model diversity and improve model optimality, but still, parallel evolution of models is seen as a more effective approach to improve model optimality.


Performance of downscaling models developed for daily Tmin with the PMPGP (100 models per deme per generation) and GP (600 models per generation) algorithms in terms of NMSE


Performance of downscaling models developed for daily Tmax with the PMPGP (100 models per deme per generation) and GP (600 models per generation) algorithms in terms of NMSE
5.4 Caveats of the study
In this investigation, only one architecture/topology of PMPGP was tested. The architecture of PMPGP used in this study employed 5 demes with different mutation and crossover probabilities to generate a diverse population of models for the master deme. Initial investigations indicated that the use of 3–4 demes does not lead to much improvement in the performance of the fittest model in the master deme in comparison to the fittest models in the other demes. Once the number of demes was increased to 5, the PMPGP algorithm tended to evolve models in the master deme which showed better performance compared to the models in the other demes. However, in this study, the increase in the number of demes above 5, and its impacts on the model performance was not investigated. Furthermore, in this study, the differences between the 5 demes were limited to the differences in mutation and crossover probabilities. However, the other attributes such as the selection criterion of models for the mating pool can also be varied across the demes in order to increase the diversity among the models that migrate to the master deme.
As mentioned in Sect. 4, the methodology used in this study involved a number of steps. However, out of these steps, only the determination of association between probable predictors–predictands and the evolution of downscaling models with the PMPGP and GP algorithms, were computationally demanding. In the assessment of predictor–predictand associations, the computational time is directly related to the number of grid points in the atmospheric domain, as calculations are performed at each individual grid point. Therefore, in order to minimise the computational time related to the assessment of predictor–predictand associations; depending on the study area, the predictand and the large-scale atmospheric circulations influential on the predictand, the domain should be objectively delineated (neither overly large nor too small). Also, for determining the association between the probable predictors and a given predictand one single association measure such as MI can be used rather than several measures as used in this study (in this study several association measures were used to investigate their impacts on the model performance).
It is worth mentioning that, GCM outputs show low CCs with observations in comparison to reanalysis data. This is due to the bias in the GCM outputs and the low temporal synchronicity between GCM outputs and observations, particularly pronounced at fine temporal scales (e.g. daily) (Eden et al. 2012). Therefore, when a downscaling model developed with reanalysis data is run with GCM outputs it tends to show a decline in performance. However, a low CC between the GCM outputs and the predictand does not necessarily mean that GCM outputs do not contain the information required to simulate the predictand. There can be a high level of mutual information between the GCM outputs and the predictand even when the CC is low, particularly when a highly non-linear relationship between predictors and the predictand is present (Sharma 2000). Predictands such as precipitation and streamflow have a higher likelihood of having highly non-linear relationships with the predictors. In such cases, the use of MI for identifying potential predictors from probable predictors is seen as a better option than the use of CC for the same purpose. However, still, there will be some bias in the simulations of the downscaling models run with GCM outputs. In order to reduce that bias present in the outputs of the downscaling models, an appropriate bias-correction method should be used.
In this study, the models in each deme and the master deme were evolved up to 100 generations. However, the impact of the number of generations on the performance of the fittest model in the master deme was not investigated. The evolution of models up to 100 generations was based on the notion that the higher the number of generations the evolution is performed the greater the chances of over-evolving the models. The over-evolution may cause the models to overfit in calibration and underfit in validation. On the other hand, under-evolution (evolved up to a very small number of generations) may create models which perform poorly in both calibration and validation.
Sachindra et al. (2018a) stated that when the traditional single deme GP algorithm is run repeatedly it tends to produce markedly different predictor–predictor relationships, and the likelihood of identification of a unique optimum set of predictors from the set of potential predictors is quite low. The current investigation did not gauge the potential of the PMPGP algorithm to recognise a unique optimum set of predictors. Such investigation will need the repetitive execution of the PMPGP algorithm for a large number of runs and comparison of results with that of traditional single deme GP. Perhaps, such investigation is not very important in downscaling temperature but in downscaling a much complex variable such as streamflows.
6 Conclusions
The conclusions drawn from the results of this investigation are as follows.
-
1.
Independent of the climate regime (i.e. warm or cold) and the geographic location of the observation station, downscaling models developed for both daily minimum temperature (Tmin) and daily maximum temperature (Tmax) with the parallel multi-population genetic programming (PMPGP) algorithm showed no sensitivity to migration policy, on condition that a fraction (e.g. 25%) of the fittest models in the last generation of each deme were allowed to migrate to the master deme. Furthermore, the performance (in both calibration and validation) of the fittest model evolved in the master deme was not dependent on the population size of the master deme which was dependent on the migration policy. Therefore, it was evident that a small fraction of the fittest models (e.g. 25%) obtained from the last generation of each deme alone are sufficient for the formulation of a diverse initial population of models for the master deme.
-
2.
In general, at all stations for both daily Tmin and Tmax, the fittest model in the master deme evolved by the PMPGP algorithm run with the potential predictors identified using correlation coefficient (CC) and mutual information (MI) showed good generalisation skills even for higher levels of redundant information. This indicated that the PMPGP algorithm was able to effectively discard redundant information in the sets of potential predictors. Furthermore, in the application of the PMPGP algorithm it was found that it is more important to include the data of predictors that are most correlated with the predictand, in the set of potential predictors in developing a downscaling model rather than attempting to reduce data redundancies or to include large-scale influences originating in different regions of the atmospheric domain.
-
3.
Independent of the climate regime (i.e. warm or cold) and the geographic location of the observation station, both daily Tmin and Tmax downscaling models developed with the PMPGP algorithm showed better generalisation skills compared to that of models developed with the traditional single deme GP. This indicated that the increase in diversity among models in the master deme in the PMPGP algorithm leads to the evolution of models with better generalisation skills.
-
4.
In certain instances, models developed for daily Tmin and Tmax with both PMPGP and GP algorithms simulated unphysically large outliers (e.g. a value which is 100 times larger than the observed maximum). This tendency was more pronounced particularly among the GP-based models compared to that of PMPGP-based models. The simulation of unphysically large values did not show any clear dependence on the climate regime, the geographic location of the observation station and the amount of redundant information present in the sets of potential predictors. The generation of unphysically large values of predictands is suspected to be due to the use of mathematical functions ex (exponential) and ln (natural logarithm) which may form asymptotic regions in the predictor–predictand relationships.
References
Abbaspour KC, Rouholahnejad E, Vaghefi S, Srinivasan R, Yang H, Kløve B (2015) A continental-scale hydrology and water quality model for Europe: calibration and uncertainty of a high-resolution large-scale SWAT model. J Hydrol 524:733–752
Anandhi A, Srinivas VV, Nanjundiah RS, Kumar DN (2008) Downscaling precipitation to river basin in India for IPCC SRES scenarios using support vector machine. Int J Climatol 28:401–420
Anandhi A, Srinivas VV, Kumar DN, Nanjundiah RS (2009) Role of predictors in downscaling surface temperature to river basin in India for IPCC SRES scenarios using support vector machine. Int J Climatol 29:583–603
Brands S, Gutiérrez JM, Herrera S, Cofiño AS (2012) On the use of reanalysis data for downscaling. J Clim 25:2517–2526
Chen TS, Yu PS, Tang YH (2010) Statistical downscaling of daily precipitation using support vector machines and multivariate analysis. J Hydrol 385:13–22
Chu JL, Yu PS (2010) A study of the impact of climate change on local precipitation using statistical downscaling. J Geophys Res 115:D10105. https://doi.org/10.1029/2009jd012357
Coulibaly P (2004) Downscaling daily extreme temperatures with genetic programming. Geophys Res Lett 31:L16203. https://doi.org/10.1029/2004gl020075
Danandeh Mehr A, Nourani V, Kahya E, Hrnjica B, Sattar AMA, Yaseen ZM (2018) Genetic programming in water resources engineering: a state-of-the-art review. J Hydrol 566:643–667. https://doi.org/10.1016/j.jhydrol.2018.09.043
Devak M, Dhanya CT (2016) Downscaling of precipitation in Mahanadi Basin, India using support vector machine, K-nearest neighbour and hybrid of support vector machine with K-nearest neighbour. In: Raju N (ed) Geostatistical and geospatial approaches for the characterization of natural resources in the environment. Springer, Cham
Devak M, Dhanya CT, Gosain AK (2015) Dynamic coupling of support vector machine and K-nearest neighbour for downscaling daily rainfall. J Hydrol 525:286–301
Eden JM, Widmann M, Grawe D, Rast S (2012) Skill, correction, and downscaling of GCM-simulated precipitation. J Clim 25:3970–3984
Enomoto T, Hoskins BJ, Matsuda Y (2003) The formation mechanism of the Bonin high in August. Q J R Meteor Soc 129:157–178
Erhardt RJ, Band LE, Smith RL, Lopes BJ (2015) Statistical downscaling of precipitation on a spatially dependent network using a regional climate model. Stoch Environ Res Risk Assess 29:1835–1849
Fernandez F, Tomassini M, Vanneschi L (2003) An empirical study of multipopulation genetic programming. Genet Program Evol Mach 4:21–51
Fowler HJ, Blenkinsop S, Tebaldi C (2007) Linking climate change modelling to impacts studies: recent advances in downscaling techniques for hydrological modelling. Int J Climatol 27:1547–1578
Galelli S, Castelletti A (2013) Tree-based iterative input variable selection for hydrological modelling. Water Resour Res 49:4295–4310
Ghosh S, Mujumdar PP (2008) Statistical downscaling of GCM simulations to streamflow using relevance vector machine. Adv Water Resour 31:132–146
Goly A, Teegavarapu RSV, Mondal A (2014) Development and evaluation of statistical downscaling models for monthly precipitation. Earth Interact 18:1–28
Grossman MJ, Zaiki M, Nagata R (2015) Interannual and interdecadal variations in typhoon tracks around Japan. Int J Climatol 35:2514–2527
Hammami D, Lee TS, Ouarda TBMJ, Le J (2012) Predictor selection for downscaling GCM data with LASSO. J Geophys Res Atmos. https://doi.org/10.1029/2012jd017864
Huth R (1999) Statistical downscaling in central Europe: evaluation of methods and potential predictors. Clim Res 13:91–101
Japan Meteorological Agency (2018) http://www.data.jma.go.jp/gmd/cpd/longfcst/en/tourist_japan.html. Accessed 10 Aug 2018
Kalnay E, Kanamitsu M, Kistler R, Collins W, Deaven D, Gandin L, Iredell M, Saha S, White G, Woollen J, Zhu Y, Chelliah M, Ebisuzaki W, Higgins W, Janowiak J, Mo KC, Ropelewski C, Wang J, Leetmaa A, Reynolds R, Jenne R, Joseph D (1996) The NCEP/NCAR 40-year reanalysis project. Bull Am Meteor Soc 77:437–471
Klein WH, Walsh JE (1983) A comparison of pointwise screening and empirical orthogonal functions in specifying monthly surface temperature from 700 mb data. Mon Weather Rev 111:669–673
Koukidis EN, Berg AA (2009) Sensitivity of the statistical downscaling model (SDSM) to reanalysis products. Atmos Ocean 47:1–18. https://doi.org/10.3137/ao924.2009
Koza JR (1992) Genetic programming: on the programming of computers by means of natural selection. MIT Press, Cambridge
Lanzante JR, Dixon KW, Nath MJ, Whitlock CE, Adams-Smith D (2018) Some pitfalls in statistical downscaling of future climate. Bull Am Meteor Soc 99:791–803
Laprise R (2008) Regional climate modelling. J Comput Phys 227:3641–3666
Liu W, Fu G, Liu C, Song X, Ouyang R (2013a) Projection of future rainfall for the North China plain using two statistical downscaling models and its hydrological implications. Stoch Environ Res Risk Assess 27:1783–1797
Liu Y, Xie L, Morrison JM, Kamykowski D (2013b) Dynamic downscaling of the impact of climate change on the ocean circulation in the Galápagos Archipelago. Adv Meteorol. https://doi.org/10.1155/2013/837432
Lutz K, Jacobeit J, Philipp A, Seubert S, Kunstmann H, Laux P (2012) Comparison and evaluation of statistical downscaling techniques for station-based precipitation in the Middle East. Int J Climatol 32:1579–1595
Manzanas R, Lucero A, Weisheimer A, Gutiérrez JM (2018) Can bias correction and statistical downscaling methods improve the skill of seasonal precipitation forecasts? Clim Dyn 50:1161–1176
Maraun D, Wetterhall F, Ireson AM, Chandler RE, Kendon EJ, Widmann M, Brienen S, Rust HW, Sauter T, Themel M, Venema VKC, Chun KP, Goodess CM, Jones RG, Onof C, Vrac M, Thiele-Eich I (2010) Precipitation downscaling under climate change: recent developments to bridge the gap between dynamical models and the end user. Rev Geophys. https://doi.org/10.1029/2009rg000314
Matsumoto S, Ninomiya K, Yoshizumi S (1971) Characteristic features of Baiu front associated with heavy rainfall. J Meteor Soc Jpn 49:267–281
May R, Maier H, Dandy G, Fernando TG (2008) Non-linear variable selection for artificial neural networks using partial mutual information. Environ Modell Softw 23:1312–1326
May R, Dandy G, Maier H (2011) Review of input variable selection methods for artificial neural networks. In: Suzuki K (ed) Artificial neural network methodological advances and biomedical applications. IntechOpen, London. https://doi.org/10.5772/16004
Miyasaka T, Nakamura H (2005) Structure and formation mechanisms of the northern hemisphere summertime subtropical highs. J Clim 18:5046–5065
Mujumdar PP, Kumar DN (2012) Floods in a changing climate: hydrologic modelling (international hydrology series). Cambridge University Press, Cambridge. https://doi.org/10.1017/cbo9781139088428
Murazaki K, Kurihara K, Sasaki H (2010) Dynamical downscaling of JRA-25 precipitation over Japan using the MRI-regional climate model. SOLA 6:141–144
Ogi M, Tachibana Y, Yamazaki K (2004) The connectivity of the winter North Atlantic Oscillation (NAO) and the summer Okhotsk high. J Meteor Soc Jpn 82:905–913
Parasuraman K, Elshorbagy A, Carey SK (2007) Modelling the dynamics of the evapotranspiration process using genetic programming. Hydrolog Sci J 52:563–578
Parker WS (2016) Reanalyses and observations: what’s the difference? Bull Am Meteor Soc 97:1565–1572
Pearson K (1896) Mathematical contributions to the theory of evolution III regression heredity and panmixia. Philos Trans R Soc S Afr 187:253–318
Pour SH, Harun SB, Shahid S (2014) Genetic programming for the downscaling of extreme rainfall events on the East Coast of Peninsular Malaysia. Atmosphere 5:914–936
Ratner B (2009) The correlation coefficient: its values range between 1+/− 1, or do they? J Target Meas Anal Mark 17:139–142
Sachindra DA, Perera BJC (2016) Statistical downscaling of general circulation model outputs to precipitation accounting for non-stationarities in predictor–predictand relationships. PLoS ONE 11:e0168701. https://doi.org/10.1371/journal.pone.0168701
Sachindra DA, Huang F, Barton A, Perera BJC (2013) Least square support vector and multi-linear regression for statistically downscaling general circulation model outputs to catchment streamflows. Int J Climatol 33:1087–1106
Sachindra DA, Huang F, Barton A, Perera BJC (2014a) Statistical downscaling of general circulation model outputs to precipitation-part 1: calibration and validation. Int J Climatol 34:3264–3281
Sachindra DA, Huang F, Barton A, Perera BJC (2014b) Statistical downscaling of general circulation model outputs to precipitation-part 2: bias-correction and future projections. Int J Climatol 34:3282–3303
Sachindra DA, Huang F, Barton A, Perera BJC (2014c) Statistical downscaling of general circulation model outputs to catchment scale hydroclimatic variables: issues, challenges and possible solutions. J Water Clim Change 5:496–525
Sachindra DA, Ahmed K, Rashid Md Mamunur, Shahid S, Perera BJC (2018a) Statistical downscaling of precipitation using machine learning techniques. Atmos Res 212:240–258
Sachindra DA, Ahmed K, Shahid S, Perera BJC (2018b) Cautionary note on the use of genetic programming in statistical downscaling. Int J Climatol 38:3449–3465
Salvi K, Ghosh S (2013) High-resolution multisite daily rainfall projections in India with statistical downscaling for climate change impacts assessment. J Geophys Res Atmos 118:3557–3578
Sehgal V, Lakhanpal A, Maheswaran R, Khosa R, Sridhar V (2018) Application of multi-scale wavelet entropy and multi-resolution Volterra models for climatic downscaling. J Hydrol 556:1078–1095
Sharma A (2000) Seasonal to interannual rainfall probabilistic forecasts for improved water supply management: part 1—a strategy for system predictor identification. J Hydrol 239:232–239
Spak S, Holloway T, Lynn B, Goldberg R (2007) A comparison of statistical and dynamical downscaling for surface temperature in North America. J Geophys Res Atmos 112:D08101. https://doi.org/10.1029/2005jd006712
Stanislawska K, Krawiec K, Kundzewicz ZW (2012) Modelling global temperature changes with genetic programming. Comput Math App 64:3717–3728
Stennett-Brown RK, Jones JJP, Stephenson TS, Taylor MA (2017) Future Caribbean temperature and rainfall extremes from statistical downscaling. Int J Climatol 37:4828–4845
Timbal B, Fernandez E, Li Z (2009) Generalization of a statistical downscaling model to provide local climate change projections for Australia. Environ Modell Softw 24:341–358
Vuillaume J, Hearth S (2018) Dynamic downscaling based on weather types classification: an application to extreme rainfall in South-East Japan. J Flood Risk Manag 11:e12340. https://doi.org/10.1111/jfr3.12340
Wang J, Swati FNU, Stein ML, Kotamarthi VR (2015) Model performance in spatiotemporal patterns of precipitation: new methods for identifying value added by a regional climate model. J Geophys Res Atmos 120:1239–1259
Wilby R, Dawson C, Barrow E (2002) SDSM—a decision support tool for the assessment of regional climate change impacts. Environ Modell Softw 17:145–157
Wu B, Wang J (2002) Winter arctic oscillation, Siberian High and East Asian winter monsoon. Geophys Res Lett 29:1897. https://doi.org/10.1029/2002gl015373
Yabusaki S, Tase N, Shimano Y (2010) Temporal variation of stable isotopes in precipitation at Tsukuba, Ogawa and Utsunomiya City in Japan. In: Taniguchi M, Holman IP (eds) Groundwater response to changing climate imprint. CRC Press, London, pp 55–66
Yang C, Wang N, Wang S (2017) A comparison of three predictor selection methods for statistical downscaling. Int J Climatol 37:1238–1249
Yato H, Nomura Y, Umehara K, Hosomichi A, Kawano S, Mouri H, Hagiya S (2017) Automated meteorological data acquisition system (AMeDAS) in Japan and field experiments to determine the effects of its observation environment. In: WMO international conference on automatic weather stations (ICAWS-2017). Offenbach am Main, Germany, 24–26 Oct 2017. https://www.wmo.int/pages/prog/www/IMOP/AWS-conference/ICAWS-2017_Topic_3.html. Accessed 12 April 2019
Acknowledgements
This work was supported by Japan Society for Promotion of Science (JSPS) KAKENHI Grant Number 17F17372.
Author information
Authors and Affiliations
Corresponding author
Additional information
Publisher's Note
Springer Nature remains neutral with regard to jurisdictional claims in published maps and institutional affiliations.
Electronic supplementary material
Below is the link to the electronic supplementary material.
Rights and permissions
Open Access This article is distributed under the terms of the Creative Commons Attribution 4.0 International License (http://creativecommons.org/licenses/by/4.0/), which permits unrestricted use, distribution, and reproduction in any medium, provided you give appropriate credit to the original author(s) and the source, provide a link to the Creative Commons license, and indicate if changes were made.
About this article

Cite this article
Sachindra, D.A., Kanae, S. Machine learning for downscaling: the use of parallel multiple populations in genetic programming. Stoch Environ Res Risk Assess 33, 1497–1533 (2019). https://doi.org/10.1007/s00477-019-01721-y
Published:
Issue Date:
DOI: https://doi.org/10.1007/s00477-019-01721-y