
An Experimental Investigation of WAG Injection in a Carbonate Reservoir and Prediction of the Recovery Factor Using Genetic Programming

 , , ,
, , ,
Abstract
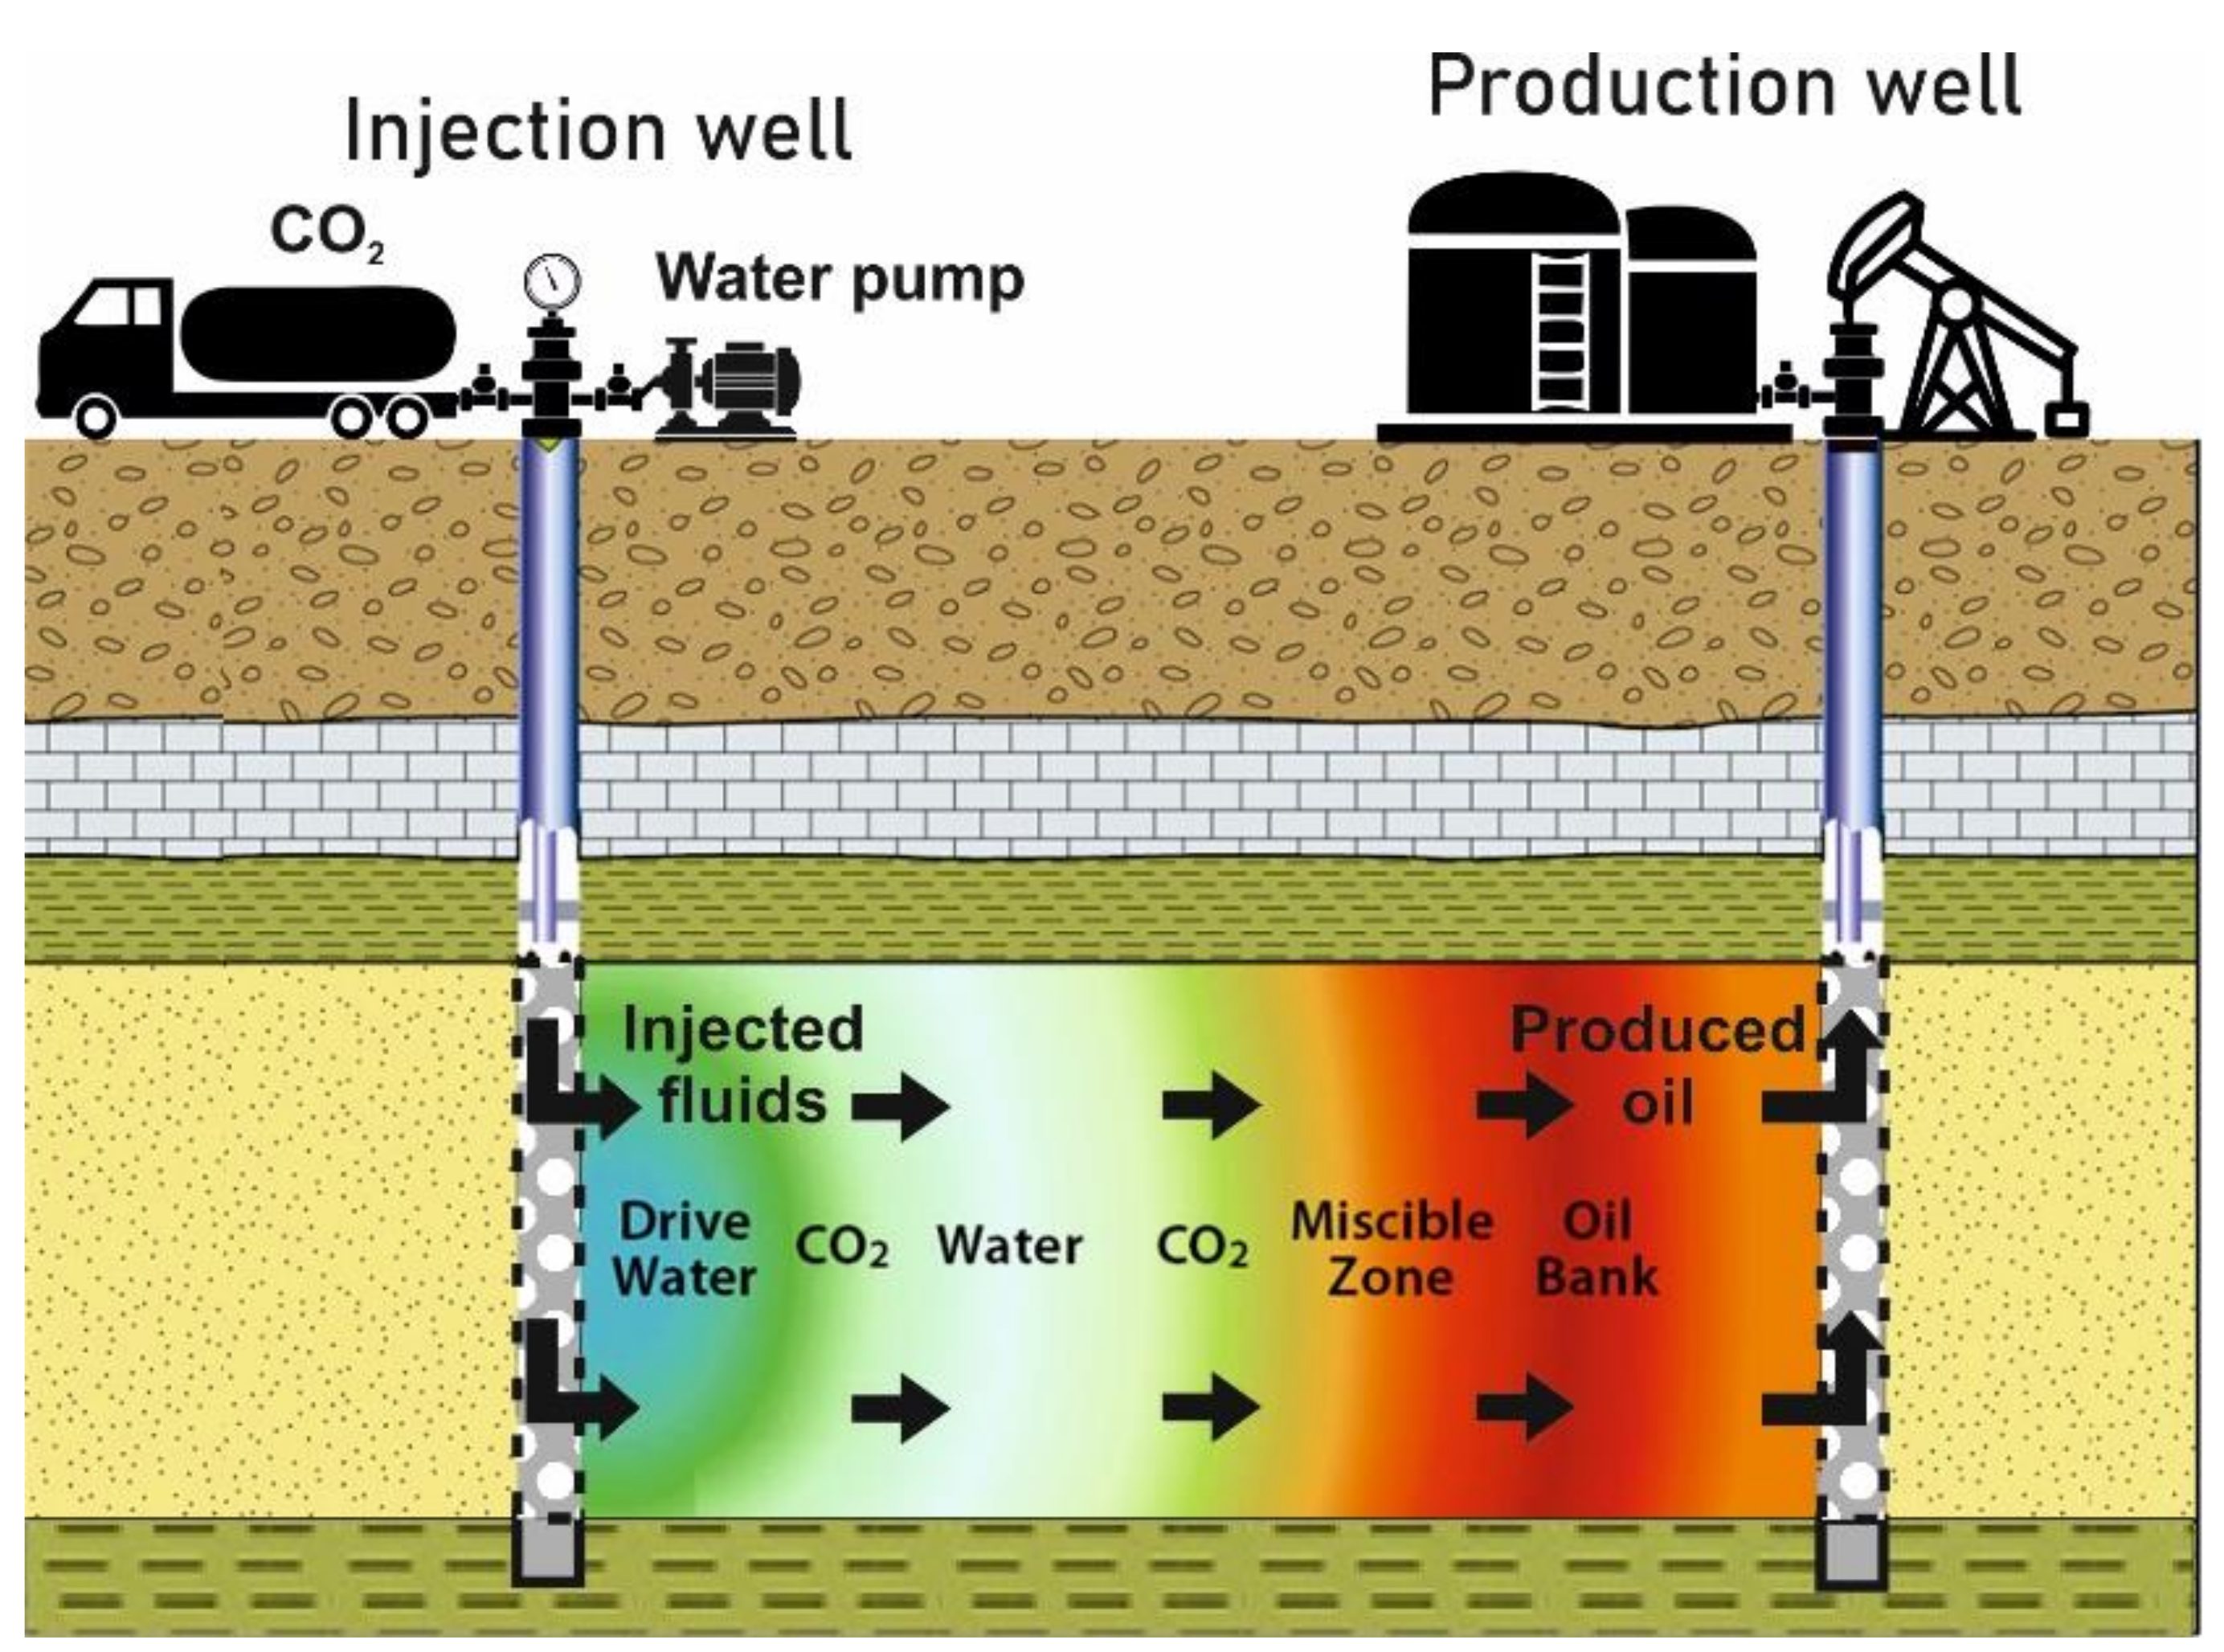
:1. Introduction
2. Materials and Methods
2.1. Reservoir and Injected Fluids
2.2. Rock Material
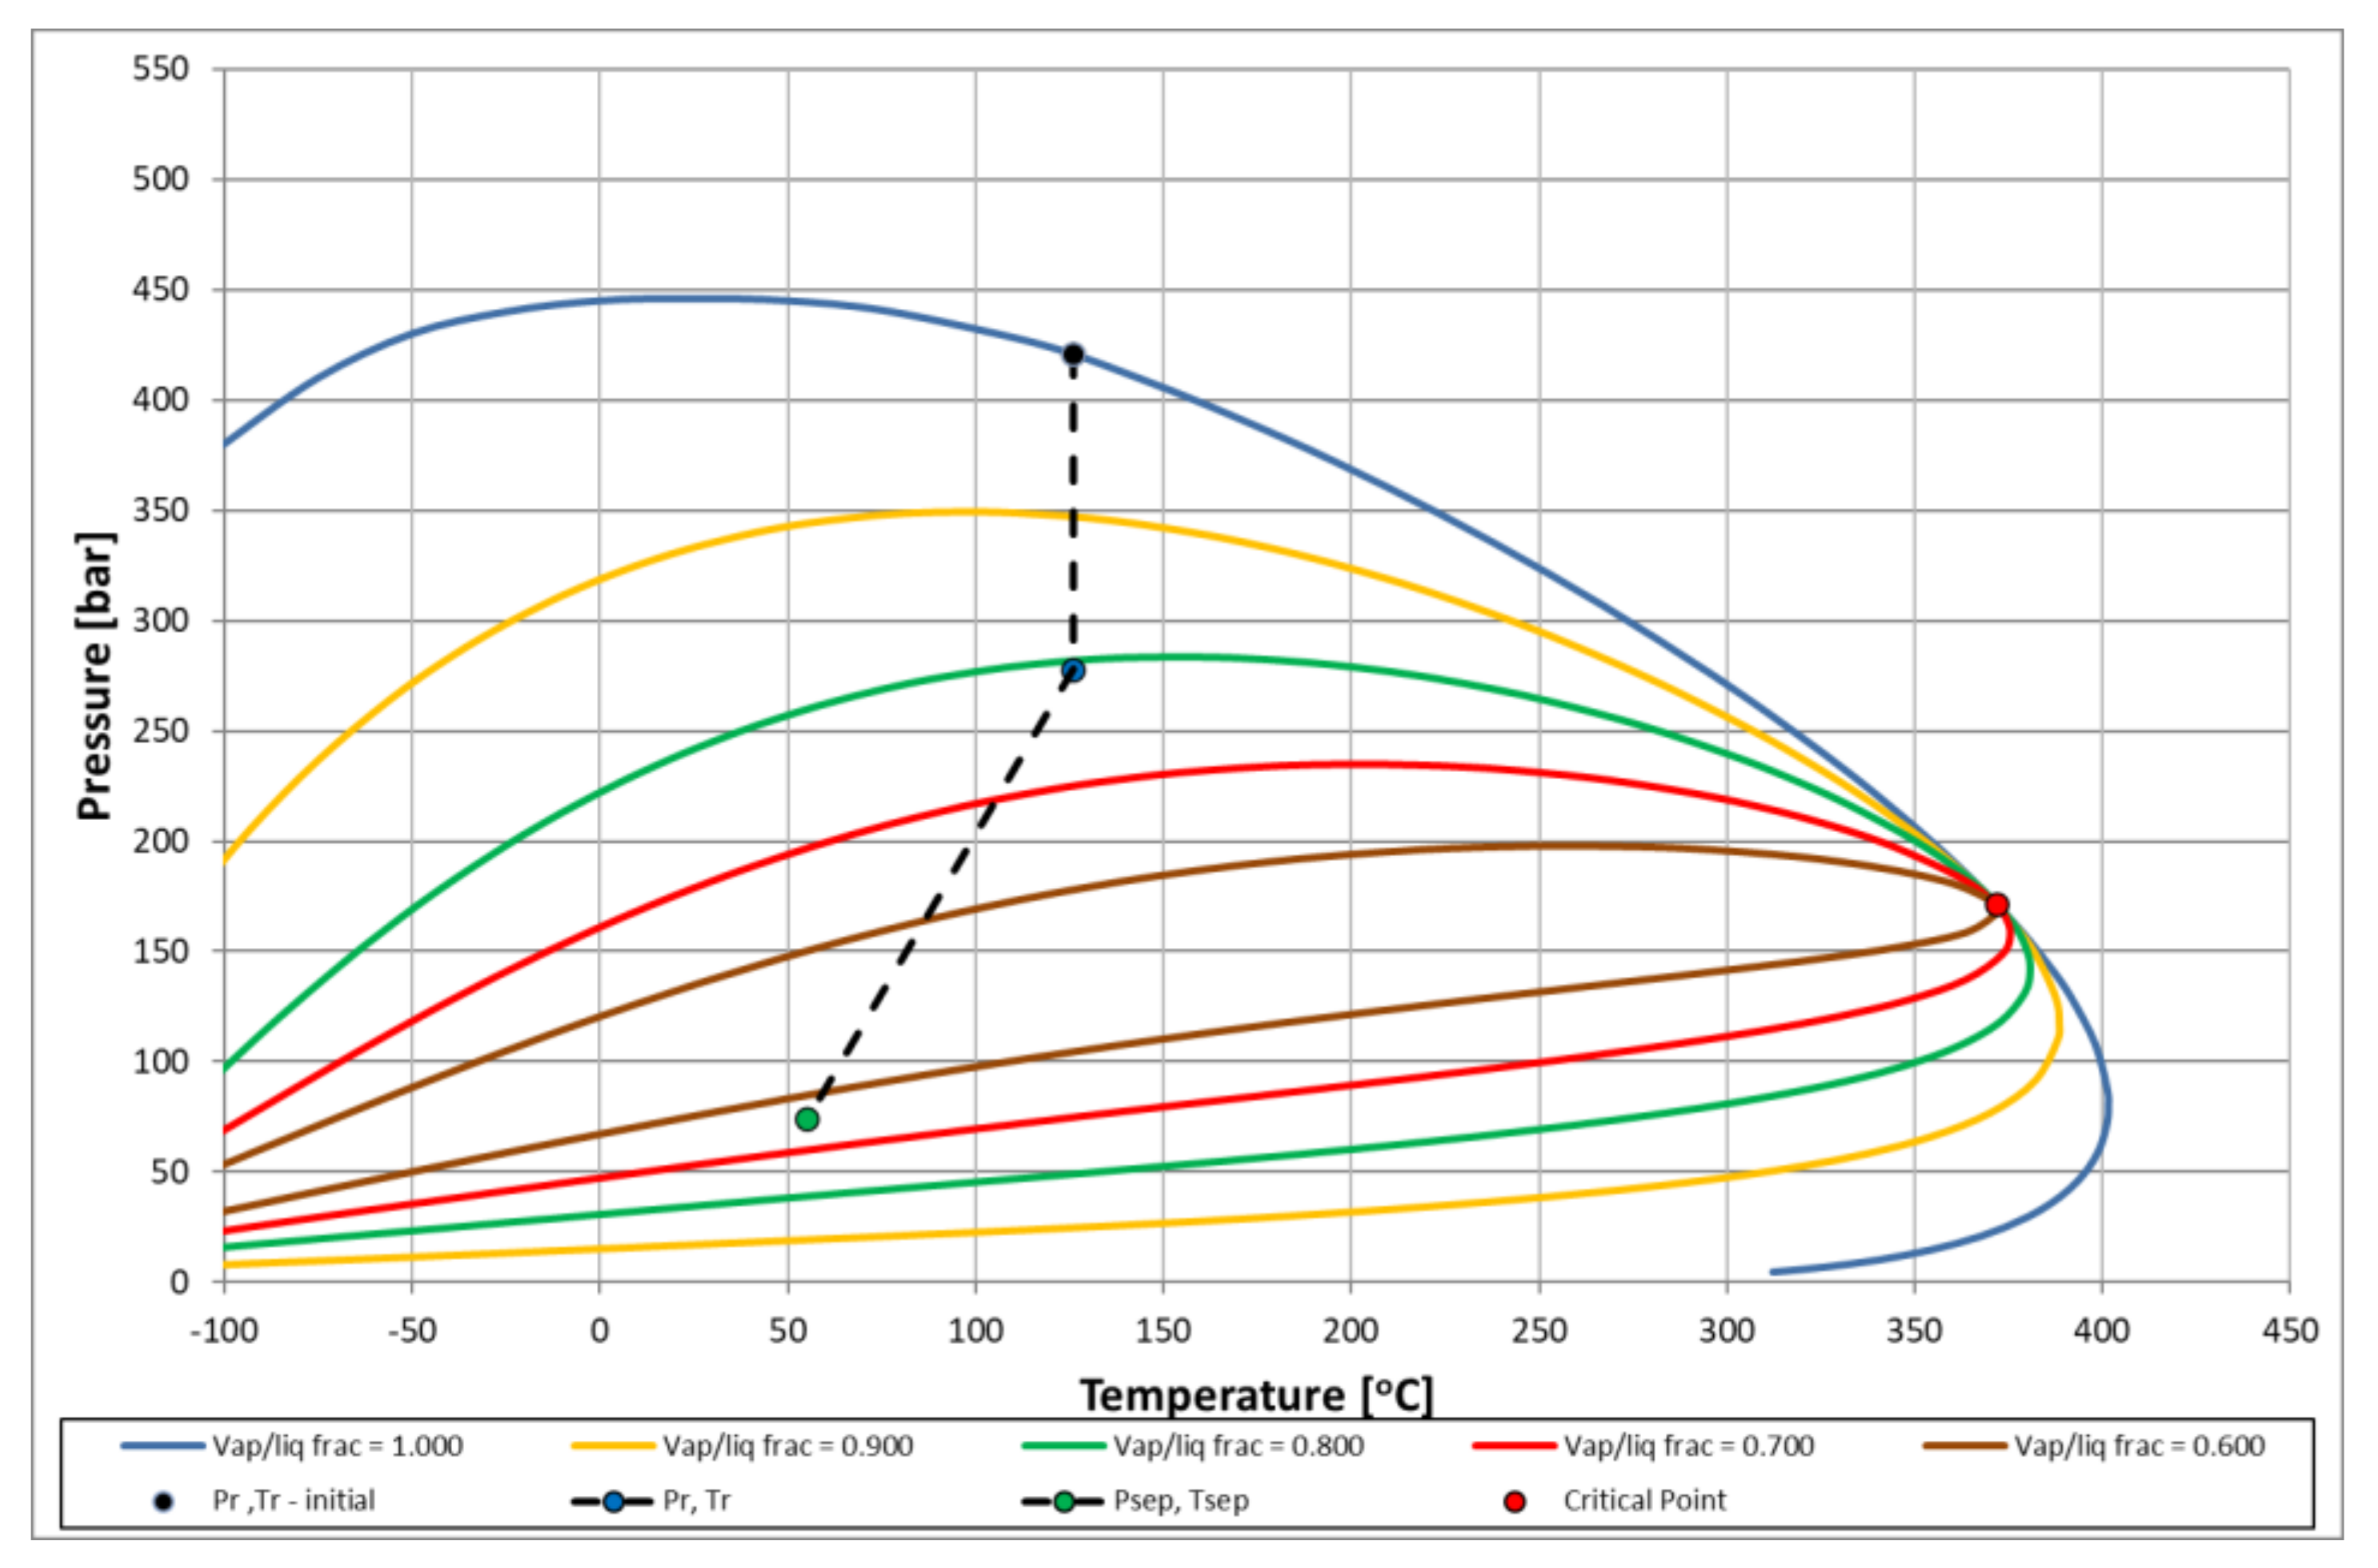
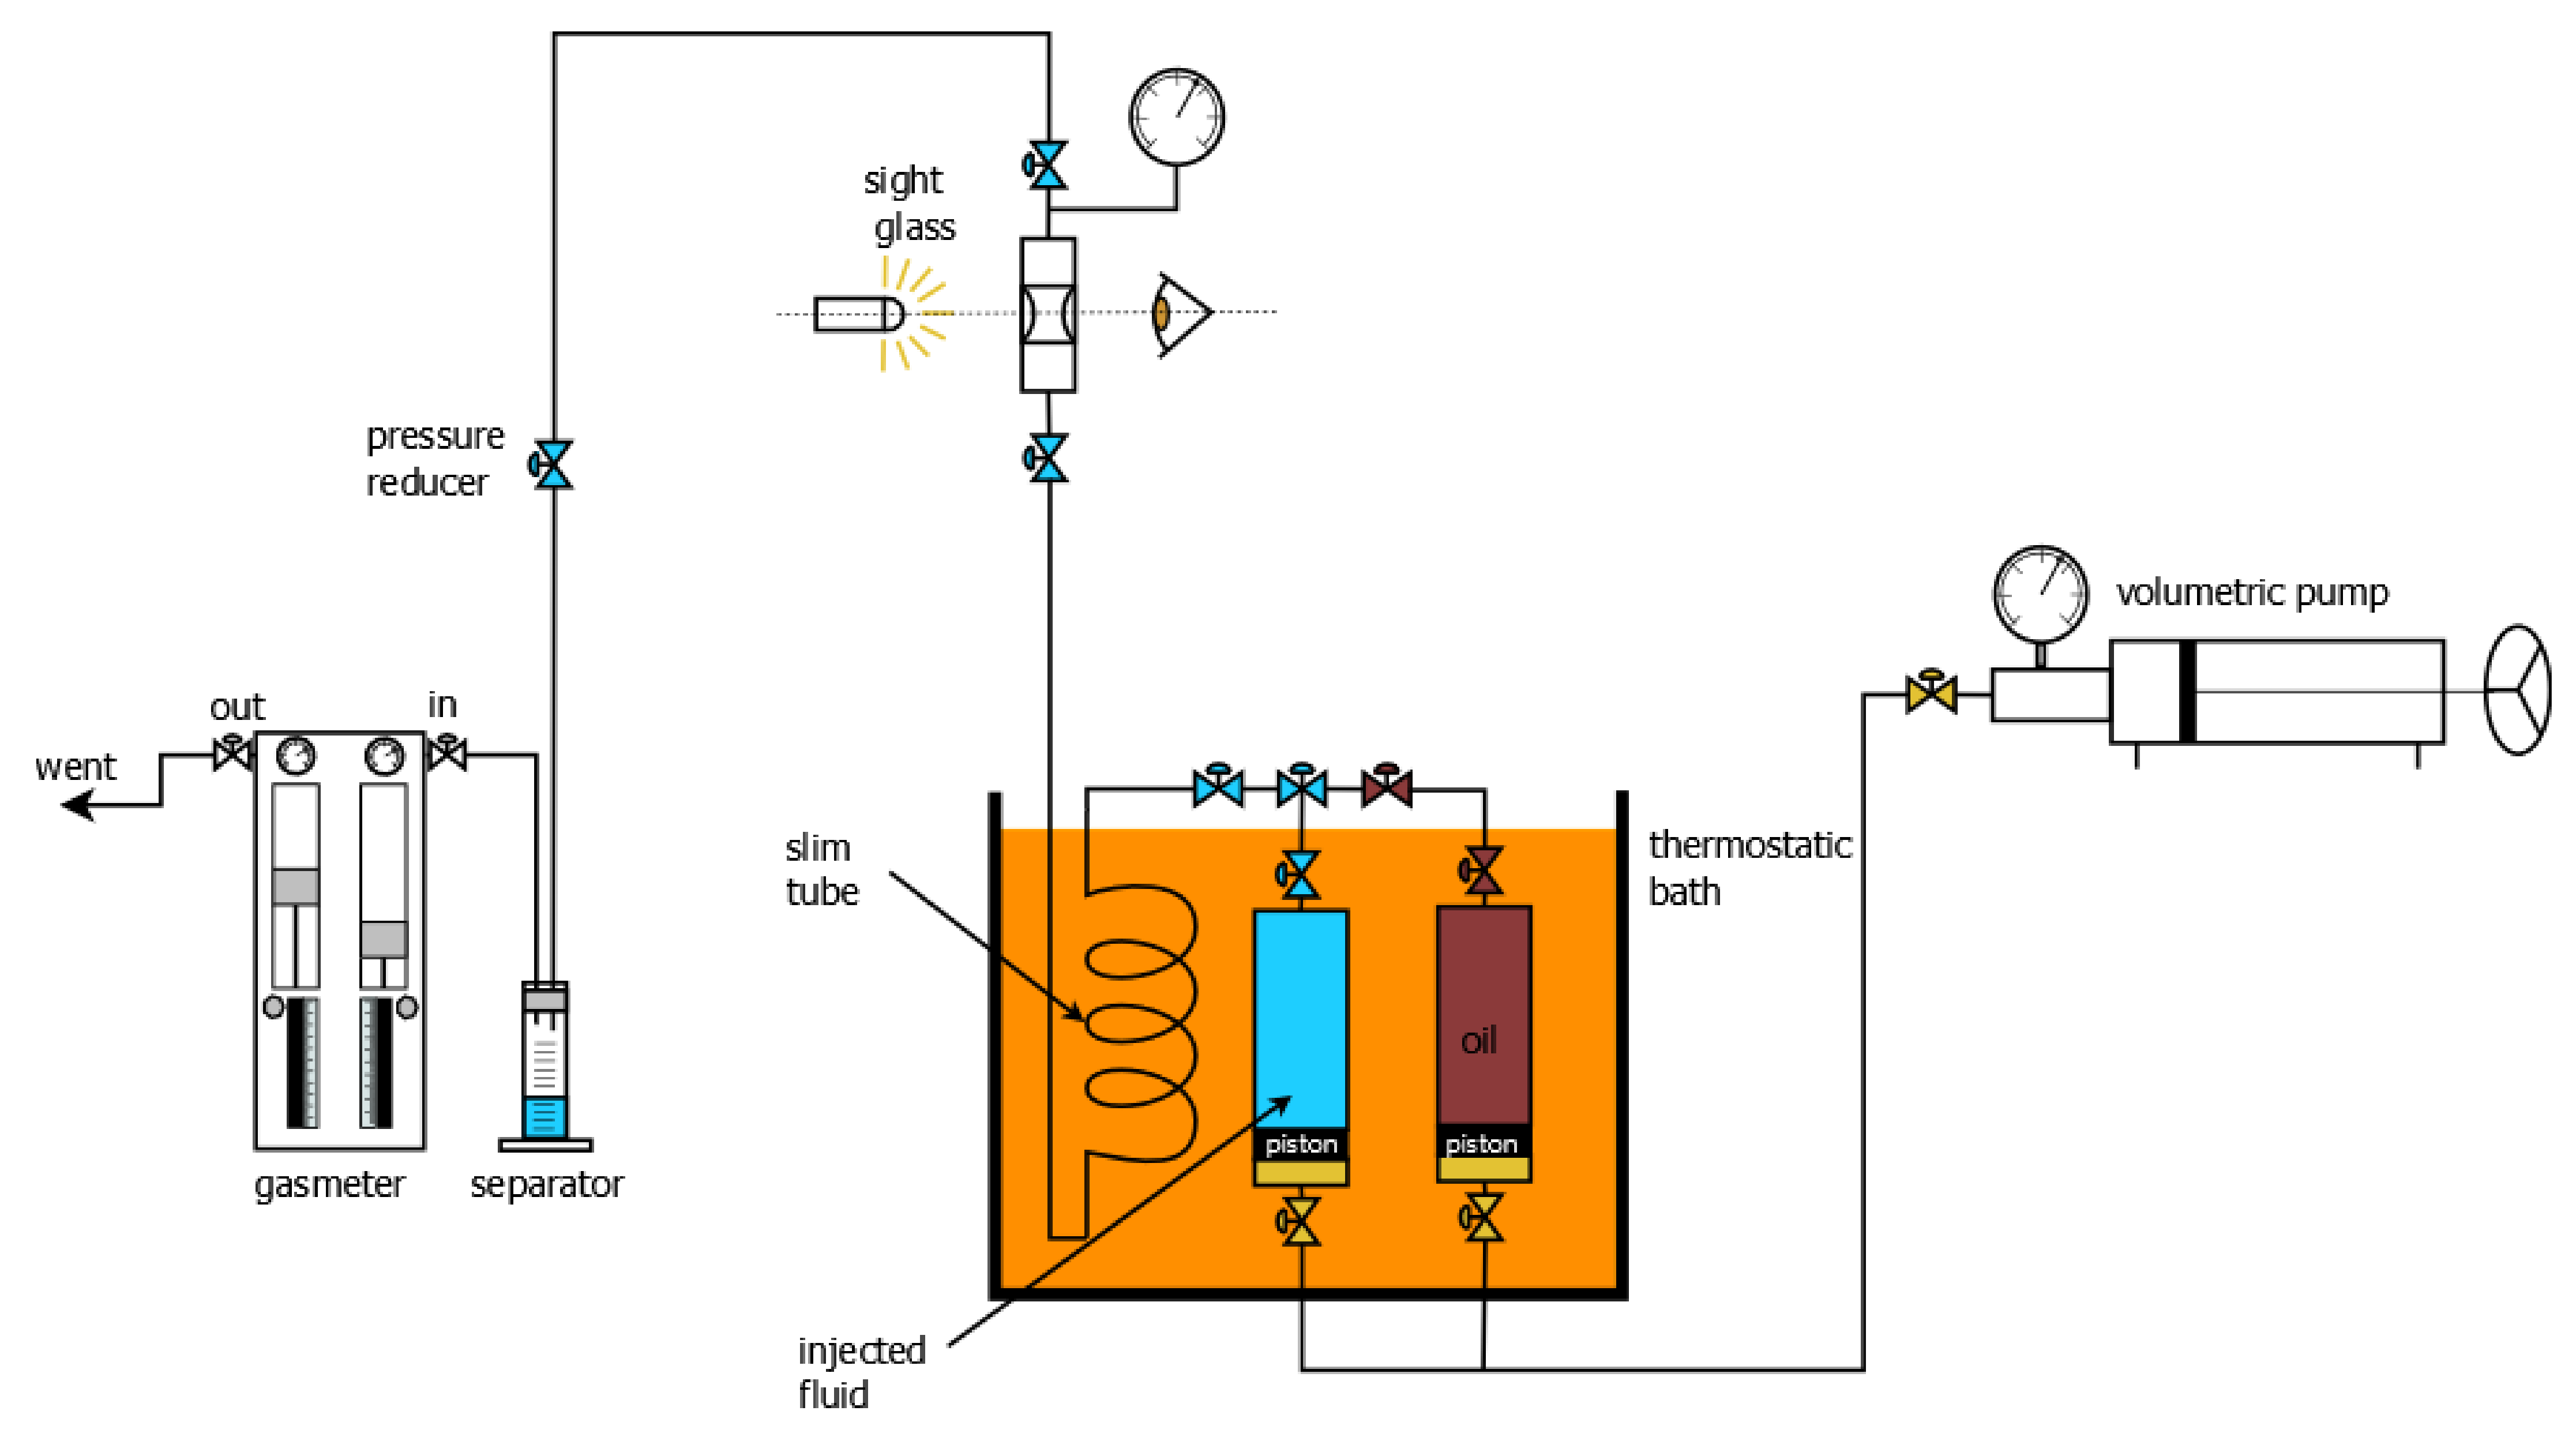
2.3. Minimum Miscibility Pressure
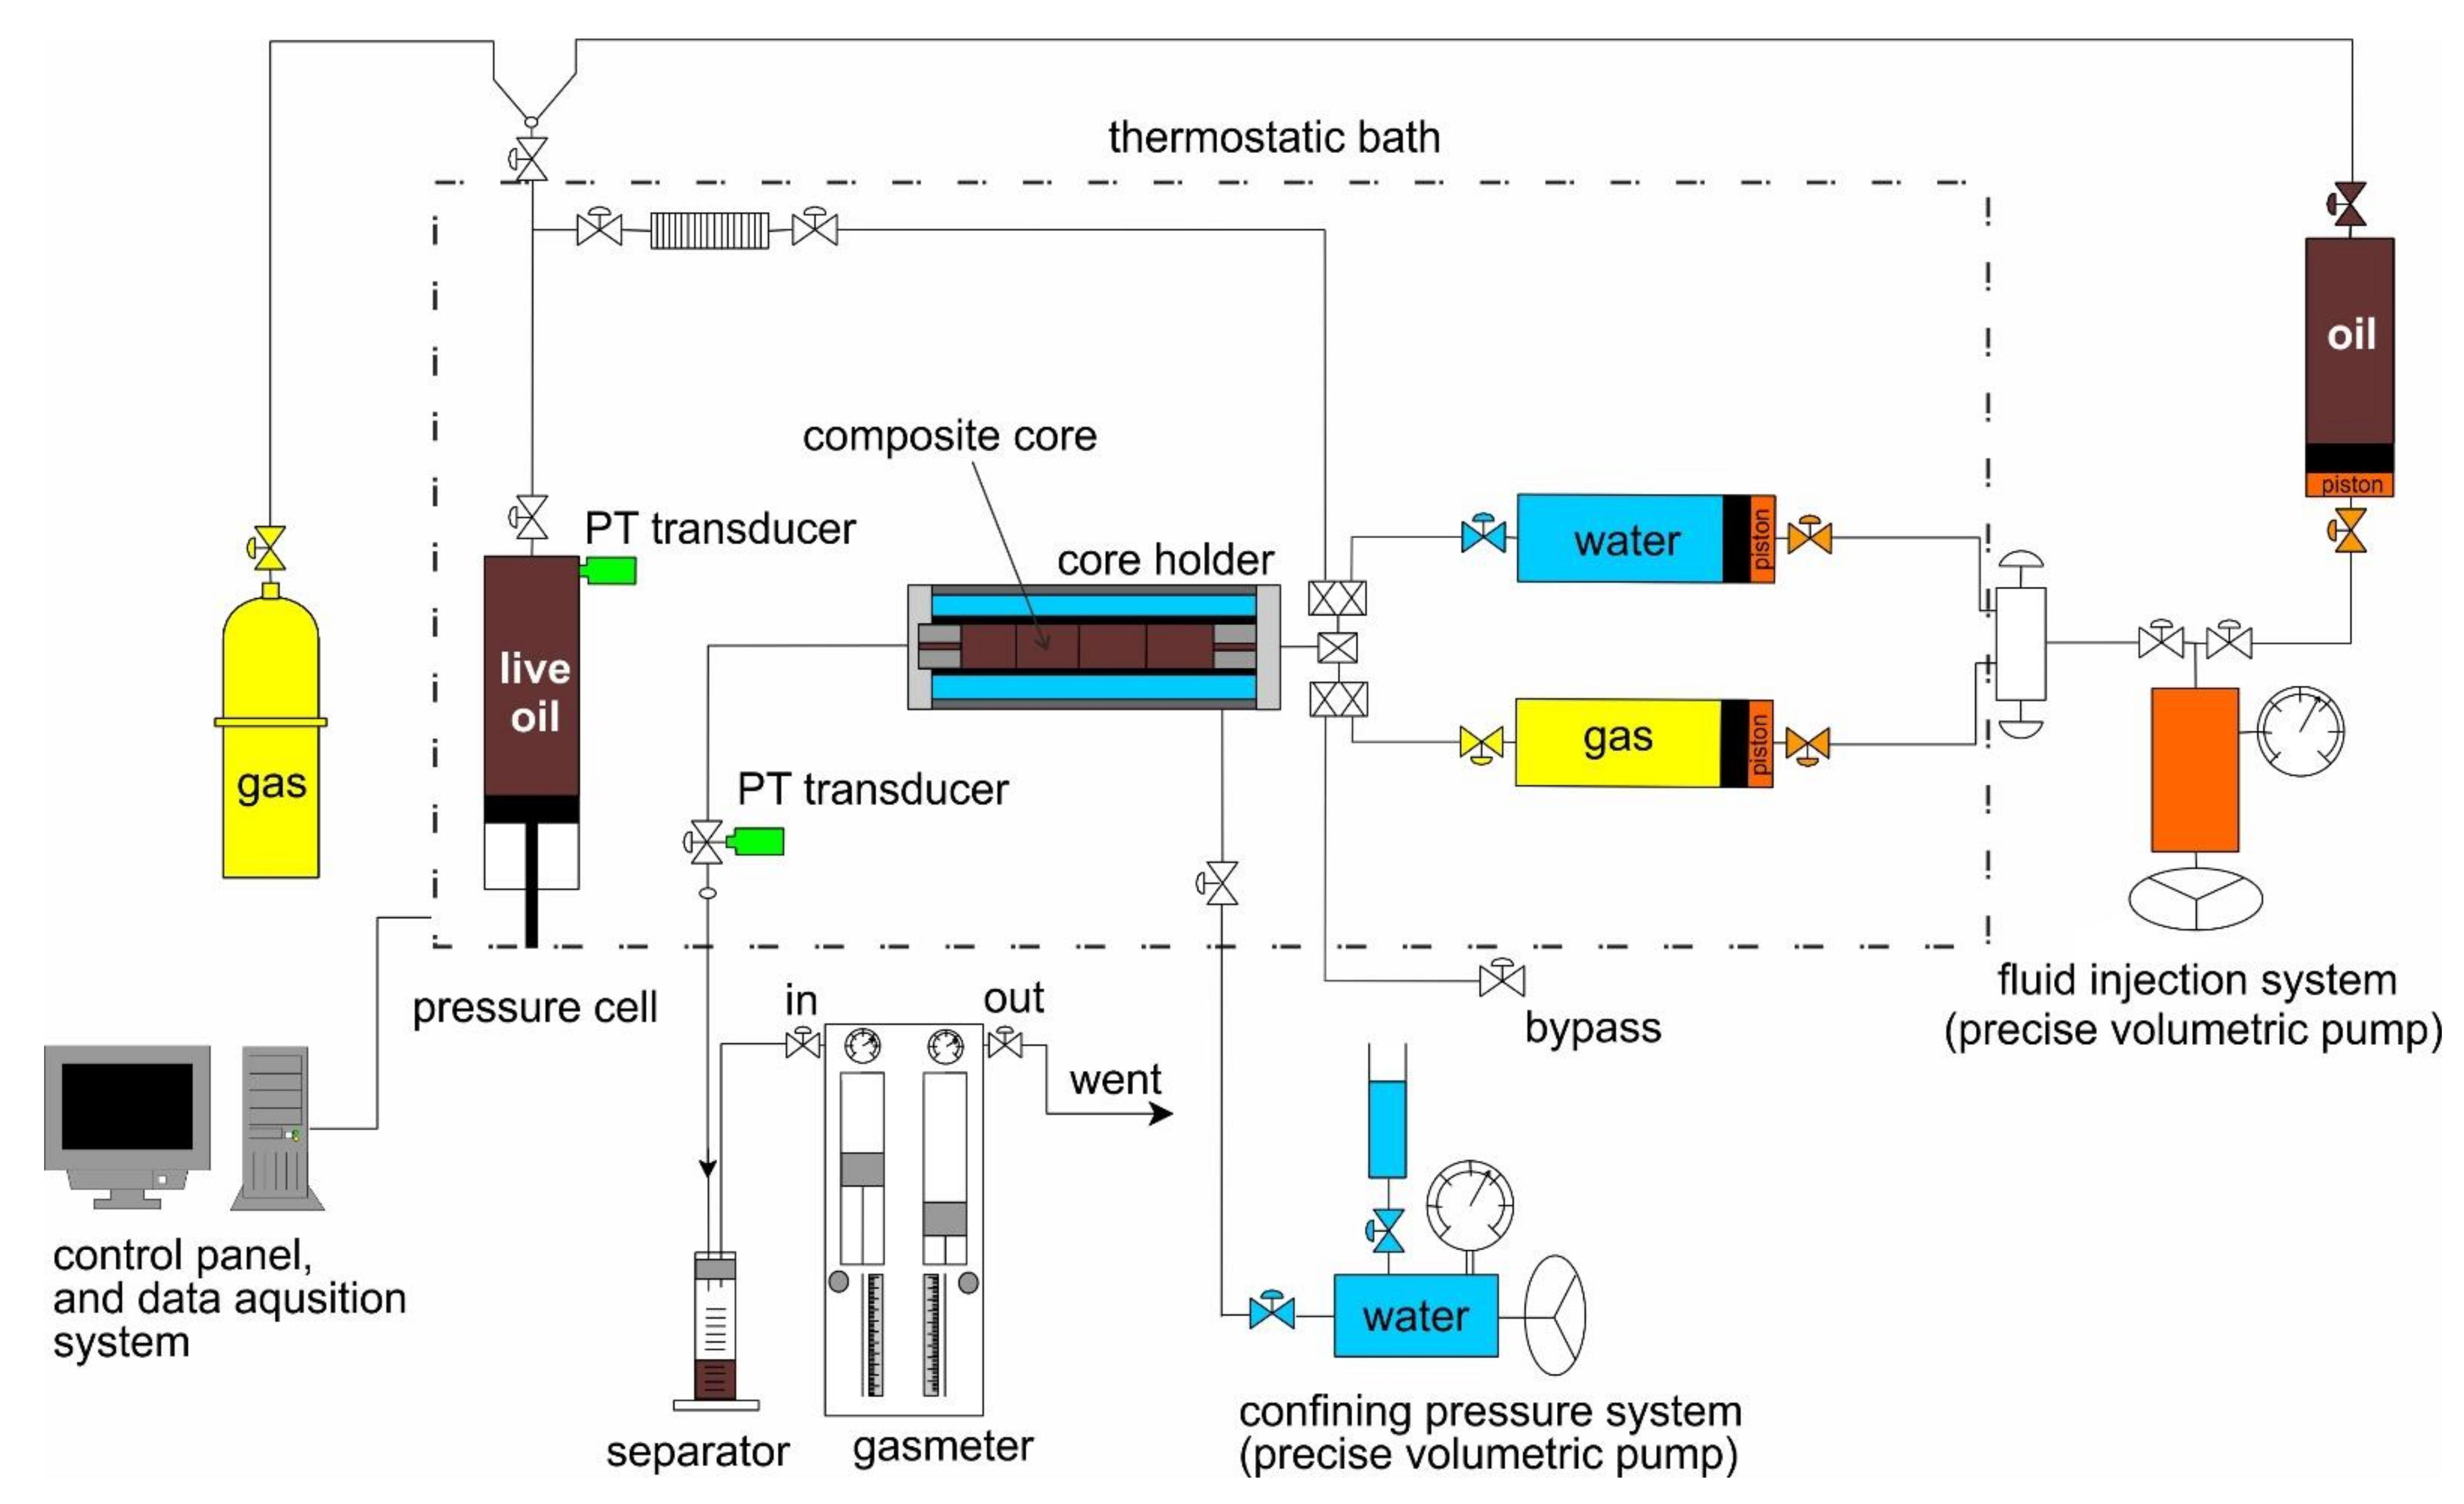
2.4. Coreflooding Process
2.5. Empirical Correlation for Recovery Factor
3. Results
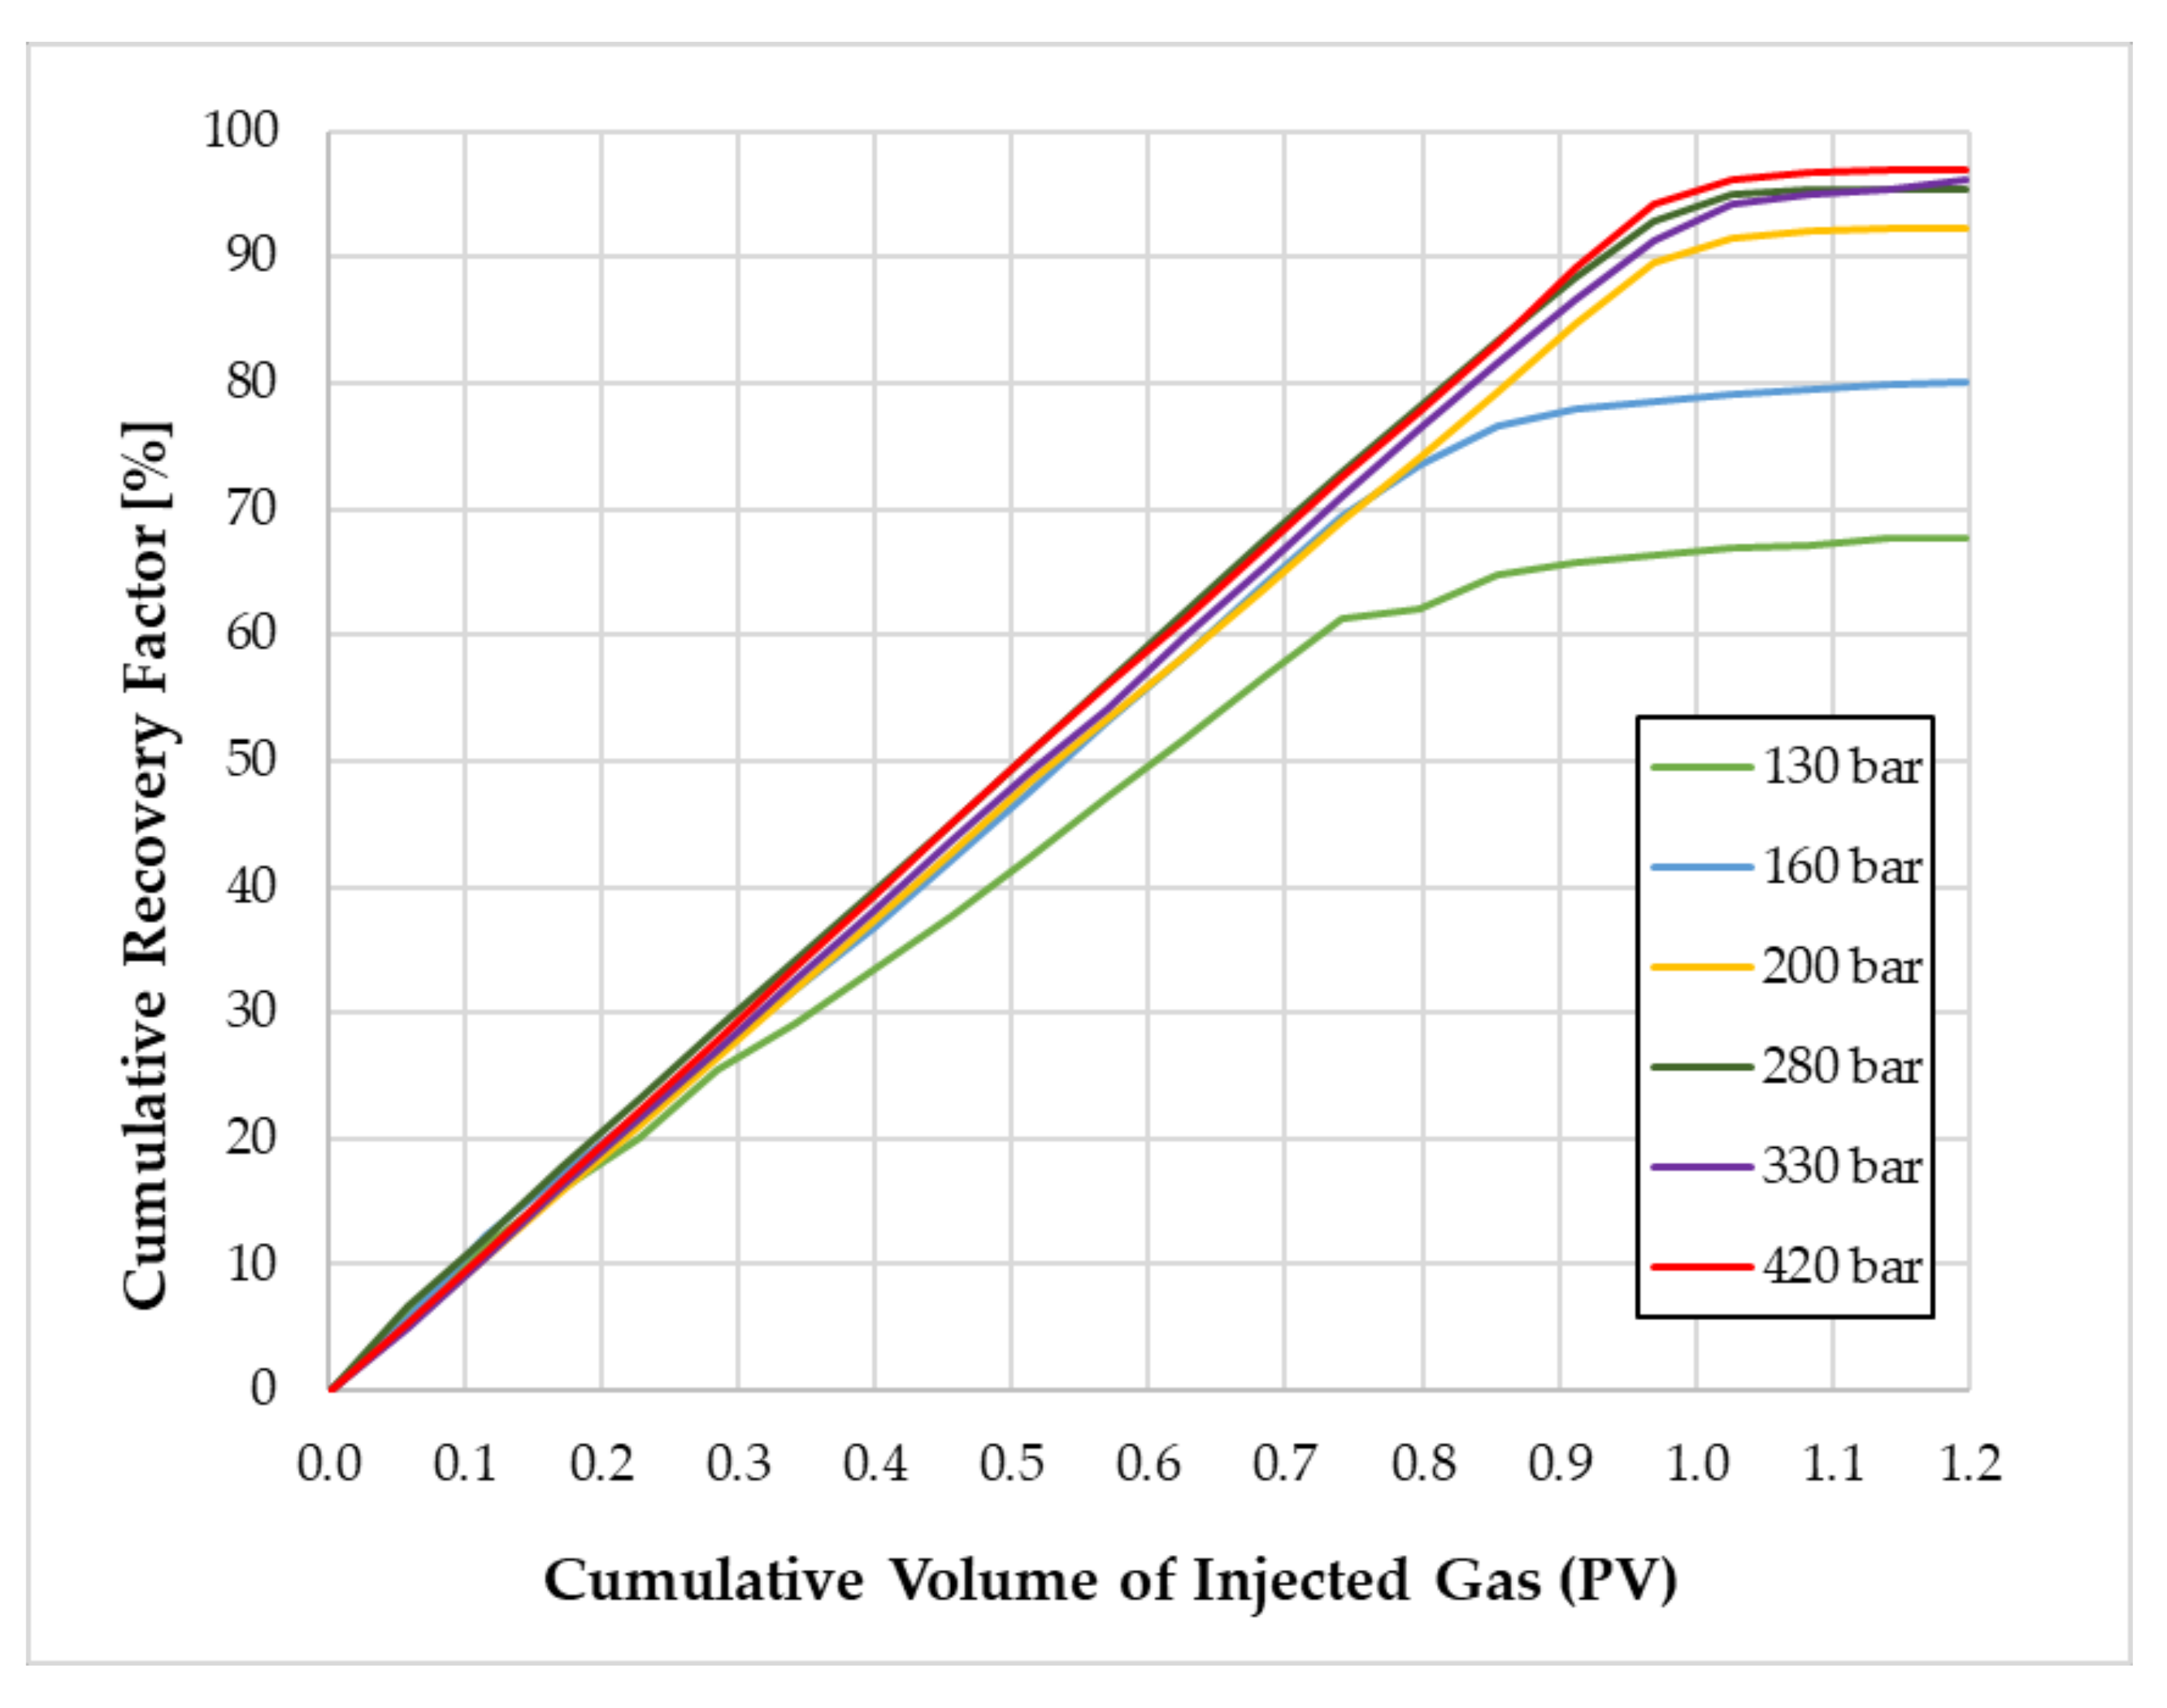
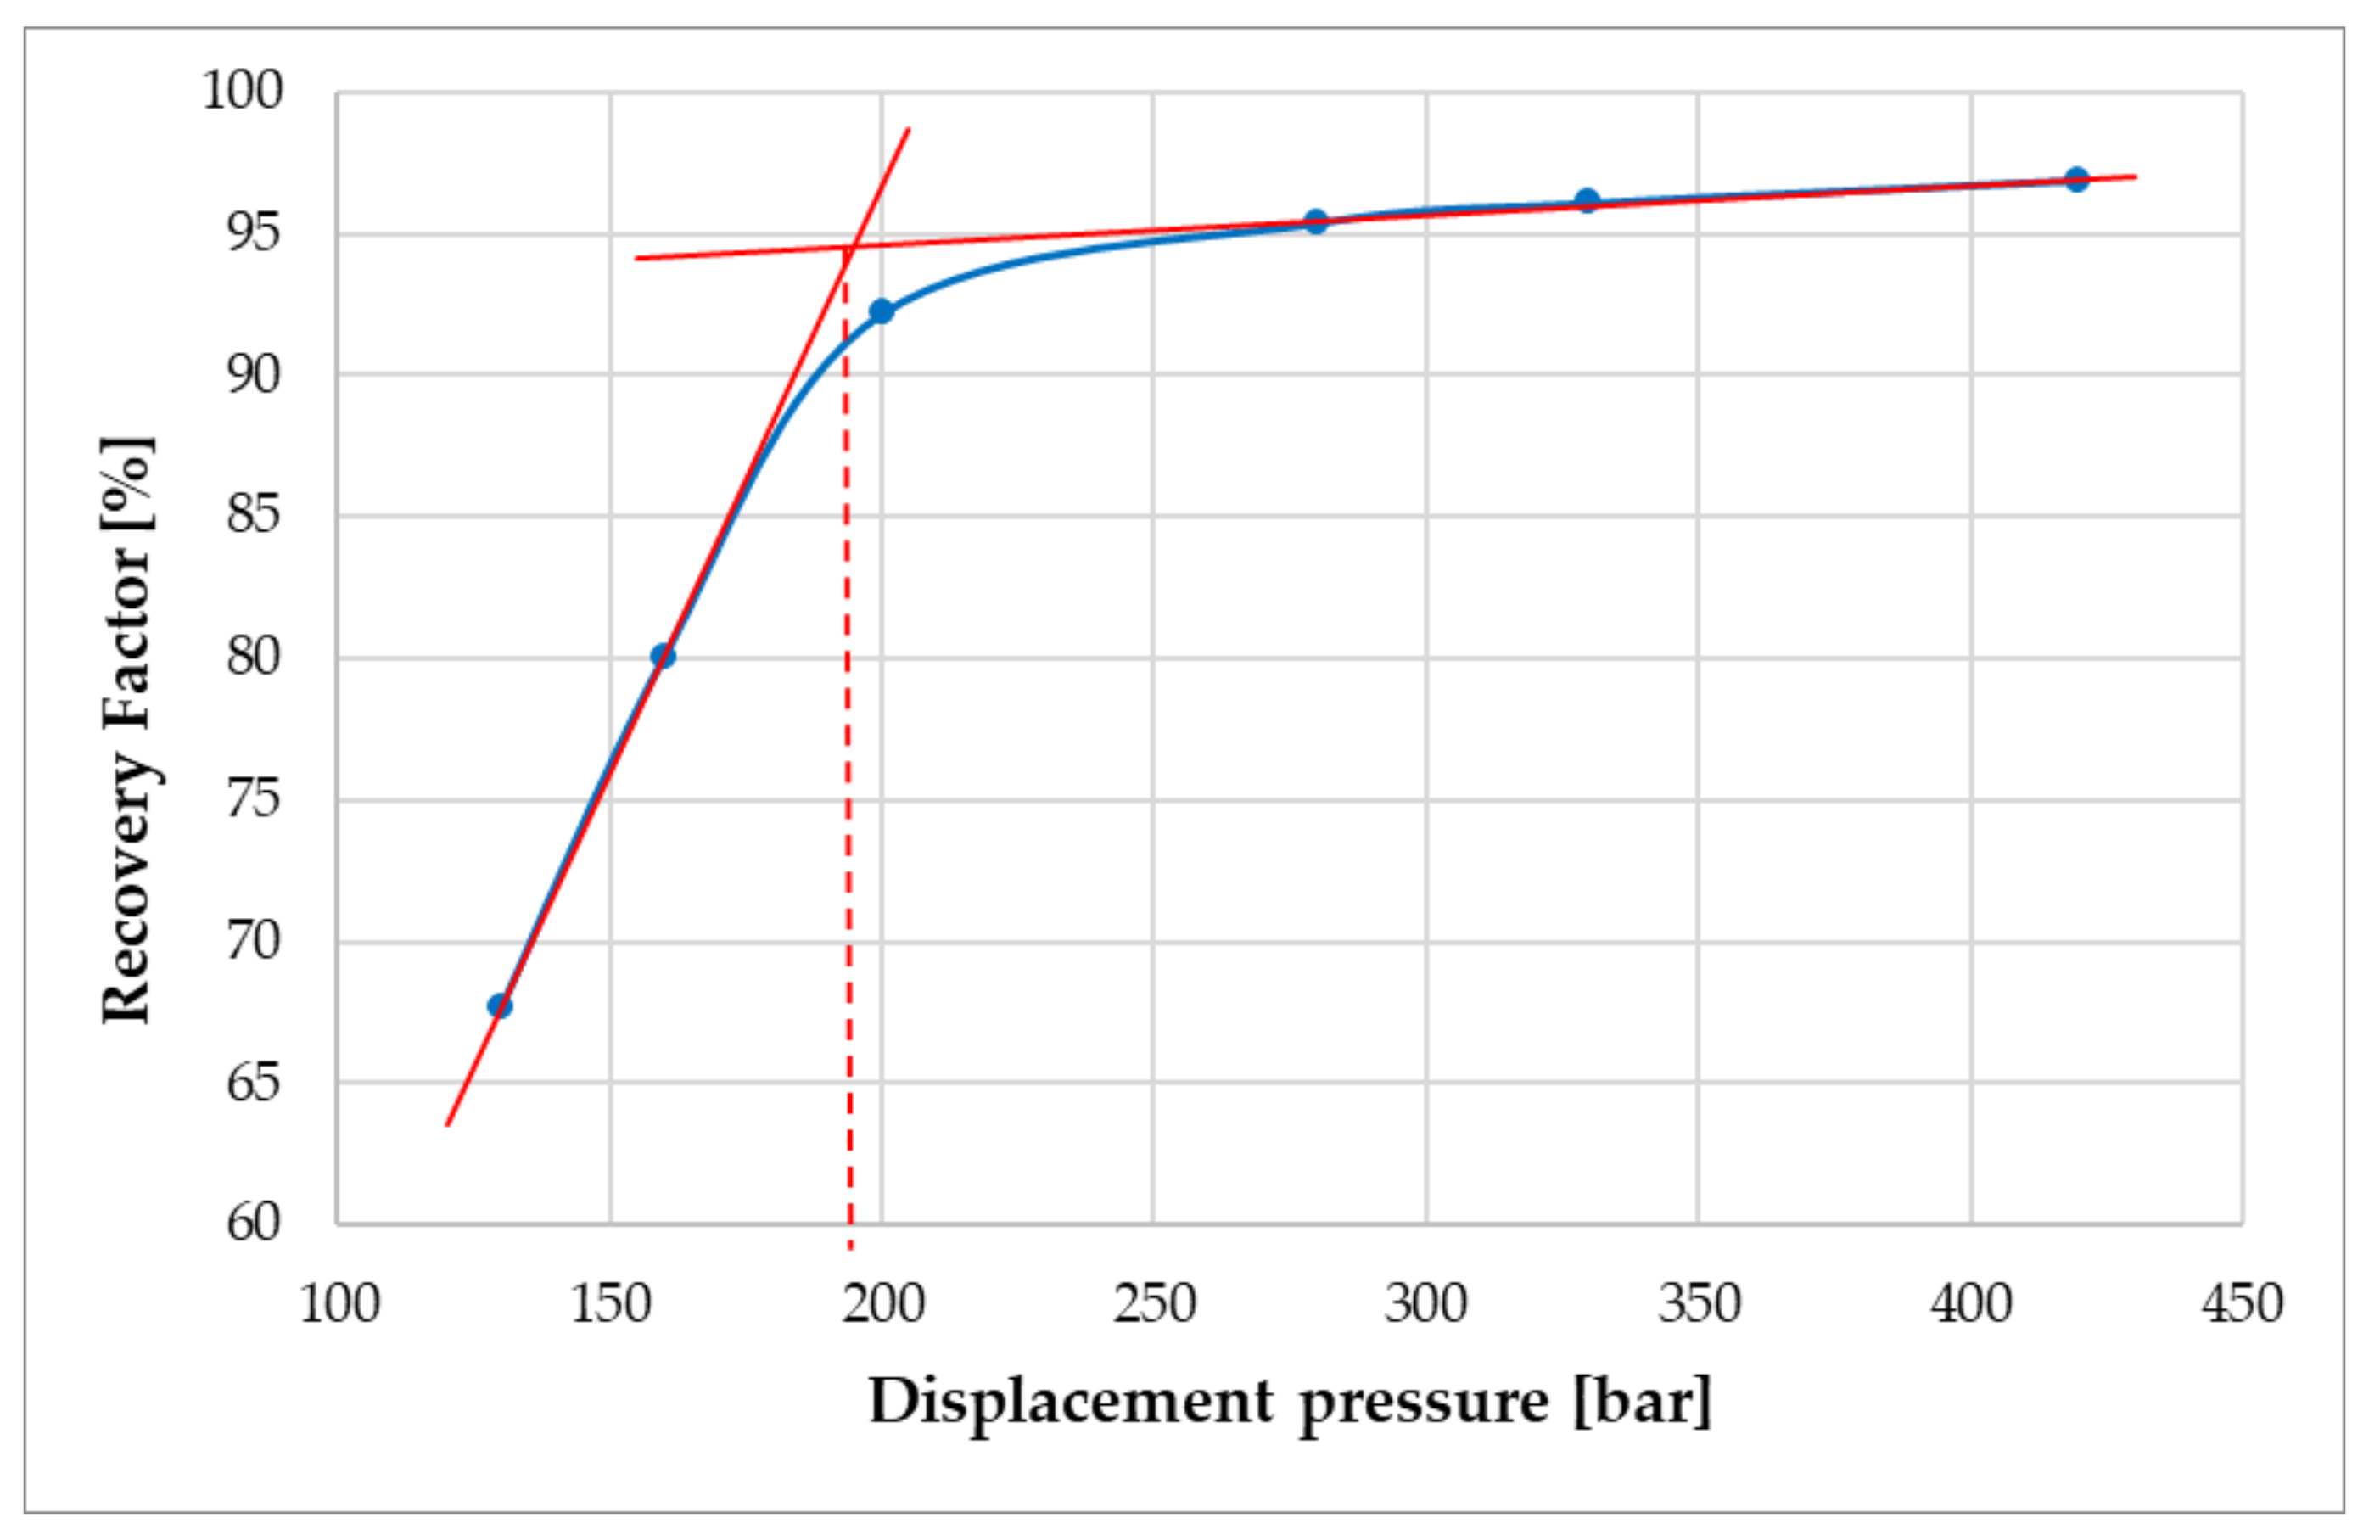
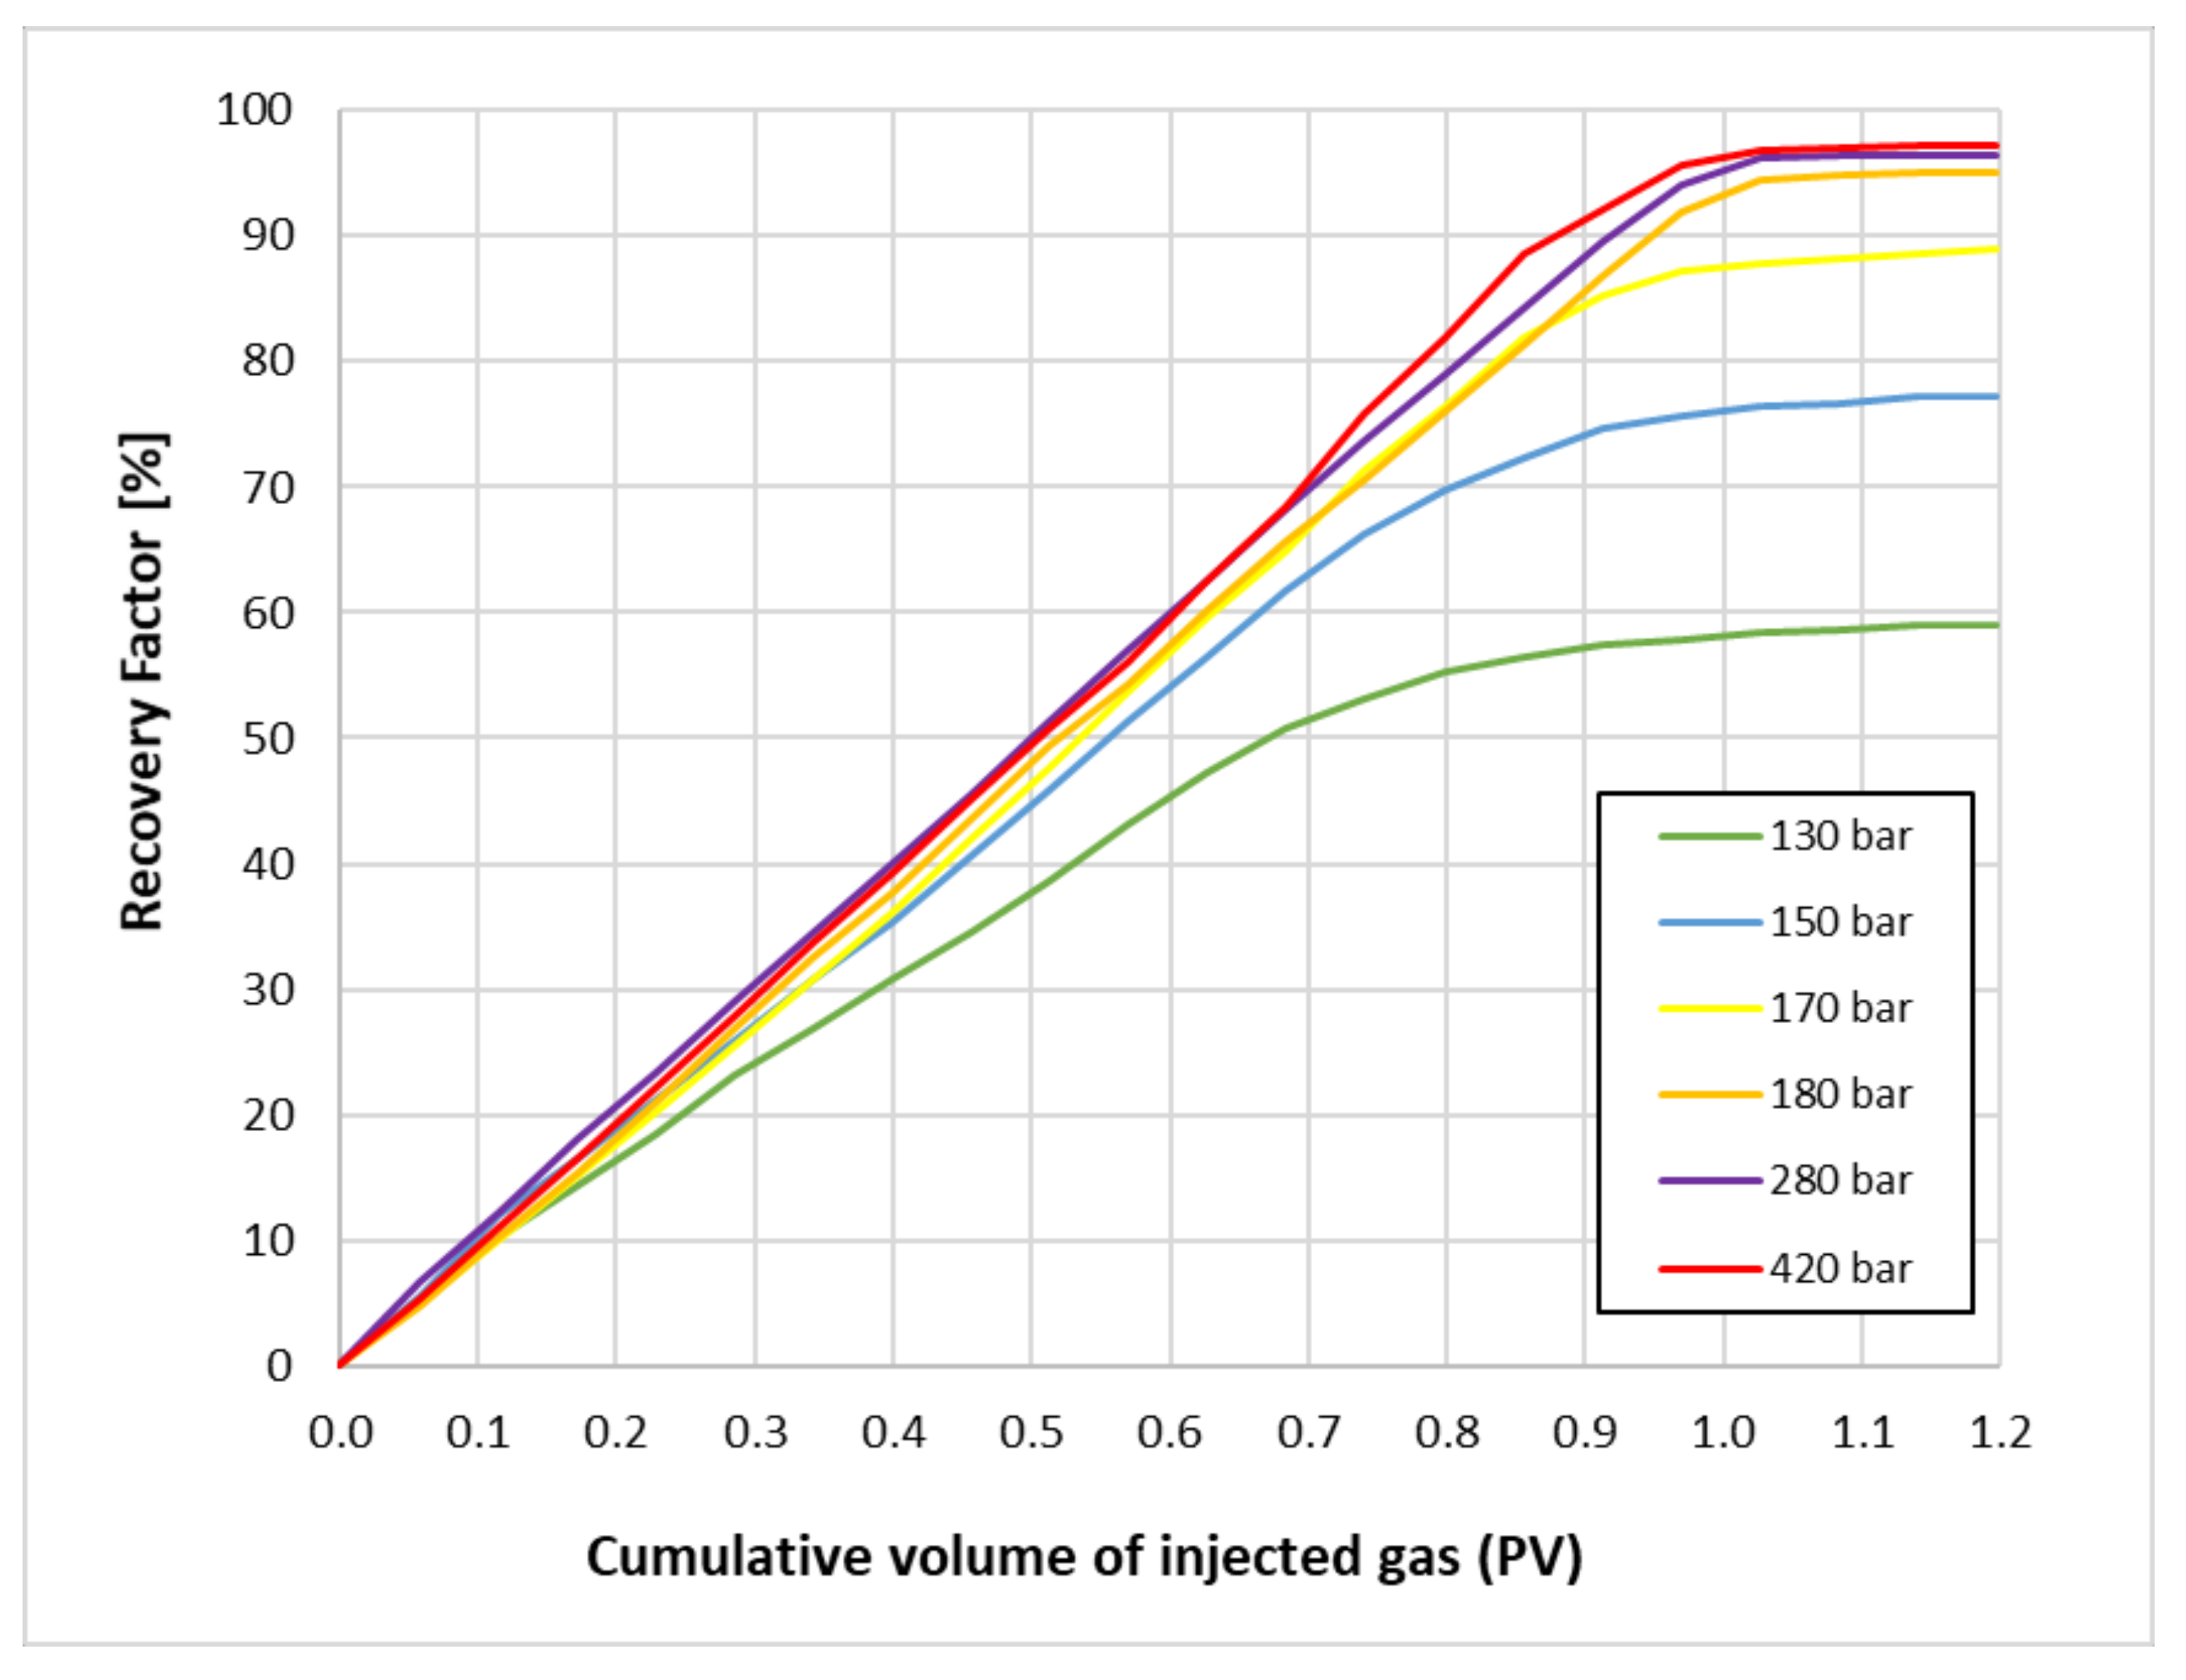
3.1. MMP Determination
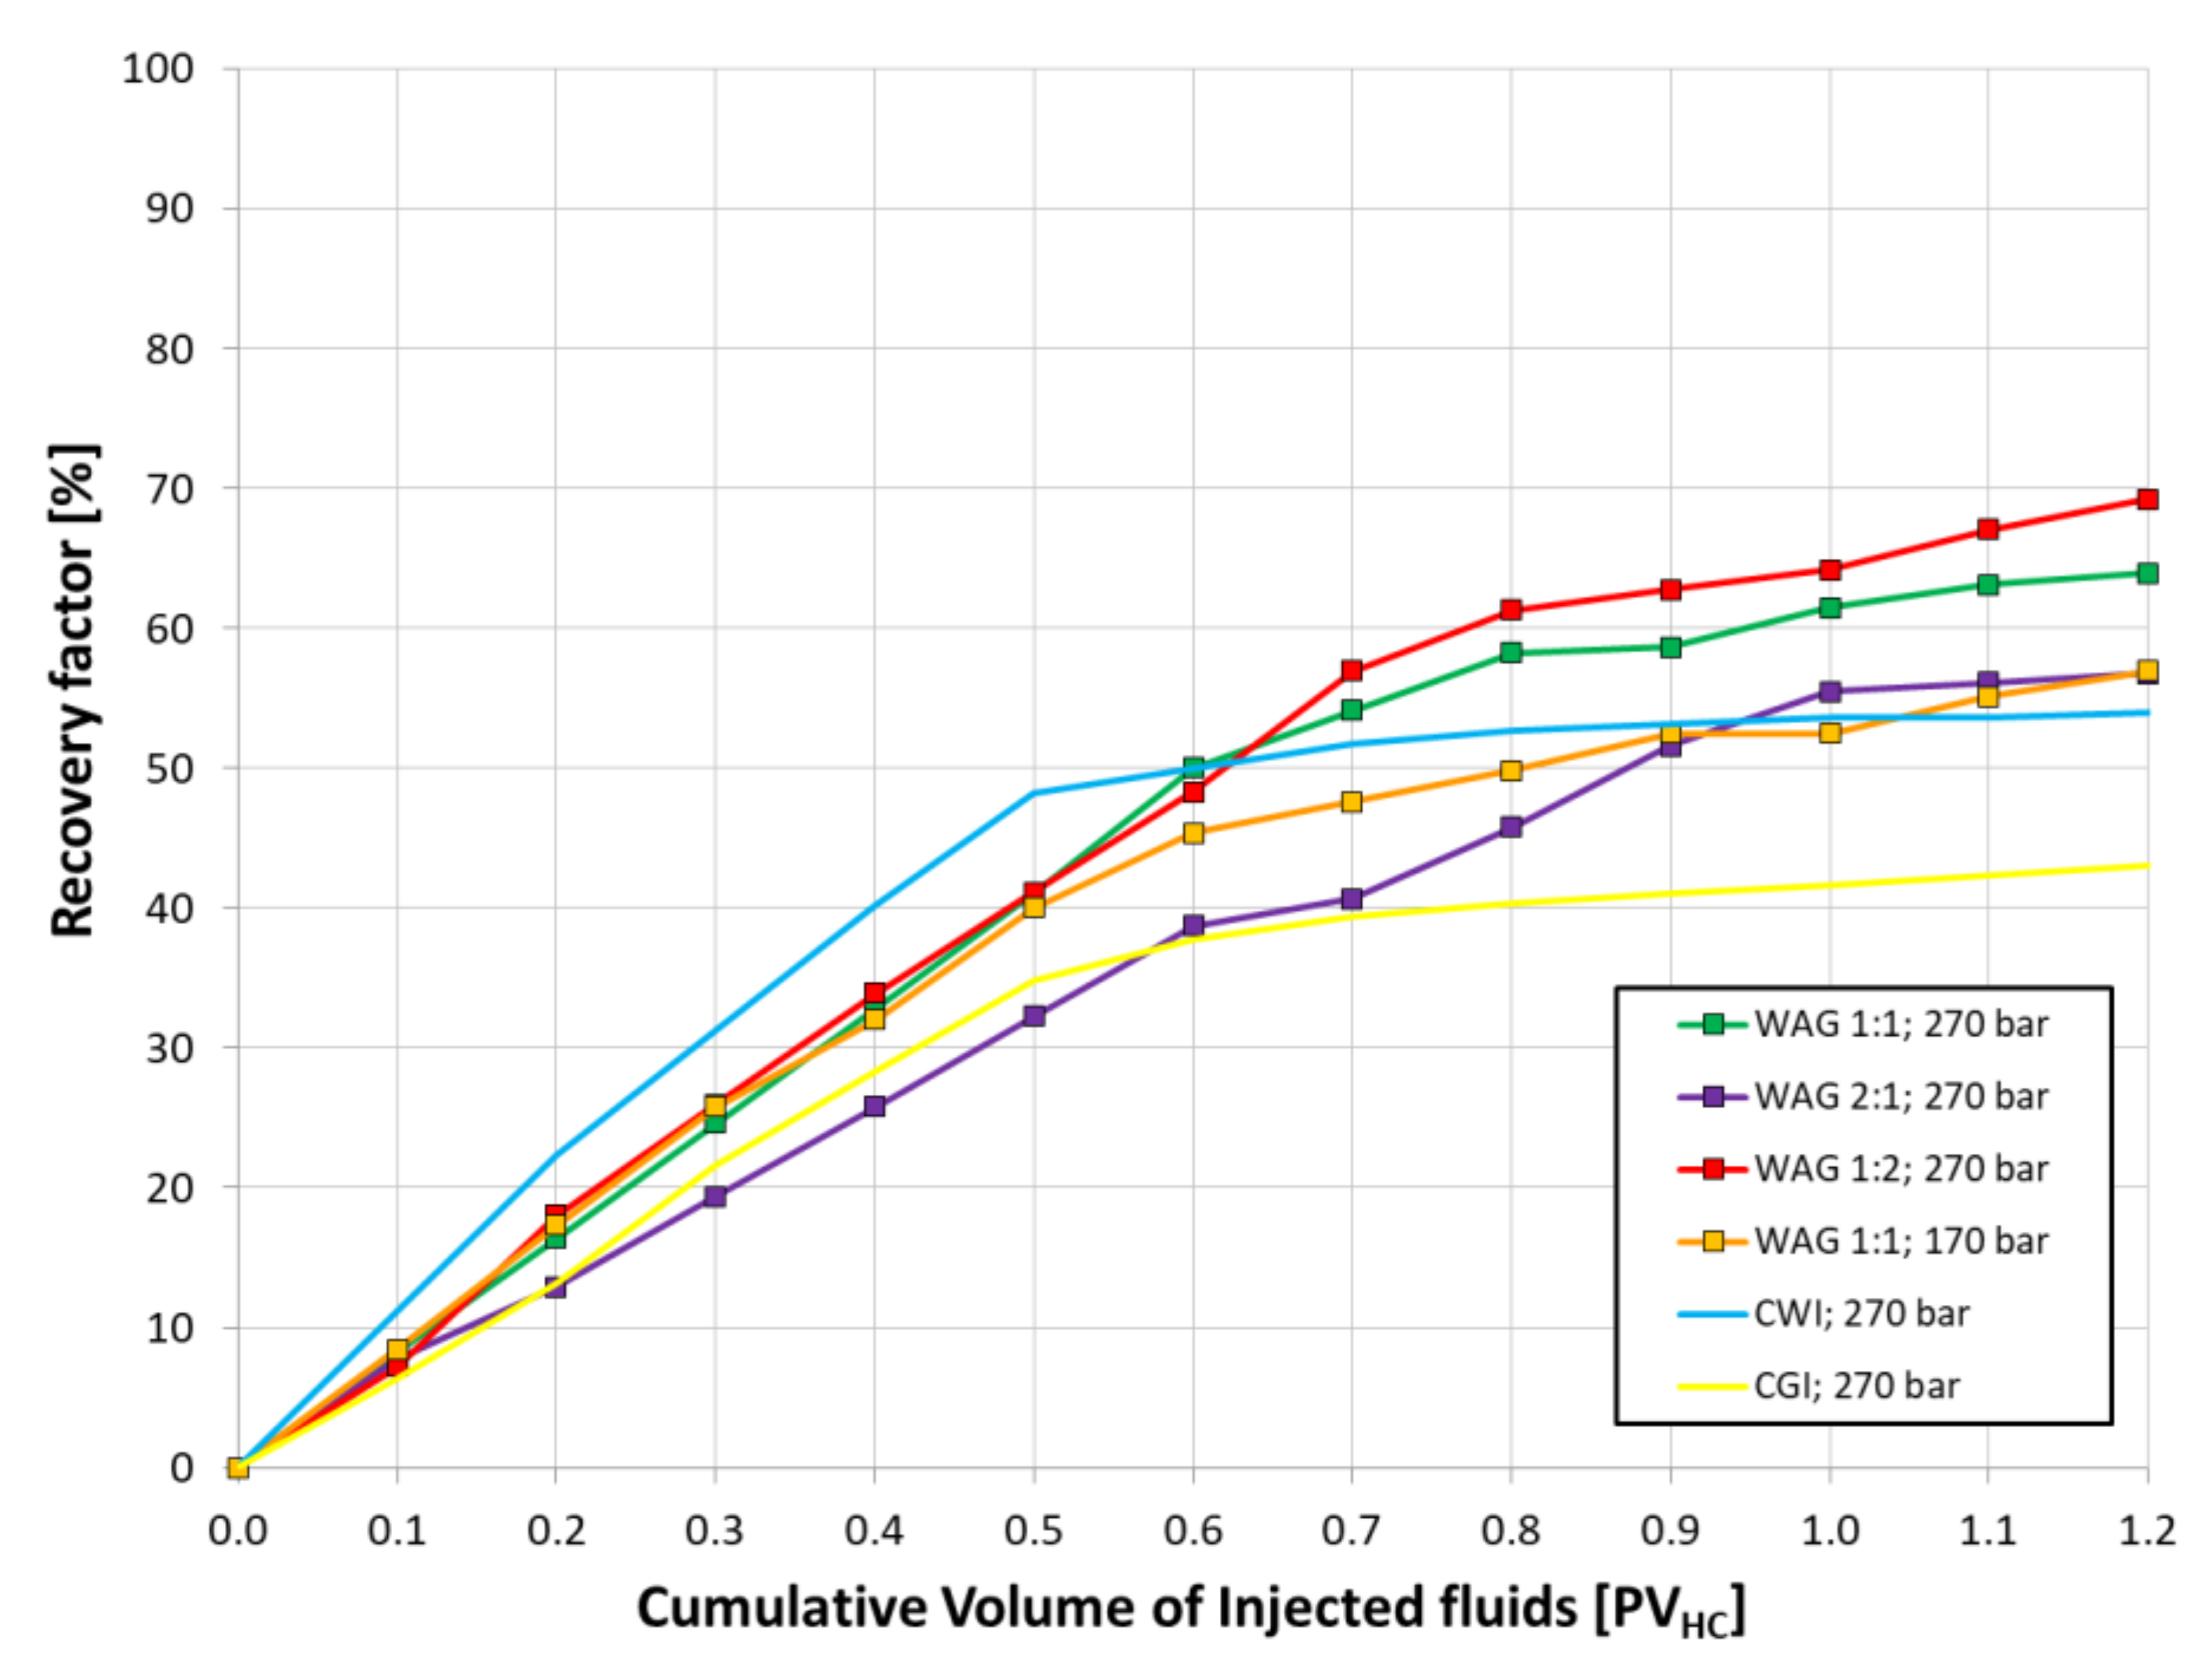
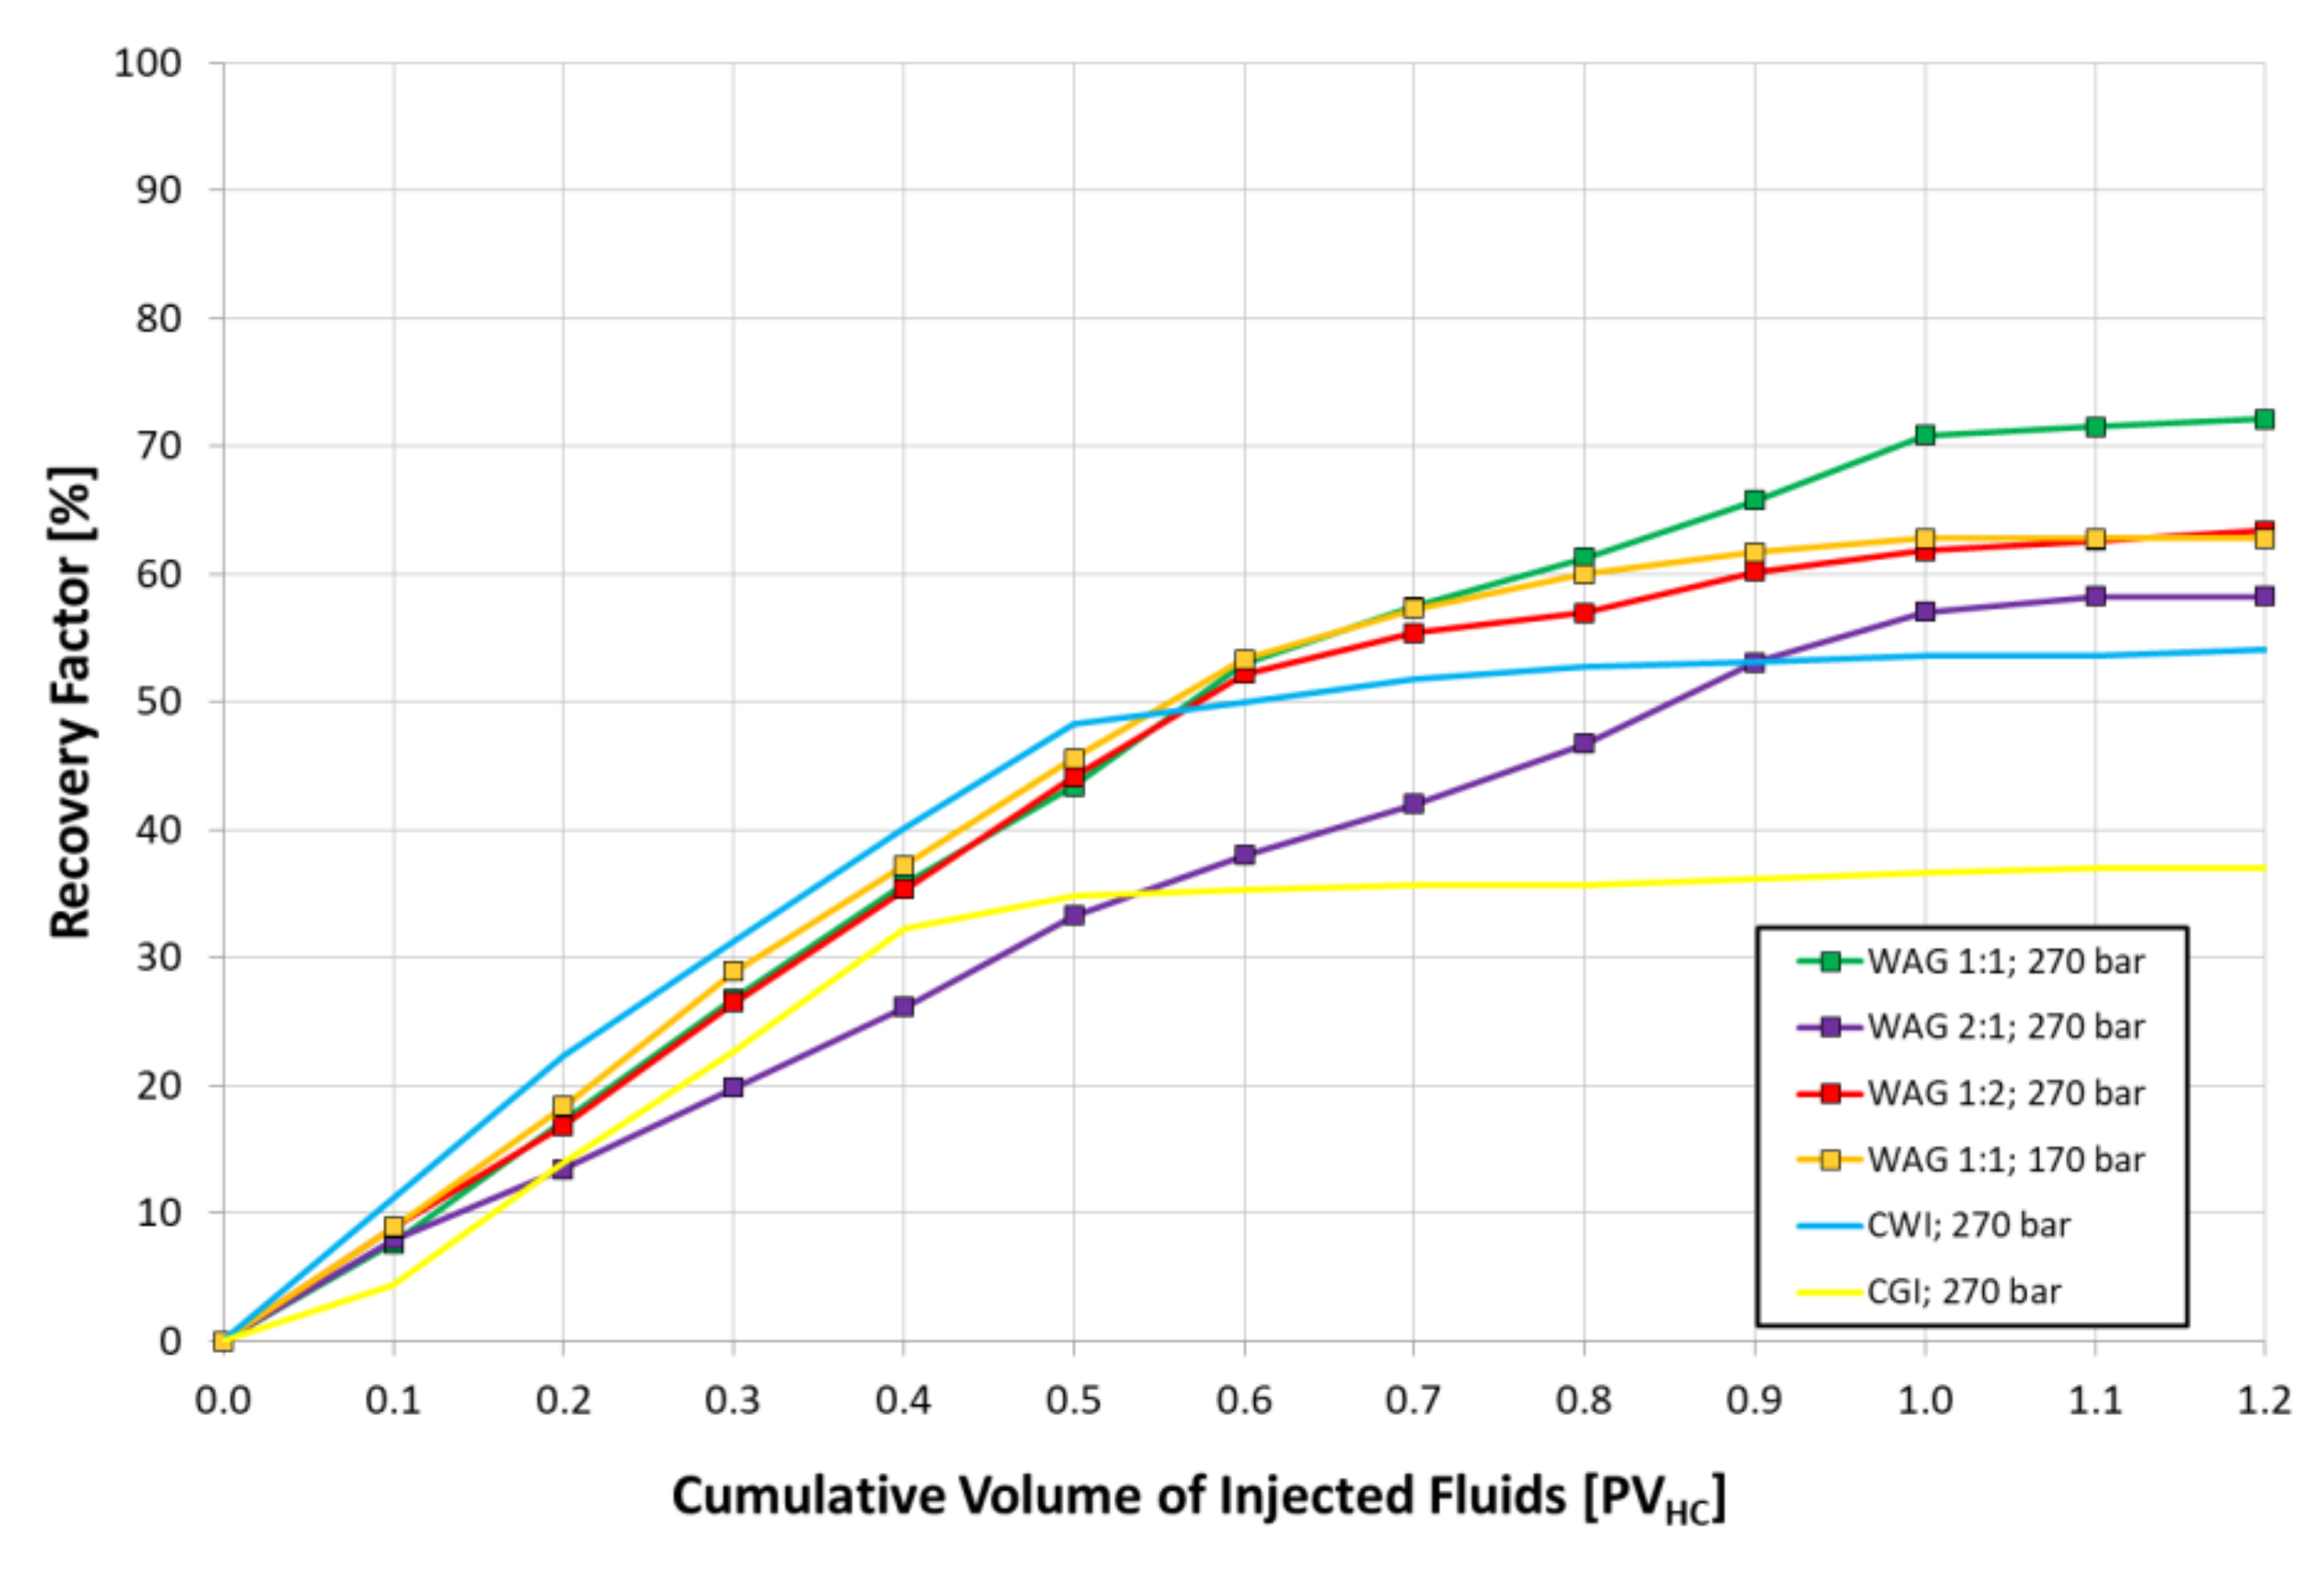
3.2. Coreflooding
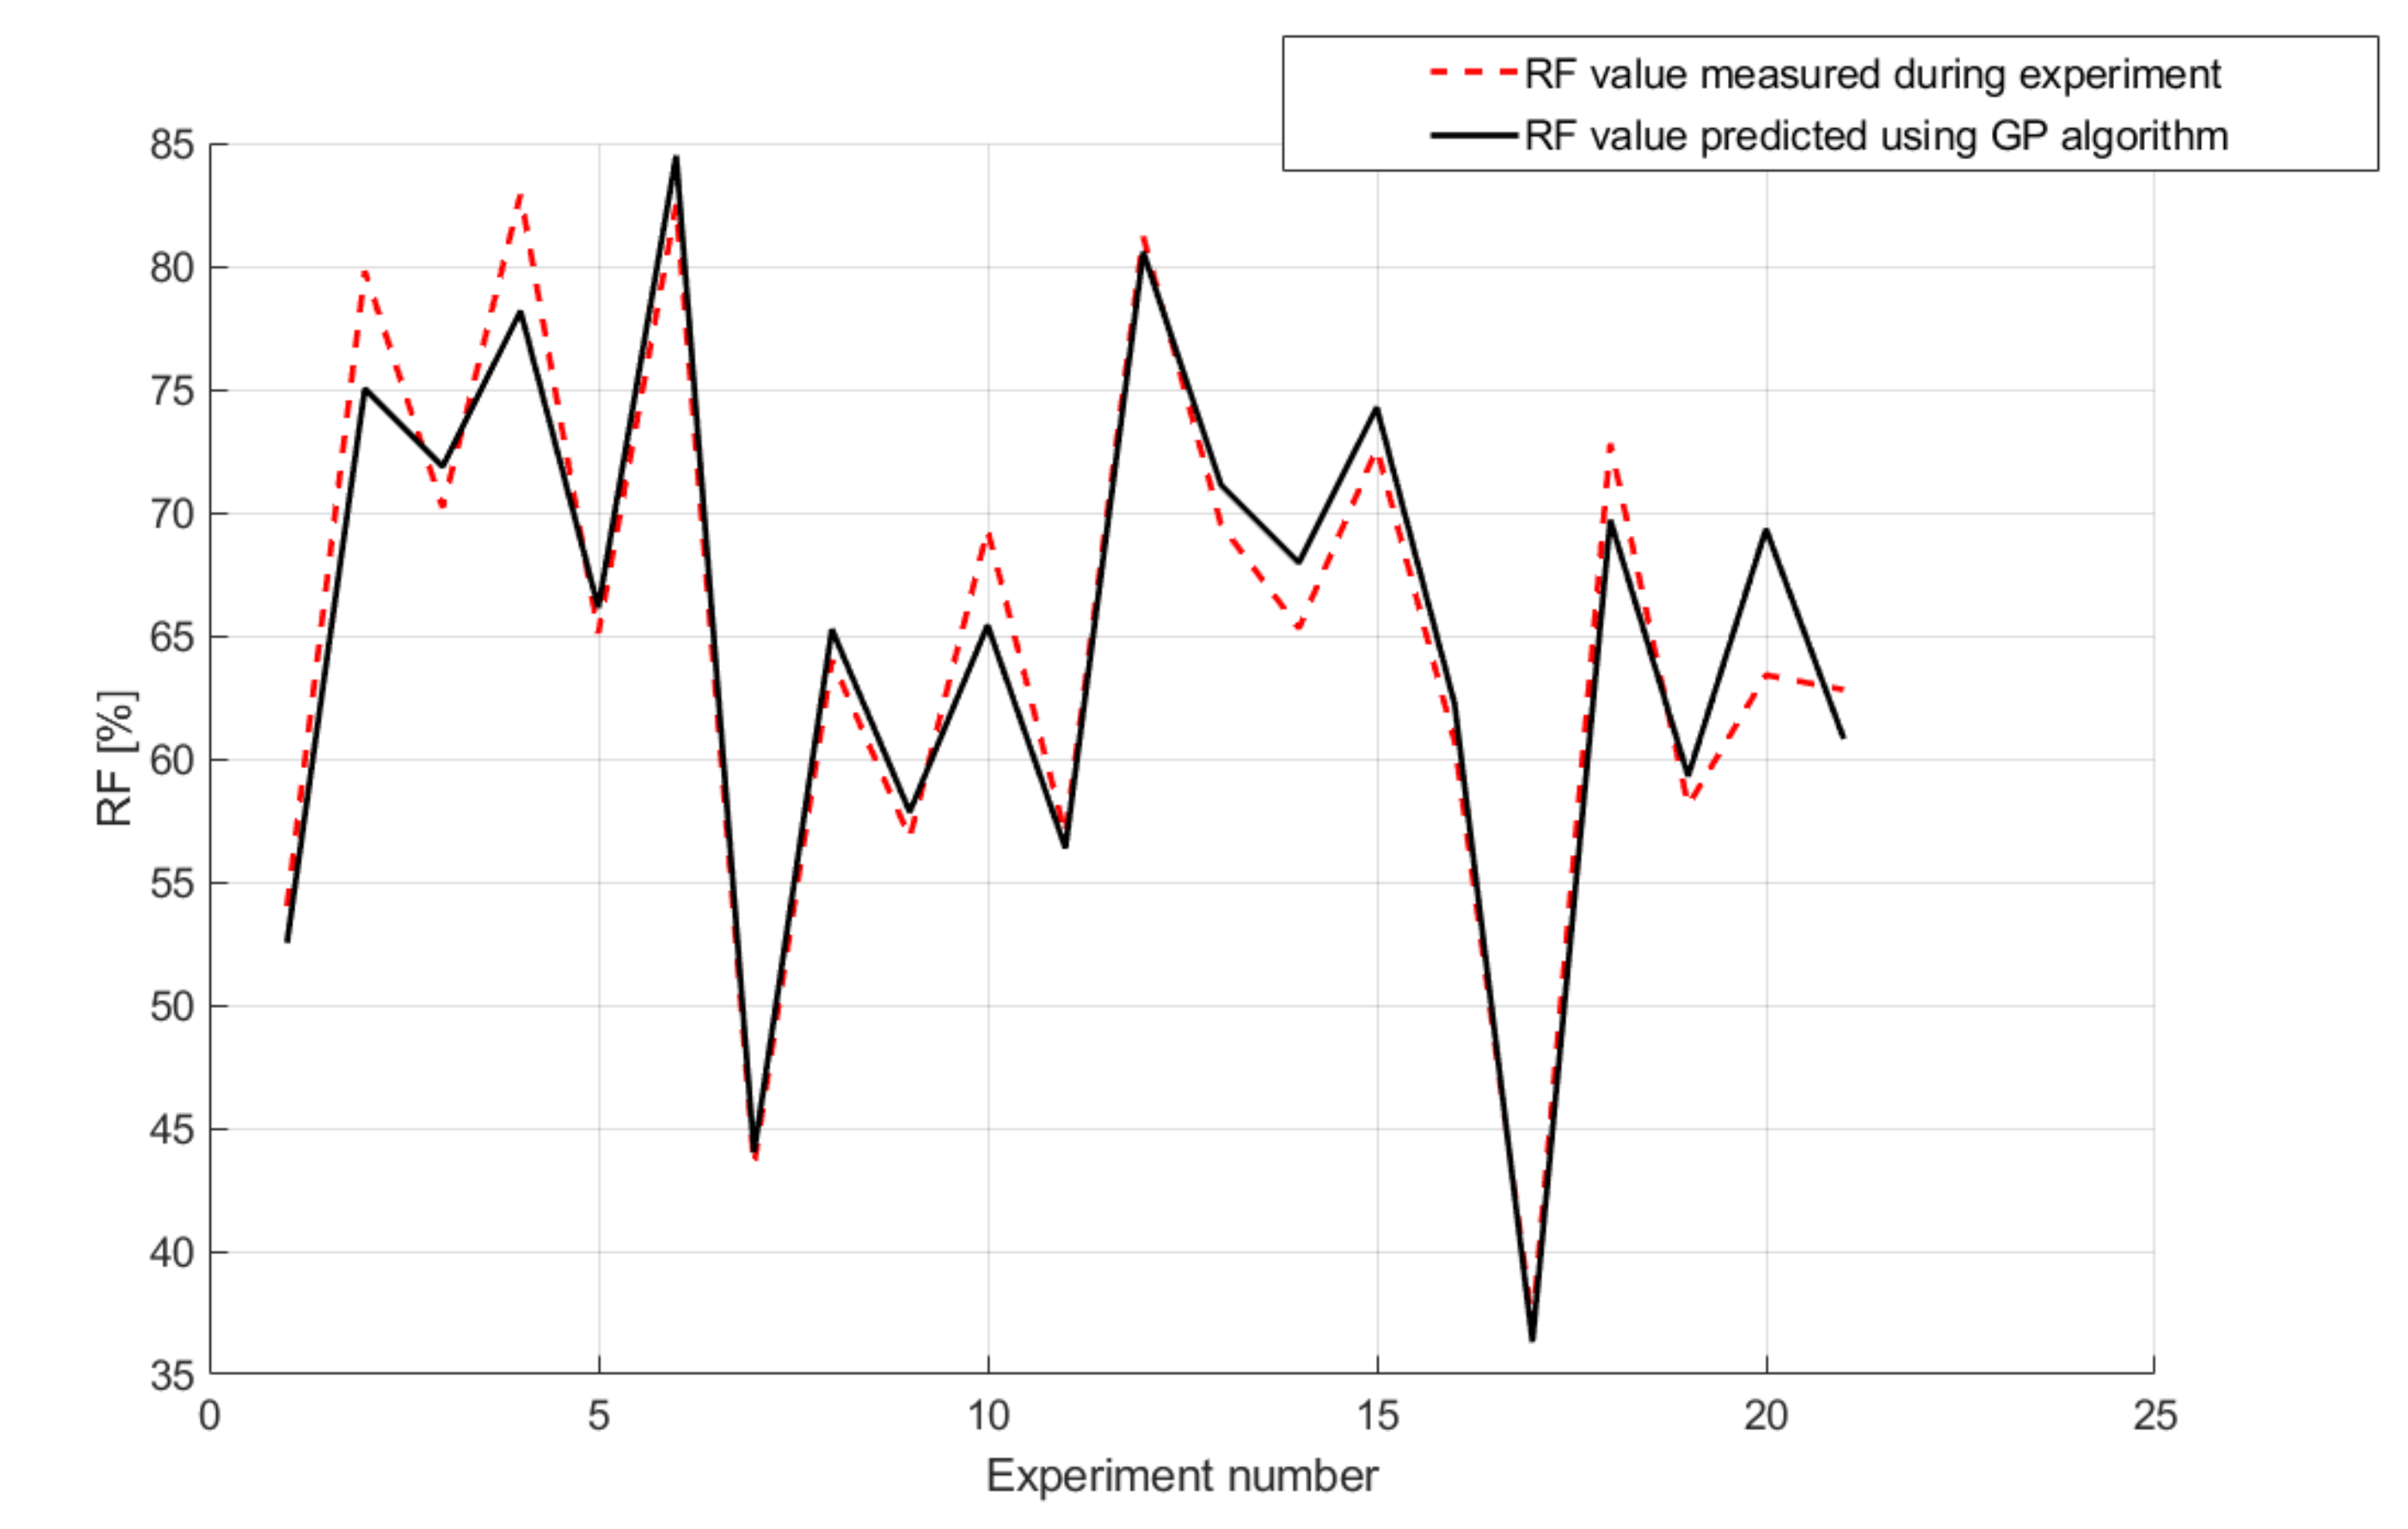
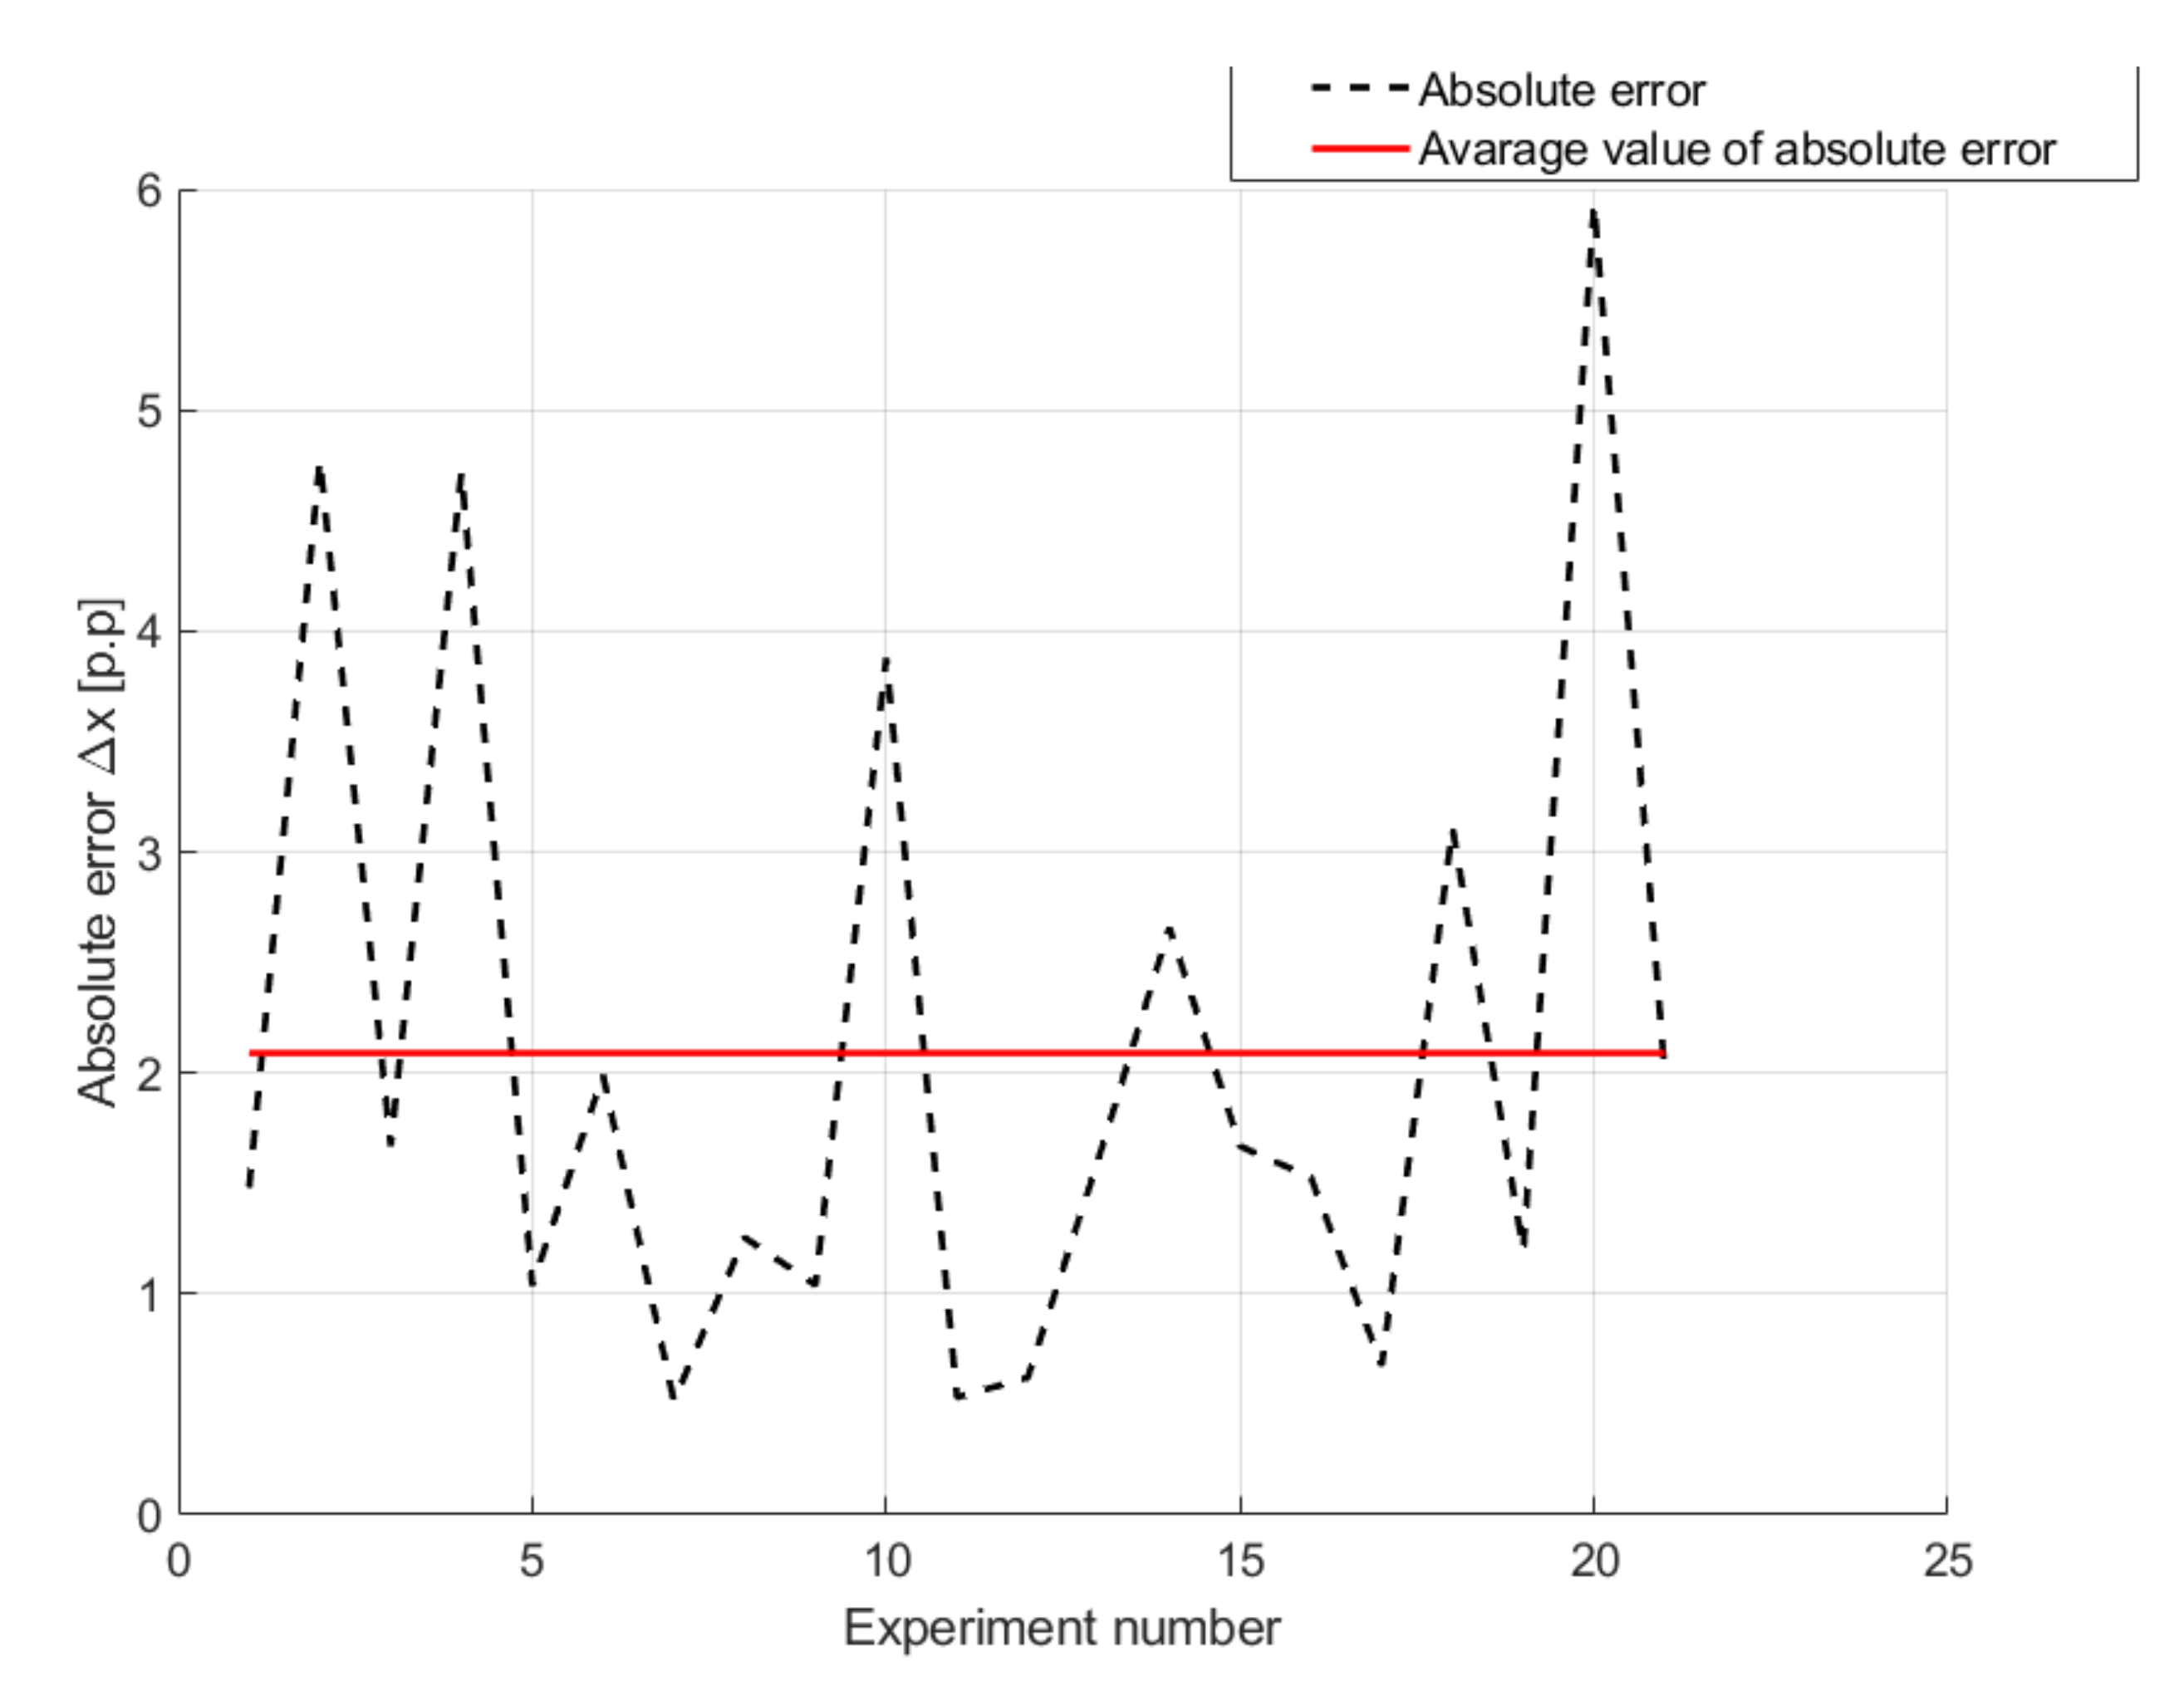
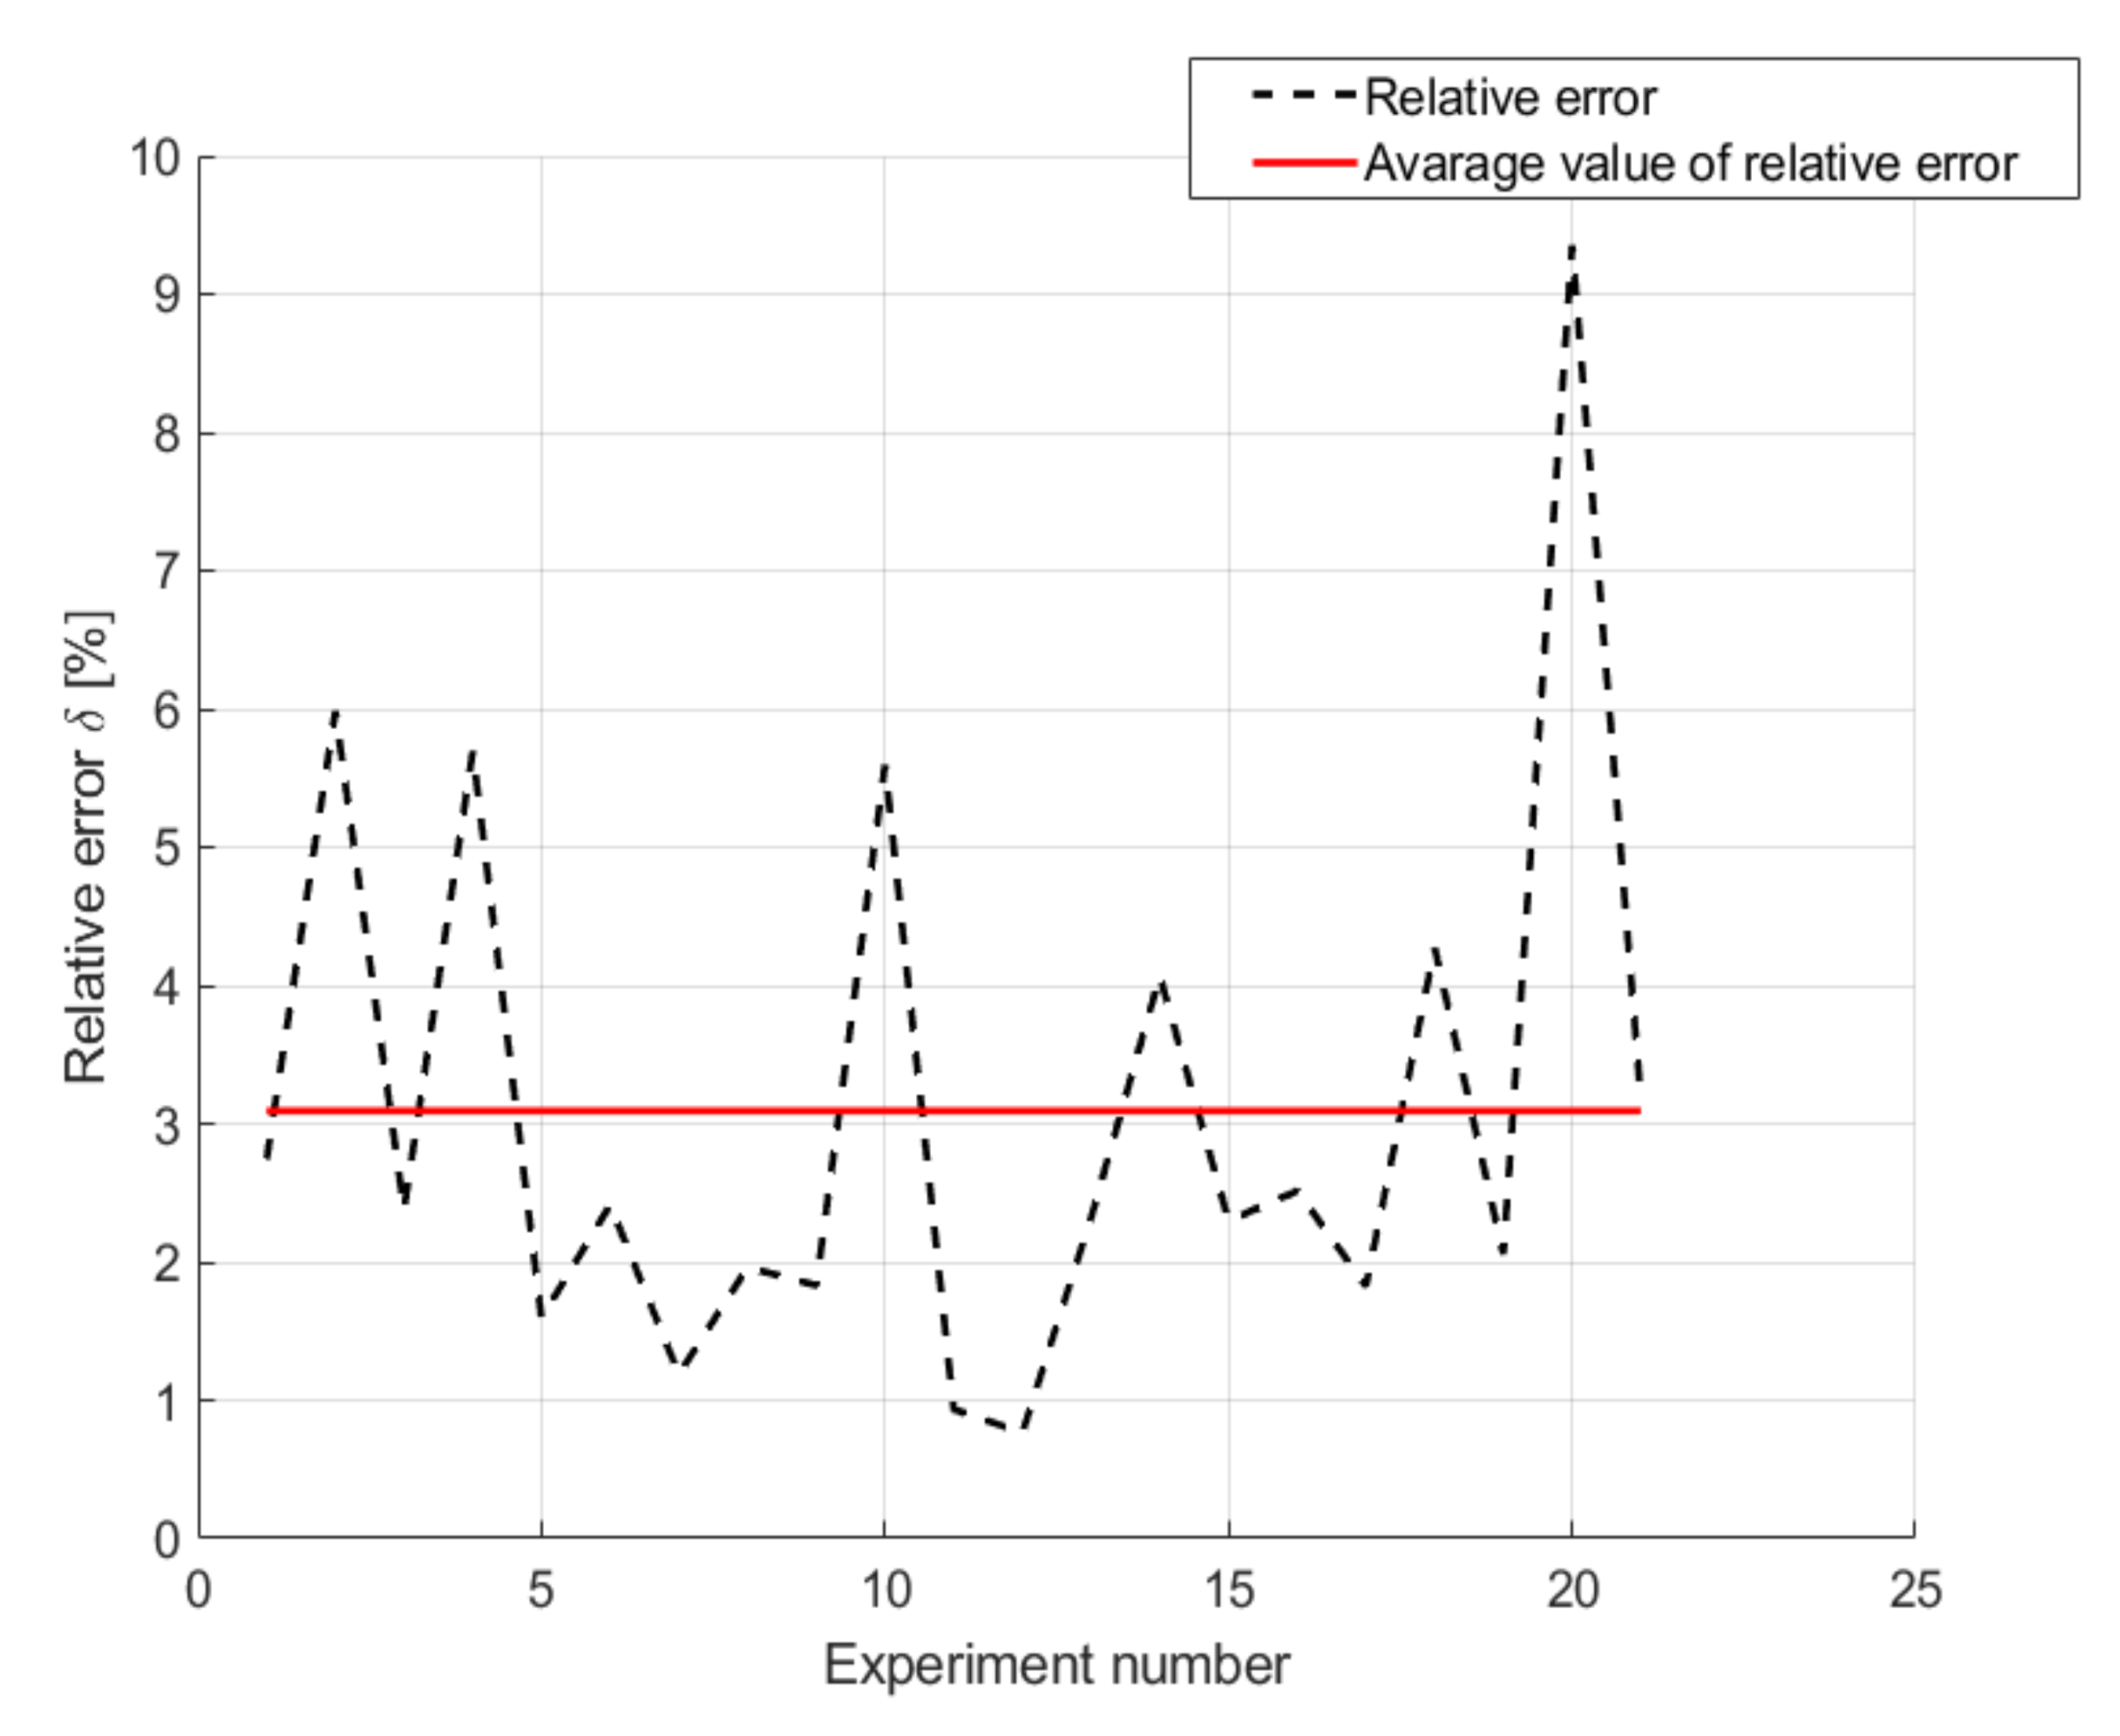
3.3. Empirical Modelling
4. Conclusions
Author Contributions
Funding
Institutional Review Board Statement
Informed Consent Statement
Data Availability Statement
Conflicts of Interest
Nomenclature
| AG | Acid gas |
| Cg | Total share of gas in injected fluid stream |
| CGI | Continuous Gas Injection |
| CWI | Continuous Water Injection |
| DI | Deionized water |
| EOR | Enhanced Oil Recovery |
| GP | Genetic Programming |
| IWAG | Immiscible WAG |
| KG | Very high-nitrogen natural gas |
| MG | High-nitrogen natural gas |
| MG | Nitrogen natural gas |
| MMP | Minimum Miscibility Pressure |
| nMWAG | Near miscible WAG |
| OLS | Orthogonal Least Squares |
| Pi | Injection pressure |
| pp | Percentage point |
| PV | Pore Volume |
| PVHC | Hydrocarbon Pore Volume |
| RF | Recovery factor |
| TWI | Total water injected |
| TGI | Total gas injected |
| WAG | Water Alternating Gas |
References
- McGlade, C.; Sondak, G.; Han, M. Whatever Happened to Enhanced Oil Recovery? International Energy Agency. 2018. Available online: https://www.iea.org/commentaries/whatever-happened-to-enhanced-oil-recovery (accessed on 10 January 2022).
- Sheng, J.J. Enhanced Oil Recovery Field Case Studies, 1st ed.; Gulf Professional Publishing: Oxford, UK, 2013. [Google Scholar] [CrossRef]
- Manrique, E.J.; Muci, V.E.; Gurfinkel, M.E. EOR Field Experiences in Carbonate Reservoirs in the United States. SPE Reserv. Eval. Eng. 2007, 10, 667–686. [Google Scholar] [CrossRef]
- Alnuaim, S. The Role of R&D in Energy Sustainability: Global Oil and Gas Supply Security and Future Energy Mix. J. Pet. Technol. 2019, 71, 10–11. [Google Scholar]
- Kargarpour, M.A. Carbonate reservoir characterization: An integrated approach. J. Pet. Explor. Prod. Technol. 2020, 10, 2655–2667. [Google Scholar] [CrossRef]
- Akbar, M.; Vissapragada, B.; Alghamdi, A.H.; Allen, D.; Herron, M.; Carnegie, A.; Dutta, D.; Olesen, J.R.; Chourasiya, R.D.; Logan, D.; et al. A Snapshot of Carbonate Reservoir Evaluation. Oilfield Rev. 2000, 12, 20–41. [Google Scholar]
- Jia, C. Petroleum Geology of Carbonate Reservoir. Adv. Top. Sci. Technol. China 2012, 495–532. [Google Scholar] [CrossRef]
- Huang, Z.; Xing, H.; Zhou, X.; You, H. Numerical study of vug effects on acid-rock reactive flow in carbonate reservoirs. Adv. Geo-Energy Res. 2020, 4, 448–459. [Google Scholar] [CrossRef]
- Masalmeh, S.K.; Wei, L.; Blom, C.; Jing, X. EOR Options for Heterogeneous Carbonate Reservoirs Currently under Waterflooding. In Proceedings of the Abu Dhabi International Petroleum Exhibition and Conference, Abu Dhabi, UAE, 10–13 November 2014; Society of Petroleum Engineers: Calgary, AB, Canada, 2014. [Google Scholar] [CrossRef]
- Mogensen, K.; Masalmeh, S. A review of EOR techniques for carbonate reservoirs in challenging geological settings. J. Pet. Sci. Eng. 2020, 195, 107889. [Google Scholar] [CrossRef]
- Jafari, M. Laboratory Study for Water, Gas and Wag Injection in Lab Scale and Core Condition. Pet. Coal 2014, 56, 175–181. [Google Scholar]
- Martyushev, D.A.; Yurikov, A. Evaluation of opening of fractures in the Logovskoye carbonate reservoir, Perm Krai, Russia. Pet. Res. 2021, 6, 137–143. [Google Scholar] [CrossRef]
- Chichinina, T.I.; Martyushev, D.A. Specific anisotropy properties of fractured reservoirs: Research on Thomsen’s anisotropy parameter delta. In Proceedings of the Geomodel 2021—23th Conference on Oil and Gas Geological Exploration and Development, Gelendzhik, Russia, 6–10 September 2021; Volume 2021, pp. 1–5. [Google Scholar] [CrossRef]
- Manrique, E.J.; Thomas, C.P.; Ravikiran, R.; Izadi, M.; Lantz, M.; Romero, J.L.; Alvaradov, V. EOR: Current status and opportunities. In Proceedings of the SPE Symposium on Improved Oil Recovery, Tulsa, OK, USA, 24–28 April 2010; Society of Petroleum Engineers (SPE): Calgary, AB, Canada, 2010; Volume 2. [Google Scholar] [CrossRef]
- Kulkarni, M.M.; Rao, D.N. Experimental investigation of miscible and immiscible Water-Alternating-Gas (WAG) process performance. J. Pet. Sci. Eng. 2005, 48, 1–20. [Google Scholar] [CrossRef]
- Christensen, J.R.; Stenby, E.H.; Skauge, A. Review of WAG Field Experience. SPE Reserv. Eval. Eng. 2001, 4, 97–106. [Google Scholar] [CrossRef]
- Afzali, S.; Rezaei, N.; Zendehboudi, S. A comprehensive review on Enhanced Oil Recovery by Water Alternating Gas (WAG) injection. Fuel 2018, 227, 218–246. [Google Scholar] [CrossRef]
- Christensen, J.R.; Stenby, E.H.; Skauge, A. Review of WAG Field Experience. In Proceedings of the International Petroleum Conference and Exhibition of Mexico, Villahermosa, Mexico, 3–5 March 1998; Society of Petroleum Engineers: Calgary, AB, Canada, 1998. [Google Scholar] [CrossRef]
- Teigland, R.; Kleppe, J. EOR Survey in the North Sea. In Proceedings of the SPE/DOE Symposium on Improved Oil Recovery, Tulsa, OK, USA, 22–26 April 2006; Society of Petroleum Engineers: Calgary, AB, Canada, 2006. [Google Scholar] [CrossRef]
- Surguchev, L.M.; Korbel, R.; Haugen, S.; Krakstad, O.S. Screening of WAG Injection Strategies for Heterogeneous Reservoirs. In Proceedings of the European Petroleum Conference, Cannes, France, 16–18 November 1992. [Google Scholar] [CrossRef]
- Skauge, A.; Serbie, K. Status of fluid flow mechanisms for miscible and immiscible WAG. In Proceedings of the Society of Petroleum Engineers—SPE EOR Conference at Oil and Gas West Asia 2014: Driving Integrated and Innovative EOR, Muscat, Oman, 31 March–2 April 2014; Society of Petroleum Engineers: Calgary, AB, Canada, 2014. [Google Scholar] [CrossRef]
- Caudle, B.H.; Dyes, A.B. Improving Miscible Displacement by Gas-Water Injection. Trans. AIME 1958, 213, 281–283. [Google Scholar] [CrossRef]
- Lin, E.C.; Poole, E.S. Numerical evaluation of single-slug, WAG, and hybrid CO2 injection processes, Dollarhide Devonian Unit, Andrews County, Texas. SPE Reserv. Eng. 1991, 6, 415–420. [Google Scholar] [CrossRef]
- Khan, M.Y.; Kohata, A.; Patel, H.; Syed, F.I.; Al Sowaidi, A.K. Water alternating gas WAG optimization using tapered WAG technique for a giant offshore middle east oil field. In Proceedings of the Society of Petroleum Engineers—Abu Dhabi International Petroleum Exhibition and Conference 2016, Abu Dhabi, UAE, 7 November 2016; Society of Petroleum Engineers: Calgary, AB, Canada, 2016; Volume 2016. [Google Scholar] [CrossRef]
- Fatemi, S.M.; Sohrabi, M. Experimental Investigation of Near-Miscible Water-Alternating-Gas Injection Performance in Water-Wet and Mixed-Wet Systems. SPE J. 2013, 18, 114–123. [Google Scholar] [CrossRef]
- Lubaś, J.; Stopa, J.; Wojnicki, M. Możliwości zastosowania zaawansowanych metod wspomagania wydobycia ropy naftowej ze złóż dojrzałych. Naft.-Gaz 2019, 75, 24–28. [Google Scholar] [CrossRef]
- Ma, T.D.; Youngren, G.K. Performance of Immiscible Water-Alternating-Gas (IWAG) Injection at Kuparuk River Unit, North Slope, Alaska. In Proceedings of the SPE Annual Technical Conference and Exhibition, New Orleans, LA, USA, 25 September 1994; Society of Petroleum Engineers: Calgary, AB, Canada, 1994. [Google Scholar] [CrossRef]
- Ramachandran, K.P.; Gyani, O.N.; Sur, S. Immiscible Hydrocarbon WAG: Laboratory to Field. In Proceedings of the SPE Oil and Gas India Conference and Exhibition, Mumbai, India, 20–22 January 2010; Society of Petroleum Engineers (SPE): Calgary, AB, Canada, 2010. [Google Scholar] [CrossRef]
- Agbalaka, C.C.; Dandekar, A.Y.; Patil, S.L.; Khataniar, S.; Hemsath, J. The Effect Of Wettability On Oil Recovery: A Review. In Proceedings of the SPE Asia Pacific Oil and Gas Conference and Exhibition, Perth, Australia, 20–22 October 2008; Society of Petroleum Engineers: Calgary, AB, Canada, 2008. [Google Scholar] [CrossRef]
- Huang, E.T.S.; Holm, L.W. Effect of WAG injection and rock wettability on oil recovery during CO2 flooding. SPE Reserv. Eng. 1988, 3, 119–129. [Google Scholar] [CrossRef]
- Hoare, G.; Coll, C. Effect of small/medium scale reservoir heterogeneity on the effectiveness of water, gas and water alternating gas WAG injection. In Proceedings of the Society of Petroleum Engineers—SPE Europec featured at 80th EAGE Conference and Exhibition 2018, Copenhagen, Denmark, 11–14 June 2018; Society of Petroleum Engineers: Calgary, AB, Canada, 2018. [Google Scholar] [CrossRef]
- Speight, J.G. Introduction to Enhanced Recovery Methods for Heavy Oil and Tar Sands; Elsevier: Amsterdam, The Netherlands, 2016. [Google Scholar] [CrossRef]
- van Lingen, P.P.; Barzanji, O.H.M.; van Kruijsdijk, C.P.J.W. WAG Injection to Reduce Capillary Entrapment in Small-Scale Heterogeneities. In Proceedings of the SPE Annual Technical Conference and Exhibition, Denver, CO, USA, 6 October 1996; Society of Petroleum Engineers: Calgary, AB, Canada, 1996. [Google Scholar] [CrossRef]
- Kharrat, R.; Mahdavi, S.; Ghorbani, D. A Comprehensive EOR Study of a Highly Fractured Matured Field-Case Study. In Proceedings of the SPE Europec/EAGE Annual Conference, Copenhagen, Denmark, 4–7 June 2012; Society of Petroleum Engineers: Calgary, AB, Canada, 2012. [Google Scholar] [CrossRef]
- Dang, C.; Nghiem, L.; Nguyen, N.; Chen, Z.; Nguyen, Q. Evaluation of CO2 Low Salinity Water-Alternating-Gas for enhanced oil recovery. J. Nat. Gas Sci. Eng. 2016, 35, 237–258. [Google Scholar] [CrossRef]
- Motealleh, M.; Kharrat, R.; Hashemi, A. An experimental investigation of water-alternating-CO2 coreflooding in a carbonate oil reservoir in different initial core conditions. Energy Sources Part A Recovery Util. Environ. Eff. 2013, 35, 1187–1196. [Google Scholar] [CrossRef]
- Teklu, T.W.; Alameri, W.; Graves, R.M.; Kazemi, H.; AlSumaiti, A.M. Low-salinity water-alternating-CO2 EOR. J. Pet. Sci. Eng. 2016, 142, 101–118. [Google Scholar] [CrossRef]
- Ghafoori, A.; Shahbazi, K.; Darabi, A.; Soleymanzadeh, A.; Abedini, A. The experimental investigation of nitrogen and carbon dioxide water-alternating-gas injection in a carbonate reservoir. Pet. Sci. Technol. 2012, 30, 1071–1081. [Google Scholar] [CrossRef]
- Al-Shuraiqi, H.S.; Muggeridge, A.H.; Grattoni, C.A. Laboratory Investigations of First Contact Miscible Wag Displacement: The Effects of Wag Ratio And Flow Rate. In Proceedings of the SPE International Improved Oil Recovery Conference in Asia Pacific, Kuala Lumpur, Malaysia, 20 October 2003; Society of Petroleum Engineers: Calgary, AB, Canada, 2003. [Google Scholar] [CrossRef]
- Juanes, R.; Blunt, M.J. Impact of viscous fingering on the prediction of optimum WAG ratio. SPE J. 2007, 12, 486–495. [Google Scholar] [CrossRef]
- Rahimi, V.; Bidarigh, M.; Bahrami, P. Experimental Study and Performance Investigation of Miscible Water-Alternating-CO2 Flooding for Enhancing Oil Recovery in the Sarvak Formation. Oil Gas Sci. Technol.–Rev. d’IFP Energies Nouv. 2017, 72, 35. [Google Scholar] [CrossRef] [Green Version]
- Wojnicki, M. Experimental investigations of oil displacement using the WAG method with carbon dioxide. Naft.-Gaz 2017, 73, 864–870. [Google Scholar] [CrossRef]
- Jiang, H.; Nuryaningsih, L.; Adidharma, H. The study of timing of cyclic injections in miscible CO2 WAG. In Proceedings of the Society of Petroleum Engineers Western Regional Meeting 2012, Bakersfield, CA, USA, 21 March 2012; Society of Petroleum Engineers: Calgary, AB, Canada, 2012. [Google Scholar] [CrossRef]
- Shahverdi, H.; Sohrabi, M.; Fatemi, M.; Jamiolahmady, M. Three-phase relative permeability and hysteresis effect during WAG process in mixed wet and low IFT systems. J. Pet. Sci. Eng. 2011, 78, 732–739. [Google Scholar] [CrossRef]
- Fatemi, S.M.; Sohrabi, M. Cyclic hysteresis of three-phase relative permeability curves applicable to WAG injection under low gas/oil IFT: Effect of immobile water saturation, injection scenario and rock permeability. In Proceedings of the 75th European Association of Geoscientists and Engineers Conference and Exhibition 2013 Incorporating SPE EUROPEC 2013: Changing Frontiers, European Association of Geoscientists and Engineers, EAGE, London, UK, 10 June 2013. [Google Scholar] [CrossRef]
- Sohrabi, M.; Danesh, A.; Jamiolahmady, M. Visualisation of residual oil recovery by near-miscible gas and SWAG injection using high-pressure micromodels. Transp. Porous Media 2008, 74, 239–257. [Google Scholar] [CrossRef]
- Sohrabi, M.; Tehrani, D.H.; Danesh, A.; Henderson, G.D. Visualization of oil recovery by water-alternating-gas injection using high-pressure micromodels. SPE J. 2004, 9, 290–301. [Google Scholar] [CrossRef]
- Dong, M.; Foraie, J.; Huang, S.; Chatzis, I. Analysis of immiscible Water-Alternating-Gas (WAG) injection using micromodel tests. J. Can. Pet. Technol. 2005, 44, 17–24. [Google Scholar] [CrossRef]
- Larsen, J.K.; Bech, N.; Winter, A. Three-Phase Immiscible WAG Injection: Micromodel Experiments and Network Models. In Proceedings of the SPE/DOE Improved Oil Recovery Symposium, Tulsa, OK, USA, 3–5 April 2000; Society of Petroleum Engineers (SPE): Calgary, AB, Canada, 2000. [Google Scholar] [CrossRef]
- Wojnicki, M.; Lubás, J.; Warnecki, M.; Kúsnierczyk, J.; Szuflita, S. Experimental studies of immiscible high-nitrogen natural gas WAG injection efficiency in mixed-wet carbonate reservoir. Energies 2020, 13, 2346. [Google Scholar] [CrossRef]
- Luchian, H.; Băutu, A.; Băutu, E. Genetic programming techniques with applications in the oil and gas industry. In Artificial Intelligent Approaches in Petroleum Geosciences; Springer International Publishing: Berlin/Heidelberg, Germany, 2015. [Google Scholar] [CrossRef]
- Velez-Langs, O. Genetic algorithms in oil industry: An overview. J. Pet. Sci. Eng. 2005, 47, 15–22. [Google Scholar] [CrossRef]
- Jensen, J.P.; Andersen, M.G. Reservoir Production Optimization Using Genetic Algorithms and Artificial Neural Networks; Downing, K., Ed.; Institutt for datateknologi og informatikk: Trondheim, Norway, 2009. [Google Scholar]
- Soleng, H.H. Oil reservoir production forecasting with uncertainty estimation using genetic algorithms. In Proceedings of the 1999 Congress on Evolutionary Computation, CEC 1999, Washington, DC, USA, 6–9 July 1999; IEEE Computer Society: Washington, DC, USA, 1999; Volume 2. [Google Scholar] [CrossRef]
- Vo Thanh, H.; Sugai, Y.; Nguele, R.; Sasaki, K. Robust optimization of CO2 sequestration through a water alternating gas process under geological uncertainties in Cuu Long Basin, Vietnam. J. Nat. Gas Sci. Eng. 2020, 76, 103208. [Google Scholar] [CrossRef]
- Safarzadeh, M.A.; Motahhari, S.M. Co-optimization of carbon dioxide storage and enhanced oil recovery in oil reservoirs using a multi-objective genetic algorithm (NSGA-II). Pet. Sci. 2014, 11, 460–468. [Google Scholar] [CrossRef] [Green Version]
- Mohagheghian, E.; James, L.A.; Haynes, R.D. Optimization of hydrocarbon water alternating gas in the Norne field: Application of evolutionary algorithms. Fuel 2018, 223, 86–98. [Google Scholar] [CrossRef]
- Nait Amar, M.; Zeraibi, N.; Redouane, K. Optimization of WAG Process Using Dynamic Proxy, Genetic Algorithm and Ant Colony Optimization. Arab. J. Sci. Eng. 2018, 43, 6399–6412. [Google Scholar] [CrossRef]
- Janiga, D.; Czarnota, R.; Stopa, J.; Wojnarowski, P. Huff and puff process optimization in micro scale by coupling laboratory experiment and numerical simulation. Fuel 2018, 224, 289–301. [Google Scholar] [CrossRef]
- Khan, M.R.; Kalam, S.; Khan, R.A.; Tariq, Z.; Abdulraheem, A. Comparative analysis of intelligent algorithms to predict the minimum miscibility pressure for hydrocarbon gas flooding. In Proceedings of the Society of Petroleum Engineers—Abu Dhabi International Petroleum Exhibition and Conference 2019, ADIP 2019, Abu Dhabi, UAE, 11–14 November 2019; Society of Petroleum Engineers: Calgary, AB, Canada, 2019. [Google Scholar] [CrossRef]
- Mahdiani, M.R.; Kooti, G. The most accurate heuristic-based algorithms for estimating the oil formation volume factor. Petroleum 2016, 2, 40–48. [Google Scholar] [CrossRef] [Green Version]
- Nasery, S.; Hoseinpour, S.; Phung, L.T.K.; Bahadori, A. Prediction of the viscosity of water-in-oil emulsions. Pet. Sci. Technol. 2016, 34, 1972–1977. [Google Scholar] [CrossRef]
- Tukur, A.D.; Nzerem, P.; Nsan, N.; Okafor, I.S.; Gimba, A.; Ogolo, O.; Oluwaseun, A.; Andrew, O. Well placement optimization using simulated annealing and genetic algorithm. In Proceedings of the Society of Petroleum Engineers—SPE Nigeria Annual International Conference and Exhibition 2019, NAIC 2019, Lagos, Nigeria, 5–7 August 2019; Society of Petroleum Engineers: Calgary, AB, Canada, 2019. [Google Scholar] [CrossRef]
- Li, H.; Yu, H.; Cao, N.; Tian, H.; Cheng, S. Applications of Artificial Intelligence in Oil and Gas Development. Arch. Comput. Methods Eng. 2020, 28, 937–949. [Google Scholar] [CrossRef]
- López, S.; Koç, U.; Bakker, E.; Rahmani, J. Optimization of Lift Gas Allocation Using Evolutionary Algorithms. Int. J. Comput. Appl. Technol. Res. 2019, 8, 353–357. [Google Scholar] [CrossRef]
- Andreasen, A. Applied Process Simulation-Driven Oil and Gas Separation Plant Optimization Using Surrogate Modeling and Evolutionary Algorithms. ChemEngineering 2020, 4, 11. [Google Scholar] [CrossRef] [Green Version]
- De Pádua, L.; Sales, A.; Ramalho Pitombeira-Neto, A.; De Athayde Prata, B. A genetic algorithm integrated with Monte Carlo simulation for the field layout design problem. Oil Gas Sci. Technol.–Rev. d’IFP Energies Nouv. 2018, 73, 24. [Google Scholar] [CrossRef] [Green Version]
- American Petroleum Institute (API). Sampling Petroleum Reservoir Fluids; API Recommended Practice 2003; American Petroleum Institute (API): Washington, DC, USA, 2003; Volume 44. [Google Scholar]
- Langaas, K.; Ekrann, S.; Ebeltoft, E. A criterion for ordering individuals in a composite core. J. Pet. Sci. Eng. 1998, 19, 21–32. [Google Scholar] [CrossRef]
- Piñerez, I.; Puntervold, T.; Strand, S.; Hopkins, P.; Aslanidis, P.; Yang, H.S.; Kinn, M.S. Core wettability reproduction: A new solvent cleaning and core restoration strategy for chalk cores. J. Pet. Sci. Eng. 2020, 195, 107654. [Google Scholar] [CrossRef]
- Holtz, M.H. Immiscible water alternating gas (IWAG) EOR: Current state of the art. In Proceedings of the SPE—DOE Improved Oil Recovery Symposium, Tulsa, OK, USA, 11 April 2016; Society of Petroleum Engineers (SPE): Calgary, AB, Canada, 2016; Volume 2016. [Google Scholar] [CrossRef]
- Holm, L.W.; Josendal, V.A. Effect of Oil Composition on Miscible-Type Displacement by Carbon Dioxide. Soc. Pet. Eng. J. 1982, 22, 87–98. [Google Scholar] [CrossRef]
- Holm, L.W. Miscibility and Miscible Displacement. J. Pet. Technol. 1986, 38, 817–818. [Google Scholar] [CrossRef]
- Whitson, C.H.; Brulé, M.R. Phase behavior. SPE Monogr. Ser. 2000, 20, 233. [Google Scholar]
- Koza, J.R. Genetic programming as a means for programming computers by natural selection. Stat. Comput. 1994, 4, 87–112. [Google Scholar] [CrossRef]
- Koza, J.R.; Poli, R. Genetic Programming. In Search Methodologies: Introductory Tutorials in Optimization and Decision Support Techniques; Springer: Berlin/Heidelberg, Germany, 2005; pp. 127–164. [Google Scholar] [CrossRef]
- Sette, S.; Boullart, L. Genetic programming: Principles and applications. Eng. Appl. Artif. Intell. 2001, 14, 727–736. [Google Scholar] [CrossRef]
- Poli, R.; Langdon, W.B.; Mcphee, N.F.; Koza, J.R. A Field Guide to Genetic Programming. 2008. Available online: http://www.gp-field-guide.org.uk (accessed on 15 October 2021).
- Madár, J.; Abonyi, J.; Szeifert, F. Genetic Programming for the Identification of Nonlinear Input−Output Models. Ind. Eng. Chem. Res. 2005, 44, 3178–3186. [Google Scholar] [CrossRef]
- Glaso, O. Miscible displacement: Recovery Tests Nitrogen. SPE Reserv. Eng. Soc. Pet. Eng. 1990, 5, 61–68. [Google Scholar] [CrossRef]
- Sebastian, H.M.; Lawrence, D.D. Nitrogen Minimum Miscibility Pressures. In Proceedings of the SPE/DOE Enhanced Oil Recovery Symposium, Tulsa, OK, USA, 22–24 April 1992; Society of Petroleum Engineers: Calgary, AB, Canada, 1992. [Google Scholar] [CrossRef]
- Anada, H.R. State-of-the-Art Review of Nitrogen and Flue Gas Flooding in Enhanced Oil Recovery; Final Report; Science Applications, Inc.: Pittsburgh, PA, USA; Morgantown, WV, USA, 1980. [Google Scholar] [CrossRef] [Green Version]
- Hudgins, D.A.; Llave, F.M.; Chung, F.T.H. Nitrogen Miscible Displacement of Light Crude Oil: A Laboratory Study. SPE Reserv. Eng. 1990, 5, 100–106. [Google Scholar] [CrossRef]


| Component | N2 | CO2 | H2S | C1 | C2 | C3 | C4 | C5 | C6 | C7 | C8 | C9 | C10− | C11 | C12 | C13 | C14 | C15+ |
|---|---|---|---|---|---|---|---|---|---|---|---|---|---|---|---|---|---|---|
| Mol % | 30.4 | 0.5 | 4.8 | 19.3 | 3.4 | 2.6 | 2.3 | 3.2 | 2.4 | 2.8 | 3.1 | 2.9 | 2.7 | 2.0 | 1.7 | 1.6 | 1.4 | 13.1 |
| Total Salinity (g/L) | Cation (g/L) | Anion (g/L) | |||||||||||
|---|---|---|---|---|---|---|---|---|---|---|---|---|---|
| Na+ | K+ | Mg2+ | Ca2+ | NH4+ | Cl− | Br− | SiO32− | HCO3− | SO42− | S2− | |||
| 8.932 | 2.03 | 0.462 | 0.062 | 0.389 | 0.259 | 5.265 | 0.037 | 0.013 | 0.177 | 0.147 | 0.505 | ||
| Density (kg/m3) | Component Concentration (%mol) | |||||||||
|---|---|---|---|---|---|---|---|---|---|---|
| N2 | H2S | CO2 | H2 | C1 | C2 | C3 | C4+ | |||
| 1.2507 | 86.9 | 2.7 | 1.2 | 1.1 | 5.6 | 0.8 | 0.7 | 1 | ||
| Density (kg/m3) | Component Concentration (%mol) | ||||||||
|---|---|---|---|---|---|---|---|---|---|
| N2 | H2S | CO2 | C1 | C2 | C3 | C4+ | |||
| 1.164 | 58.6 | 3.3 | 0.3 | 28.7 | 4.7 | 2.6 | 0.7 | ||
| Core ID | Permeability | Effective Porosity | Core Volume | Grain Density | Length | Diameter |
|---|---|---|---|---|---|---|
| [mD] | [%] | [cm3] | [g/cm3] | [cm] | [cm] | |
| 46 | 96.4 | 19.01 | 26.916 | 2.823 | 5.35 | 2.54 |
| 85 | 83.1 | 31.64 | 24.925 | 2.818 | 4.98 | 2.54 |
| 49 | 59.1 | 28.25 | 26.511 | 2.817 | 5.29 | 2.54 |
| 25 | 43.5 | 29.54 | 28.006 | 2.817 | 5.59 | 2.54 |
| Composite core parameters | ||||||
| Average permeability [mD] | 70.5 | |||||
| Average permeability [%] | 27.1 | |||||
| Composite core volume [cm3] | 106.4 | |||||
| Composite core pore volume [cm3] | 28.8 | |||||
| Composite core length | 21.21 | |||||
| Composite Core No. | Length [cm] | Average Porosity [%] | Average Permeability [mD] | Pore Volume [cm3] |
|---|---|---|---|---|
| 1 | 21.21 | 27.1 | 70.5 | 28.8 |
| 2 | 21.73 | 30.4 | 77.3 | 33.0 |
| 3 | 21.95 | 24.6 | 72.1 | 26.4 |
| 4 | 22.30 | 22.7 | 80.7 | 25.7 |
| 5 | 21.40 | 24.6 | 80.4 | 26.7 |
| 6 | 22.15 | 28.7 | 77.0 | 31.8 |
| Parameter | Setting |
|---|---|
| Length | 25 m |
| Internal diameter | 5 mm |
| Pore volume | 174.659 cm3 |
| Porosity | 15 D |
| Permeability | 35% |
| Grain type | Quartz sand |
| Grain size | 0.15–0.20 mm |
| Injection rate | |
| Temperature | 126 °C |
| Test No. | Injected Gas | Oil Saturation Pressure [bar] | Gas Injection Pressure [bar] |
|---|---|---|---|
| 1 | CO2 | 130 | 140 |
| 2 | CO2 | 160 | 170 |
| 3 | CO2 | 200 | 210 |
| 4 | CO2 | 280 | 290 |
| 5 | CO2 | 330 | 340 |
| 6 | CO2 | 420 | 430 |
| 7 | AG | 130 | 140 |
| 8 | AG | 160 | 170 |
| 9 | AG | 200 | 210 |
| 10 | AG | 280 | 290 |
| 11 | AG | 330 | 340 |
| 12 | AG | 420 | 430 |
| 13 | MG | 240 | 250 |
| 14 | MG | 280 | 290 |
| 15 | MG | 330 | 340 |
| 16 | MG | 420 | 430 |
| 17 | MG | 460 | 470 |
| Test No | Composite Core No | Injection Type | Injected Fluid | WAG Ratio | Number of WAG Cycles | Pi [bar] | Swi [%] | Soi [%] | TWI 1 [PVHC] | TGI 2 [PVHC] |
|---|---|---|---|---|---|---|---|---|---|---|
| 1 | 6 | CGI | CO2 | 0:1 | - | 270 | 45.6 | 54.4 | 0 | 1.2 |
| 2 | 2 | WAG | CO2/Water | 1:1 | 3 | 270 | 53 | 47 | 0.6 | 0.6 |
| 3 | 3 | WAG | CO2/Water | 2:1 | 2 | 270 | 59.3 | 40.7 | 0.8 | 0.4 |
| 4 | 4 | WAG | CO2/Water | 1:2 | 2 | 270 | 54.2 | 45.8 | 0.4 | 0.8 |
| 5 | 5 | WAG | CO2/Water | 1:1 | 3 | 170 | 54.8 | 45.2 | 0.6 | 0.6 |
| 6 | 6 | CGI | MG | 0:1 | - | 270 | 42.1 | 57.9 | 0 | 1.2 |
| 7 | 5 | WAG | MG/Water | 1:1 | 3 | 270 | 37.1 | 62.9 | 0.6 | 0.6 |
| 8 | 1 | WAG | MG/Water | 2:1 | 2 | 270 | 43.5 | 56.5 | 0.8 | 0.4 |
| 9 | 2 | WAG | MG/Water | 1:2 | 2 | 270 | 42.2 | 57.8 | 0.4 | 0.8 |
| 10 | 2 | WAG | MG/Water | 1:1 | 3 | 170 | 59.5 | 40.5 | 0.6 | 0.6 |
| 11 | 1 | CGI | AG | 0:1 | - | 270 | 40.6 | 59.4 | 0 | 1.2 |
| 12 | 6 | WAG | AG/Water | 1:1 | 3 | 270 | 41.7 | 58.3 | 0.6 | 0.6 |
| 13 | 3 | WAG | AG/Water | 2:1 | 2 | 270 | 42.6 | 57.4 | 0.8 | 0.4 |
| 14 | 5 | WAG | AG/Water | 1:2 | 2 | 270 | 33.4 | 66.6 | 0.4 | 0.8 |
| 15 | 4 | WAG | AG/Water | 1:1 | 3 | 170 | 38.3 | 61.7 | 0.6 | 0.6 |
| 16 | 5 | WAG | KG | 1:2 | 2 | 270 | 34.9 | 65.1 | 0.4 | 0.8 |
| 17 | 6 | WAG | KG | 1:1 | 3 | 170 | 31.7 | 68.3 | 0.6 | 0.6 |
| Parameter | Setting |
|---|---|
| Population size | 1500 |
| Max. tree depth | 5 |
| Number of generations (iterations) | 500 |
| Generation gap | 0.8 |
| Probability of mutation | 0.3 |
| Probability of crossover | 0.7 |
| Type of selection | Tournament |
| Type of crossover | One-point |
| Type of mutation | Randomly selected node |
| Type of replacement | Least fitness score |
| Input variables | 7 |
| Variables | |||||||||
|---|---|---|---|---|---|---|---|---|---|
| Exp No. | Gas | RF from Coreflooding [%] | CO2 | H2S | N2 | C3+ | C1 | Cg [%] | P [bar] |
| 1 | - | 54 | 0 | 0 | 0 | 0 | 0 | 0 | 270 |
| 2 | CO2 | 79.8 | 100 | 0 | 0 | 0 | 0 | 50.0 | 270 |
| 3 | 70.2 | 100 | 0 | 0 | 0 | 0 | 33.3 | 270 | |
| 4 | 82.9 | 100 | 0 | 0 | 0 | 0 | 66.7 | 270 | |
| 5 | 65.1 | 100 | 0 | 0 | 0 | 0 | 50.0 | 170 | |
| 6 | 82.5 | 100 | 0 | 0 | 0 | 0 | 100.0 | 270 | |
| 7 | GM | 43 | 0.28 | 3.26 | 58.5 | 4.57 | 28.66 | 100.0 | 270 |
| 8 | 64 | 0.28 | 3.26 | 58.5 | 4.57 | 28.66 | 50.0 | 270 | |
| 9 | 56.8 | 0.28 | 3.26 | 58.5 | 4.57 | 28.66 | 33.3 | 270 | |
| 10 | 69.3 | 0.28 | 3.26 | 58.5 | 4.57 | 28.66 | 66.7 | 270 | |
| 11 | 56.9 | 0.28 | 3.26 | 58.5 | 4.57 | 28.66 | 50.0 | 170 | |
| 12 | Acid gas (CO2+H2S) | 81.2 | 70 | 30 | 0 | 0 | 0 | 100.0 | 270 |
| 13 | 69.5 | 70 | 30 | 0 | 0 | 0 | 50.0 | 270 | |
| 14 | 65.3 | 70 | 30 | 0 | 0 | 0 | 33.3 | 270 | |
| 15 | 72.6 | 70 | 30 | 0 | 0 | 0 | 66.7 | 270 | |
| 16 | 60.7 | 70 | 30 | 0 | 0 | 0 | 50.0 | 170 | |
| 17 | GK | 37 | 1.2 | 2.73 | 86.85 | 1.73 | 5.63 | 100.0 | 270 |
| 18 | 72.1 | 1.2 | 2.73 | 86.85 | 1.73 | 5.63 | 50.0 | 270 | |
| 19 | 58.1 | 1.2 | 2.73 | 86.85 | 1.73 | 5.63 | 33.3 | 270 | |
| 20 | 63.4 | 1.2 | 2.73 | 86.85 | 1.73 | 5.63 | 66.7 | 270 | |
| 21 | 62.8 | 1.2 | 2.73 | 86.85 | 1.73 | 5.63 | 50.0 | 170 | |
Publisher’s Note: MDPI stays neutral with regard to jurisdictional claims in published maps and institutional affiliations. |
© 2022 by the authors. Licensee MDPI, Basel, Switzerland. This article is an open access article distributed under the terms and conditions of the Creative Commons Attribution (CC BY) license (https://creativecommons.org/licenses/by/4.0/).
Share and Cite
Wojnicki, M.; Lubaś, J.; Gawroński, M.; Szuflita, S.; Kuśnierczyk, J.; Warnecki, M. An Experimental Investigation of WAG Injection in a Carbonate Reservoir and Prediction of the Recovery Factor Using Genetic Programming. Energies 2022, 15, 2127. https://doi.org/10.3390/en15062127
Wojnicki M, Lubaś J, Gawroński M, Szuflita S, Kuśnierczyk J, Warnecki M. An Experimental Investigation of WAG Injection in a Carbonate Reservoir and Prediction of the Recovery Factor Using Genetic Programming. Energies. 2022; 15(6):2127. https://doi.org/10.3390/en15062127
Chicago/Turabian StyleWojnicki, Mirosław, Jan Lubaś, Mateusz Gawroński, Sławomir Szuflita, Jerzy Kuśnierczyk, and Marcin Warnecki. 2022. "An Experimental Investigation of WAG Injection in a Carbonate Reservoir and Prediction of the Recovery Factor Using Genetic Programming" Energies 15, no. 6: 2127. https://doi.org/10.3390/en15062127