Article

Topography and Data Mining Based Methods for Improving Satellite Precipitation in Mountainous Areas of China

1
Department of Hydraulic Engineering, Tsinghua University, Beijing 100084, China
2
State Key Lab of Hydroscience and Engineering, Tsinghua University, Beijing 100084, China
*
Author to whom correspondence should be addressed.
Atmosphere 2015, 6(8), 983-1005; https://doi.org/10.3390/atmos6080983
Submission received: 16 February 2015 / Revised: 14 July 2015 / Accepted: 14 July 2015 / Published: 24 July 2015
(This article belongs to the Special Issue Climate Variable Forecasting)

Abstract

:
Topography is a significant factor influencing the spatial distribution of precipitation. This study developed a new methodology to evaluate and calibrate the Tropical Rainfall Measuring Mission Multi-satellite Precipitation Analysis (TMPA) products by merging geographic and topographic information. In the proposed method, firstly, the consistency rule was introduced to evaluate the fitness of satellite rainfall with measurements on the grids with and without ground gauges. Secondly, in order to improve the consistency rate of satellite rainfall, genetic programming was introduced to mine the relationship between the gauge rainfall and location, elevation and TMPA rainfall. The proof experiment and analysis for the mean annual satellite precipitation from 2001–2012, 3B43 (V7) of TMPA rainfall product, was carried out in eight mountainous areas of China. The result shows that the proposed method is significant and efficient both for the assessment and improvement of satellite precipitation. It is found that the satellite rainfall consistency rates in the gauged and ungauged grids are different in the study area. In addition, the mined correlation of location-elevation-TMPA rainfall can noticeably improve the satellite precipitation, both in the context of the new criterion of the consistency rate and the existing criteria such as Bias and RMSD. The proposed method is also efficient for correcting the monthly and mean monthly rainfall of 3B43 and 3B42RT.

Graphical Abstract

1. Introduction

Precipitation is an important factor in water cycle systems, providing critical information for land-surface hydrological processes, climatological research, and water resource management. Measurements of precipitation include traditional ground gauge stations, and more recently, satellite-based remote sensing monitoring. Although there are potential uncertainties caused by various factors, such as systematic and random errors [1], and difficulties in capturing solid precipitation [2], gauge station rainfall has been widely accepted in terms of both accuracy and effectiveness due to its direct measurement. However, the sparse gauge networks, especially in rough terrains and mountainous areas, hinder the application of gauge rainfall to basins/regional scales [3].
Fortunately, satellites provide an unprecedented possibility for retrieving global precipitation with satisfactory spatial and temporal resolutions over large scales [4]. Numerous satellite-based precipitation products in a variety of spatiotemporal scales have been publicly introduced despite widely diverse levels of accuracy [5,6,7]. Among them, the Tropical Rainfall Measuring Mission Multi-satellite Precipitation Analysis (TMPA) is one of the most widely used products [8,9]. TMPA provides two kinds of products, near-real-time products and post-real-time products. The near-real-time products provide valuable data 6–9 h after observation for real-time hydrological and water-related disaster forecasts at the expense of accuracy [10,11]. Post-real-time products incorporate the global gauge dataset aiming at providing high quality rainfall data for research purposes with two months’ latency of observation, and so called research products. The latest version is TMPA V7 issued in 2012 including 3B42RT for near-real-time and 3B43 for post-real-time. The 3B43 has been adjusted according to the gauge dataset produced by the Global Precipitation Climatology Center [12].
Because of the indirect measurement and lack of reliable microwave data or high quality algorithms in areas characterized by cold land temperatures, snow-cover and ice-cover [12,13], uncertainties are inevitable for satellite rainfall products. Normally, satellite rainfall over grid cells with gauges is extracted and compared with gauge data, and the accuracy is evaluated by statistical metrics (e.g., mean bias and root mean squared error) [14,15]. Many efforts have been taken to investigate the errors in satellite rainfall measurements at regional, national and global scales, with some consistent findings. In general, research products of TMPA fit the gauge rainfall data better than near-real-time products because of the gauge-merging procedures [16,17].
In addition to the error evaluation, a number of correction methods for satellite rainfall have been developed, in which the satellite-gauge rainfall bias over grid cells with gauges was considered as critical information to derive the areal bias map by interpolation [18,19]. Some studies have indicated that the topography factors exert strange and complex controls on precipitation both globally and regionally [20,21], especially in the mountainous areas [22,23]. It was also found that the satellite-gauge difference varies with elevation [18,24,25]. Many approaches attempted to overcome this problem by deriving a linear regression model for correcting satellite rainfall with geographic/topographic information [26], or by stochastic model to adjust biases on rainfall frequency and intensity [27]. The linear rain-elevation relation was the common assumption [28,29].
However, the higher accuracy of satellite rainfall over gauged grid cells does not necessarily imply a higher accuracy over non-gauged grid cells; it could vary significantly with regions and seasons. For instance, the TMPA product tends to overestimate rainfall in areas with lower actual rainfall but underestimate it in areas with higher actual rainfall [30,31]. It is also shown that higher error occurs at a higher temporal resolution, in winter, and in mountainous areas [32,33]. Moreover, the relationship between topography and rainfall is regionally dependent and still remains unclear so far. The non-linear relationship has been increasingly recognized in the hydrological community [20,34].
Current studies of evaluation and correction of satellite precipitation products mainly focus on grid cells with gauge measurements. Few studies examine grid cells without gauges even though a majority of grid cells do not have gauge measurements because of the sparse gauge network, especially in mountainous areas. In practice, the post-real-time satellite rainfall products (such as TMPA 3B43) incorporated global gauge network data to remove bias, so that the grid cells with gauges may have a higher accuracy, whereas grid cells without gauges have not been bias-corrected but are considered to have the same level of accuracy as those grids with gauges. There is a large uncertainty and over-optimistic.
This study aimed to develop a comprehensive method to improve the current evaluation and correction methods for the satellite precipitation products. The methodology was described in details in Section 2 following the introduction. In addition, eight mountainous areas of China were selected for testing the effectiveness of the proposed methods taking TMPA (V7) as a case study in Section 3. The discussion focus on the suitability of the methods to other satellite precipitation products and in deferent time scales, which was put in the front of the section of Conclusion.

2. Methodology

2.1. The Gauge-Elevation-Consistency (GEC) Rule for Assessment

The consistency rule is a general principle in various researches and public management, such as hydrology stationarity assumption. The consistency rule in this study is defined as that the rainfall in a closer region should have the similar rainfall characteristics. The definition has two contents: (1) the satellite precipitation should have the same value as the ground gauged precipitation in the same grid cells as ground gauges in; (2) the satellite precipitation should have the similar value as the ground gauged precipitation in the grid cells closer to the ground gauges.
The mathematical expression of the consistency rule in this study is expressed as follows.
Δ P = P g P s 0 ,     L s = L g
Δ P = P u P s 0 ,     L s = L u
P g = P u ,     L g L u < D
where, P means the rainfall and L means the location of the gauges or satellite grid cells. The subscript s stands for gauge station, while g and u represent the satellite grids with gauges (gauged gird cells) and without gauges (ungauged grid cells). D is a close region (see detail expression below).
The Equation (1) is the first content of the definition, which has been used numerously in comparing the difference between satellite precipitation and ground precipitation. The Equation (2) is the second content of the definition, which just extends the Equation (1) from the grid cells with gauges to the cells without gauges. The Equation (3) is the bridge of ground gauges, gauged and ungauged satellite cells. The Equation (3) has also been used frequently, like the Thiessen polygon for areal rainfall interpolation.
The closer region (i.e., closer grid cells) in this study is the areas which have the same elevation, the same slope aspect, and similar location as the ground gauges. The same elevation refers to the relationship of rainfall and altitude; the same slope aspect refers to relationship of rainfall and vapor sources direction; the closer location is to limit the ungauged grid cells in a tolerant distance from gauged grid cells. In the tolerant range, all ungauged grid cells’ ground precipitation is the same as the closest gauge’s precipitation. Taken the definition above, the error assessment of satellite precipitation can be expanded from grid cells with gauge to grid cells without gauge.
For grid cells with gauge measurements, the corresponding grid values of the satellite rainfall are compared with ground measured precipitation according to the Equation (1). The assessment can be quantitatively expressed by the statistic parameters of Mean Bias and Root Mean Square Deviation as follows.
Bias =  i = 1 M ( P S i P G i ) i = 1 M P G i × 100 %
R M S D  =  1 M i = 1 M ( P S i P G i ) 2
where i is the gauged grid cell rank number and M is the total number of ground gauges, PS is the satellite rainfall, PG is the ground gauge measurement.
For grid cells without gauge measurements, the corresponding grid values of the satellite rainfall will be compared with the ground measured rainfall according to Equations (2) and (3). The assessment is quantitatively expressed by a newly proposed statistic criterion, Consistency Rate (CR), as follow.
c o u n t j = { 1 ,    if   P S j D   0 ,    if   P S j D    
n = j = 1 N c o u n t j
CR = n N × 100 %
where j is the ungauged grid cell rank number. D is the Rainfall-Elevation Mask (REM) for qualification the ungauged cells precipitation, i.e., the exact closer region in Equation (3). n is the number of satellite ungauged grid cells within the REM having comparable rainfall as gauges, and N is the total number of ungauged grid cells.
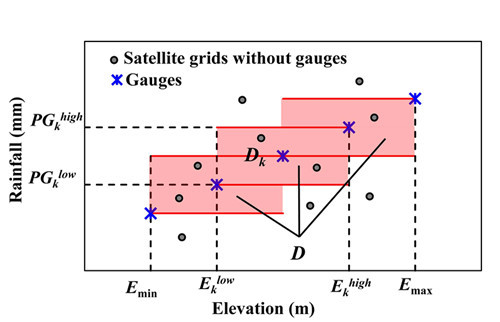
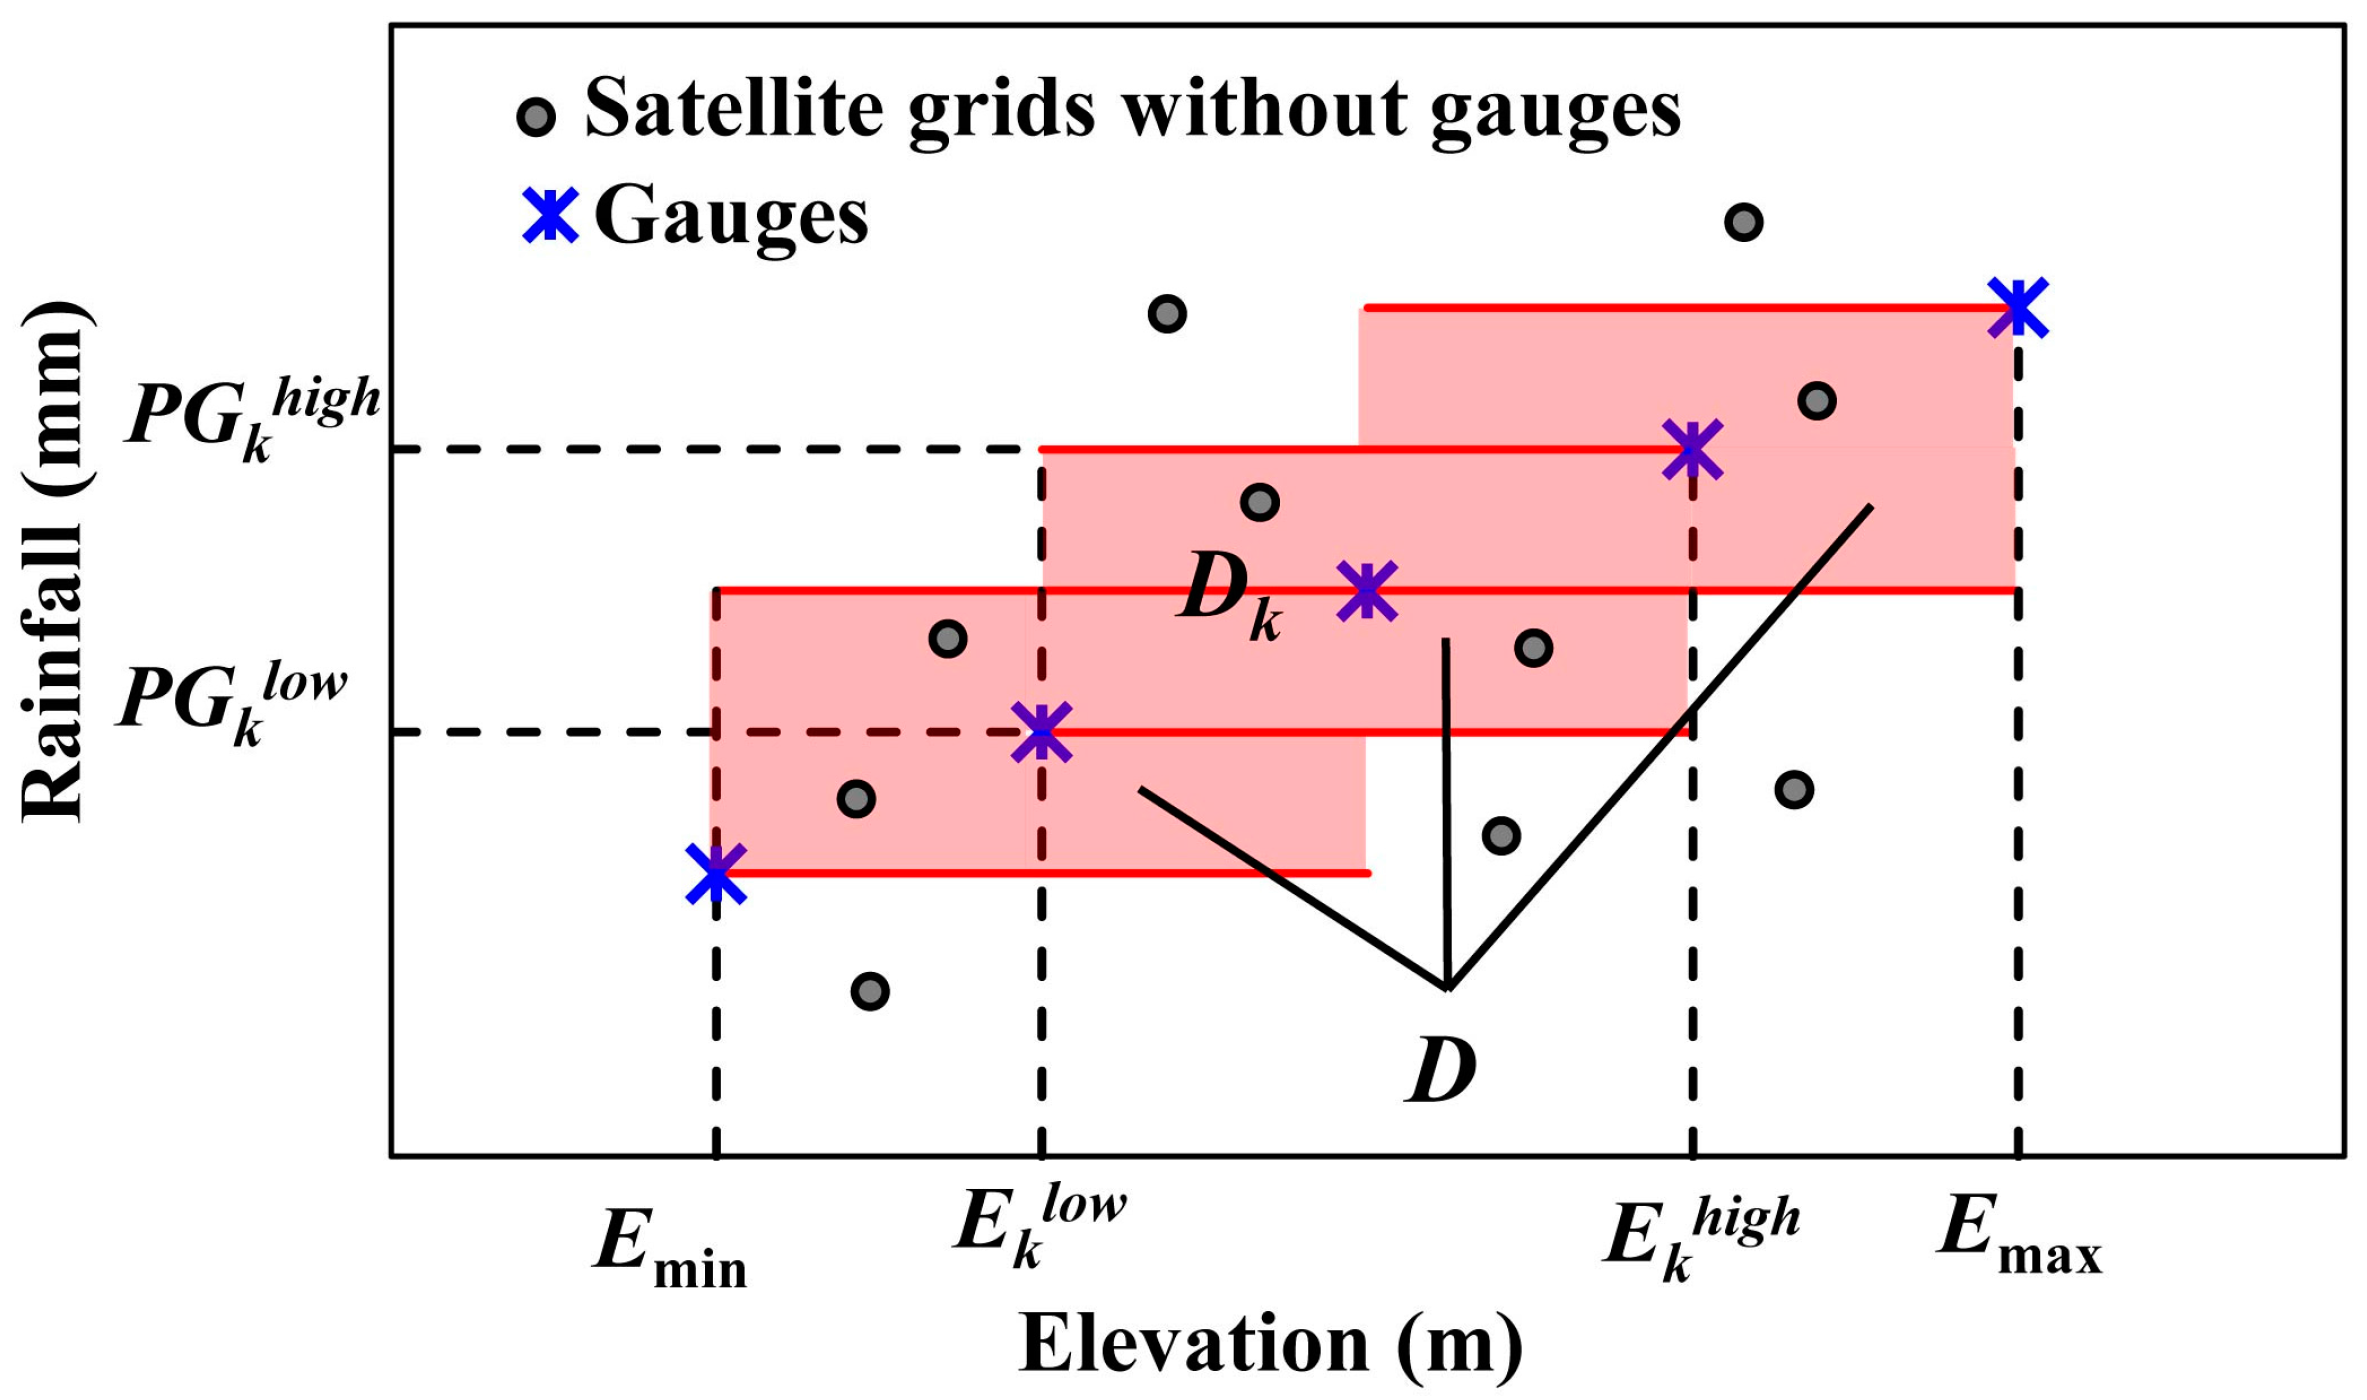
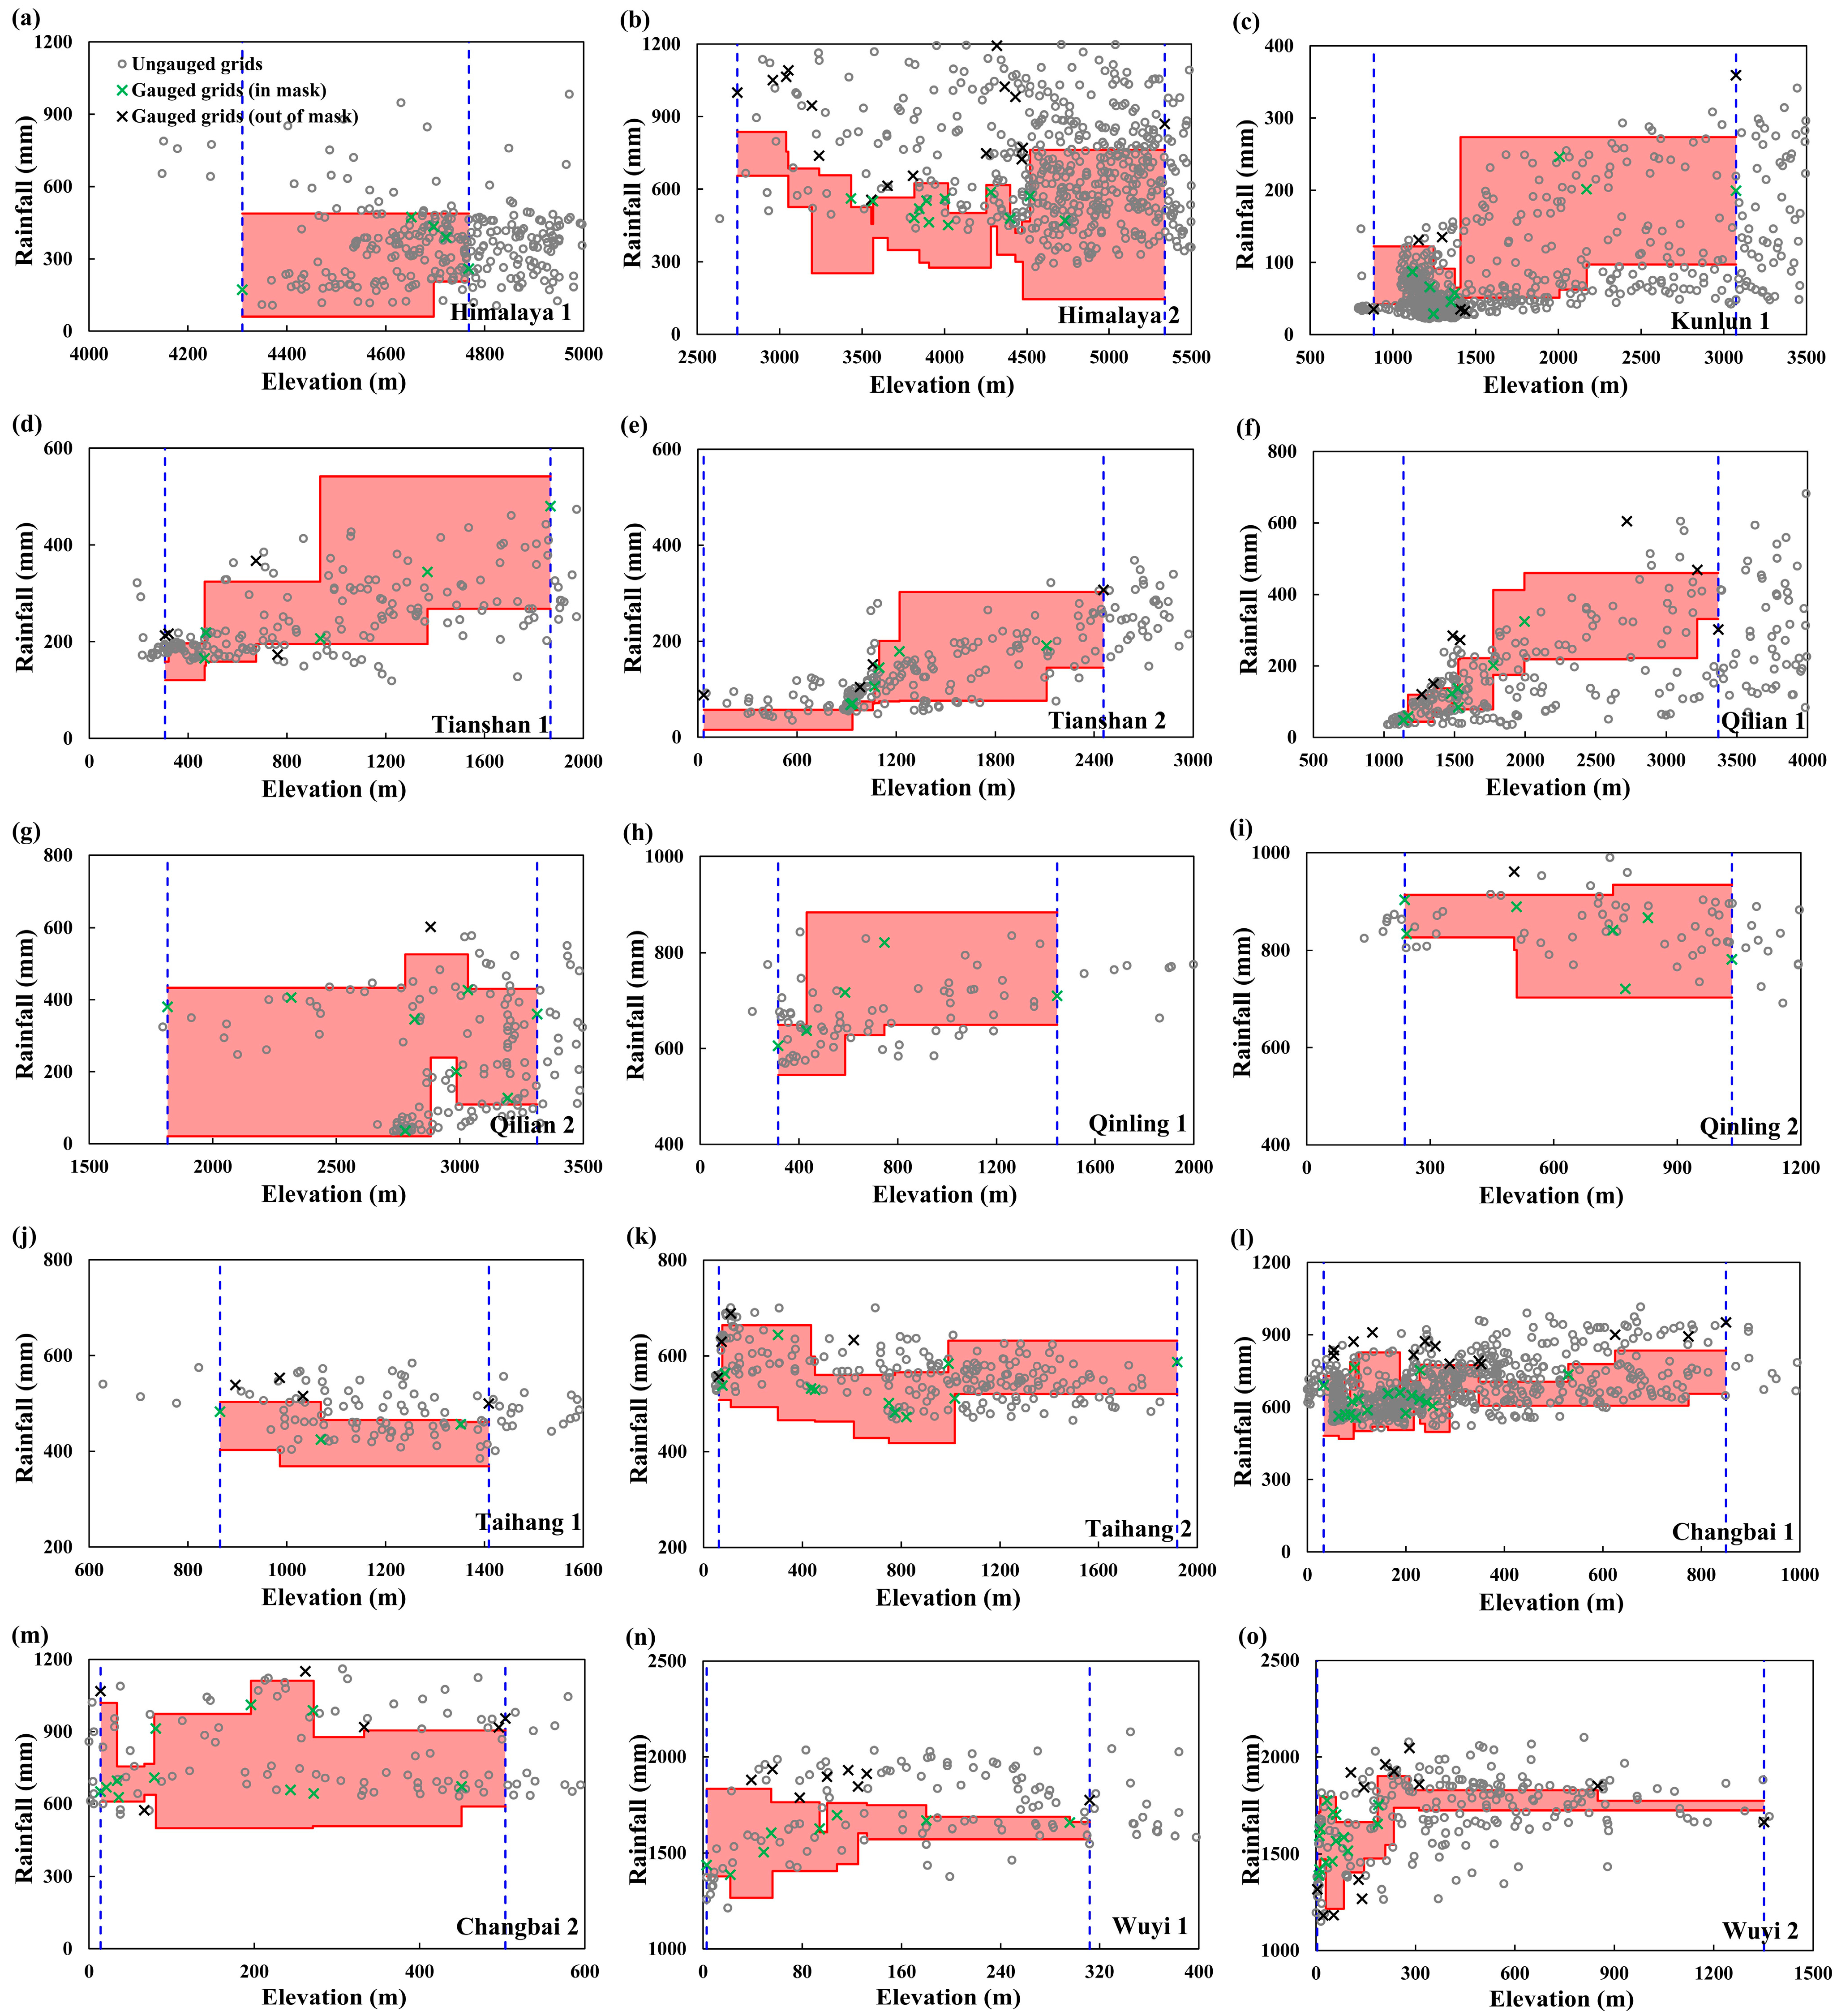
The REM can be derived based on the rainfall measurement and elevation of the gauges. Assuming there are M (M ≥ 2) ground rainfall gauges in the same slope of a mountain. Sort the M gauges in ascending (or descending) order of elevation. Set every l (l = 2, …, M) sequential gauges as a group Gk (k = 1, …, Ml + 1). For each Gk, there are a lowest and highest elevation ( E k l o w , E k h i g h ), as well as a minimum and maximum gauge rainfall ( P G k l o w , P G k h i g h ). The rectangle space of ( E k l o w , P G k l o w ; E k h i g h , P G k h i g h ) forms a closer region, Dk. All the closer regions consist of the whole rainfall-elevation mask D. The mask physically denotes the possible or reasonable rainfall range for each elevation. Figure 1 shows an example of deriving the rainfall-elevation mask (l = 3, M = 5).
Figure 1. The derivation of rainfall-elevation mask (l = 3, M = 5). The red solid lines are the up and low limit of rainfall and the black dashed lines are the up and low limit of elevation of each sub-mask. The whole pink region is the final rainfall-elevation mask (REM).
Atmosphere 06 00983 g001
A larger CR means that a larger proportion of satellite grid cells have comparable rainfall as gauge measurements within the same elevation range. In other words, satellite precipitation tends to have higher accuracy. Therefore, the CR value can quantifiably measure the consistency between the gauge and satellite rainfall over grid cells without gauges.

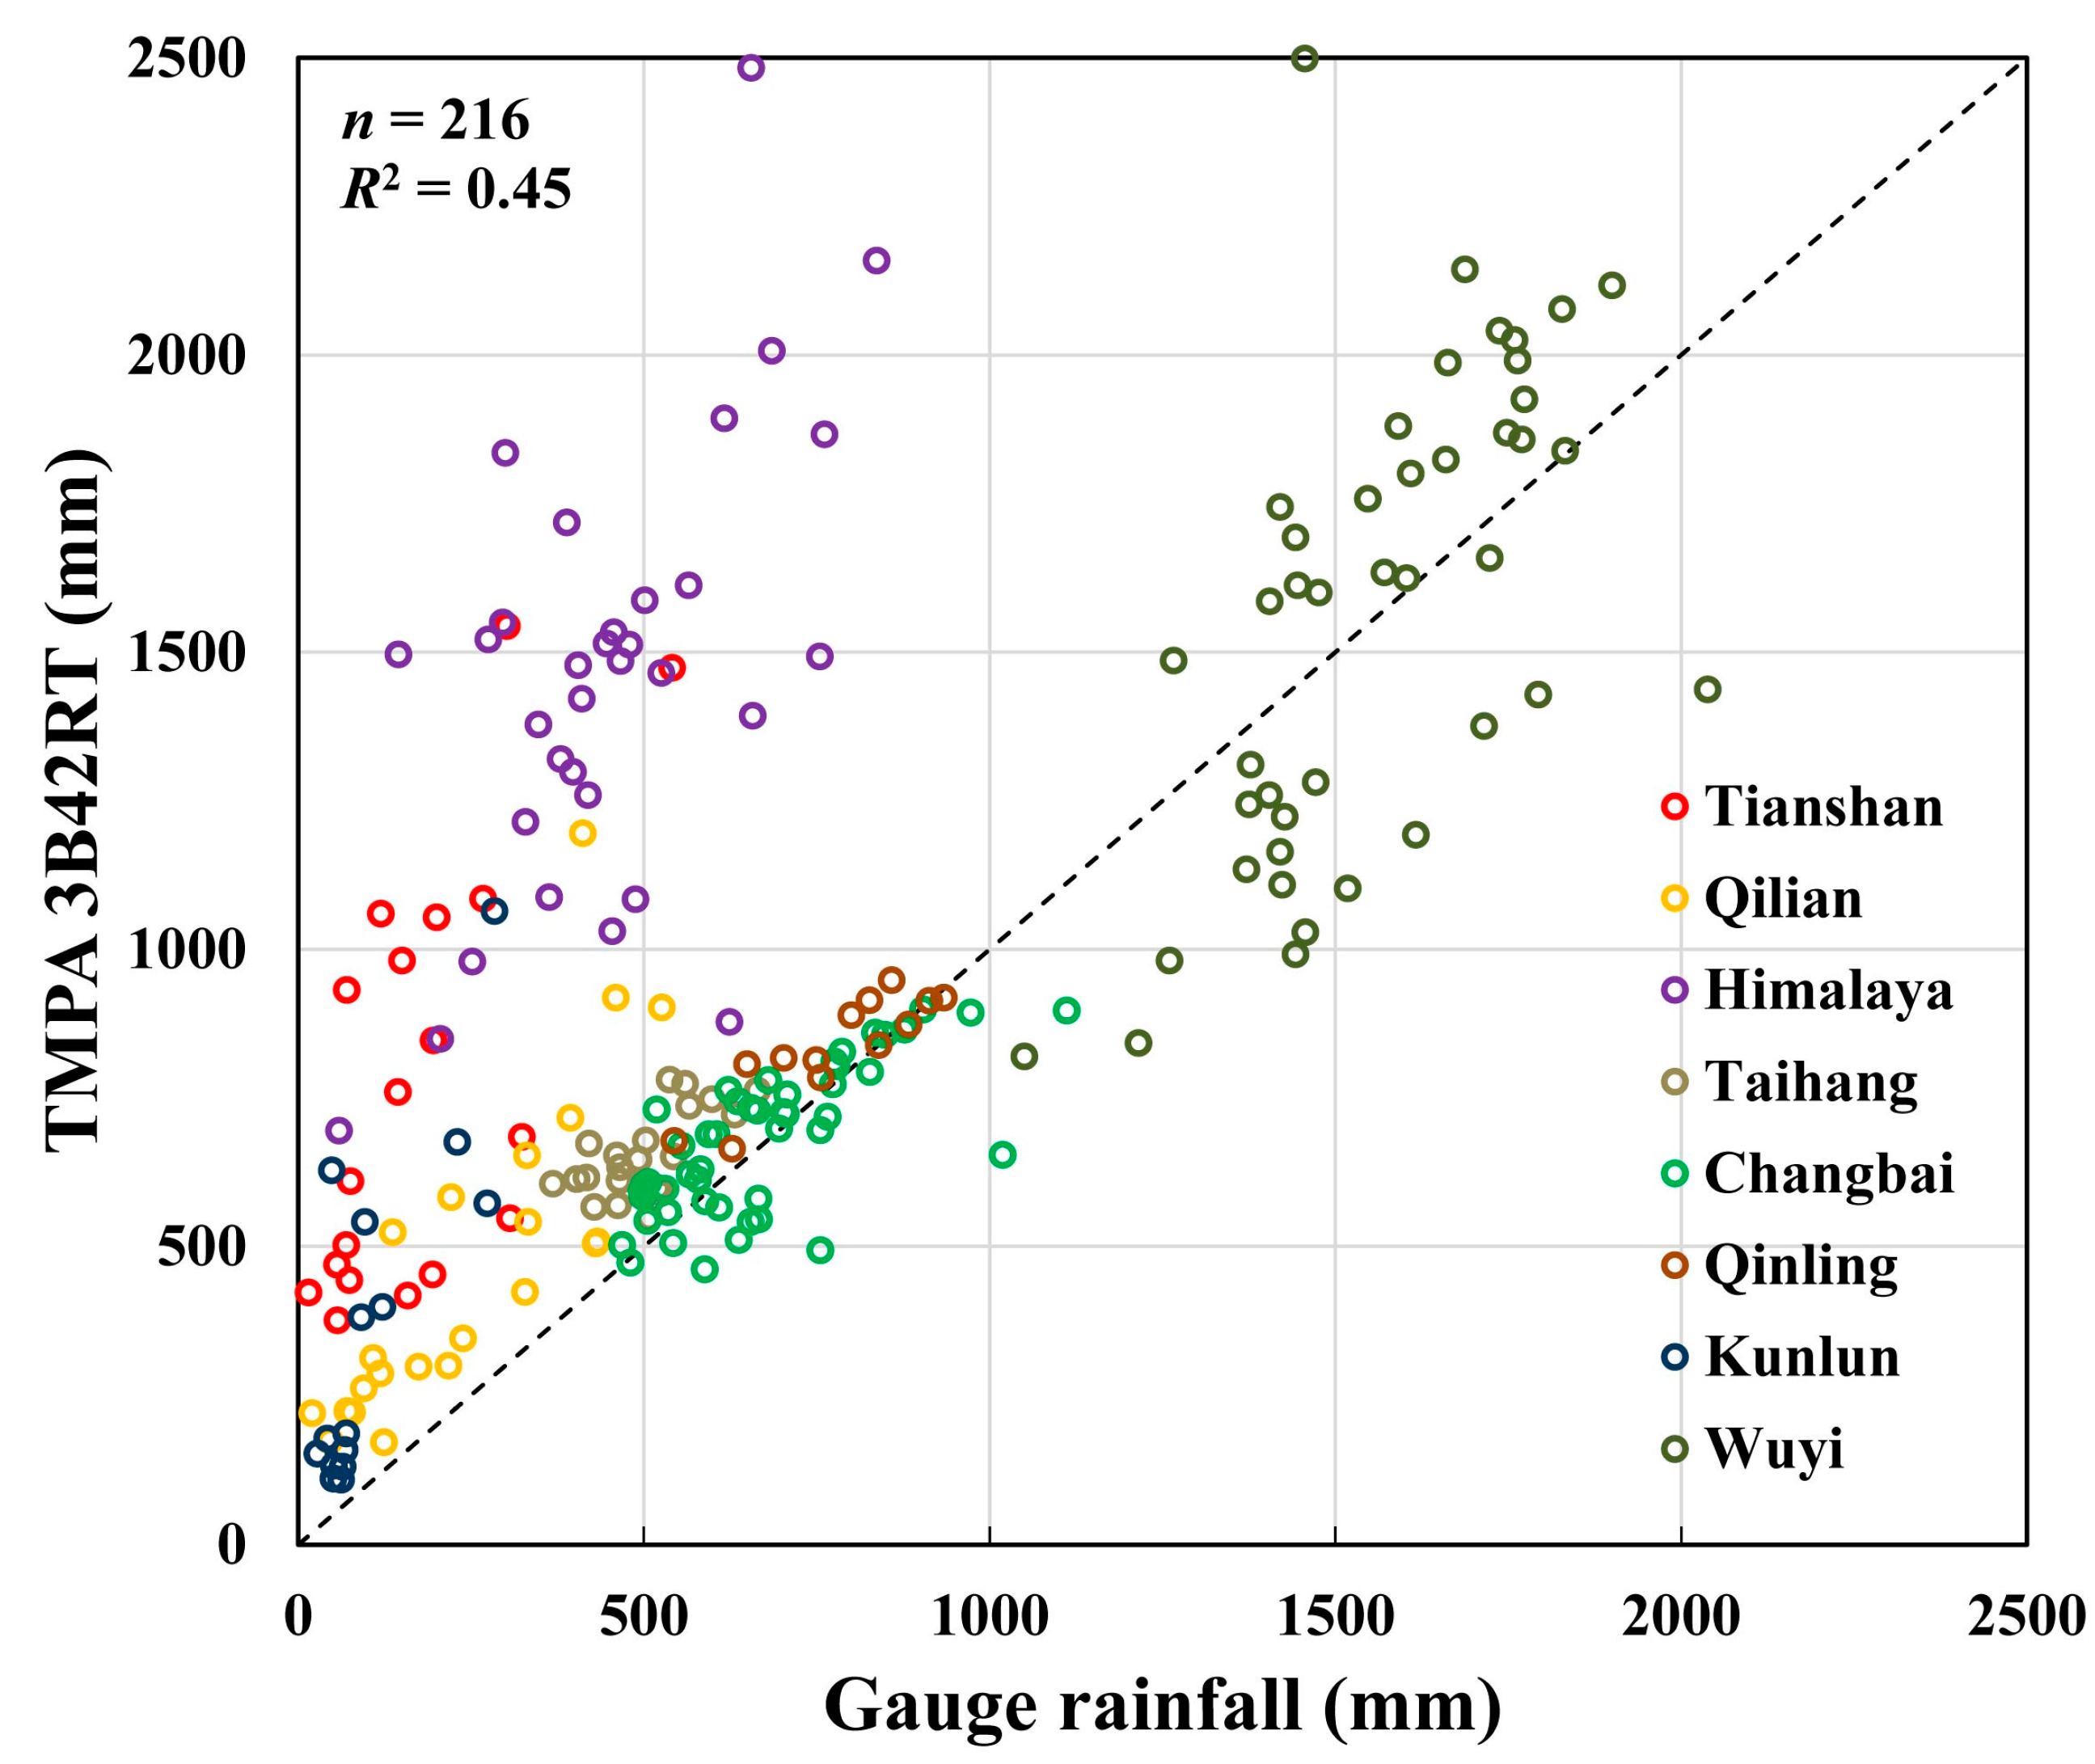
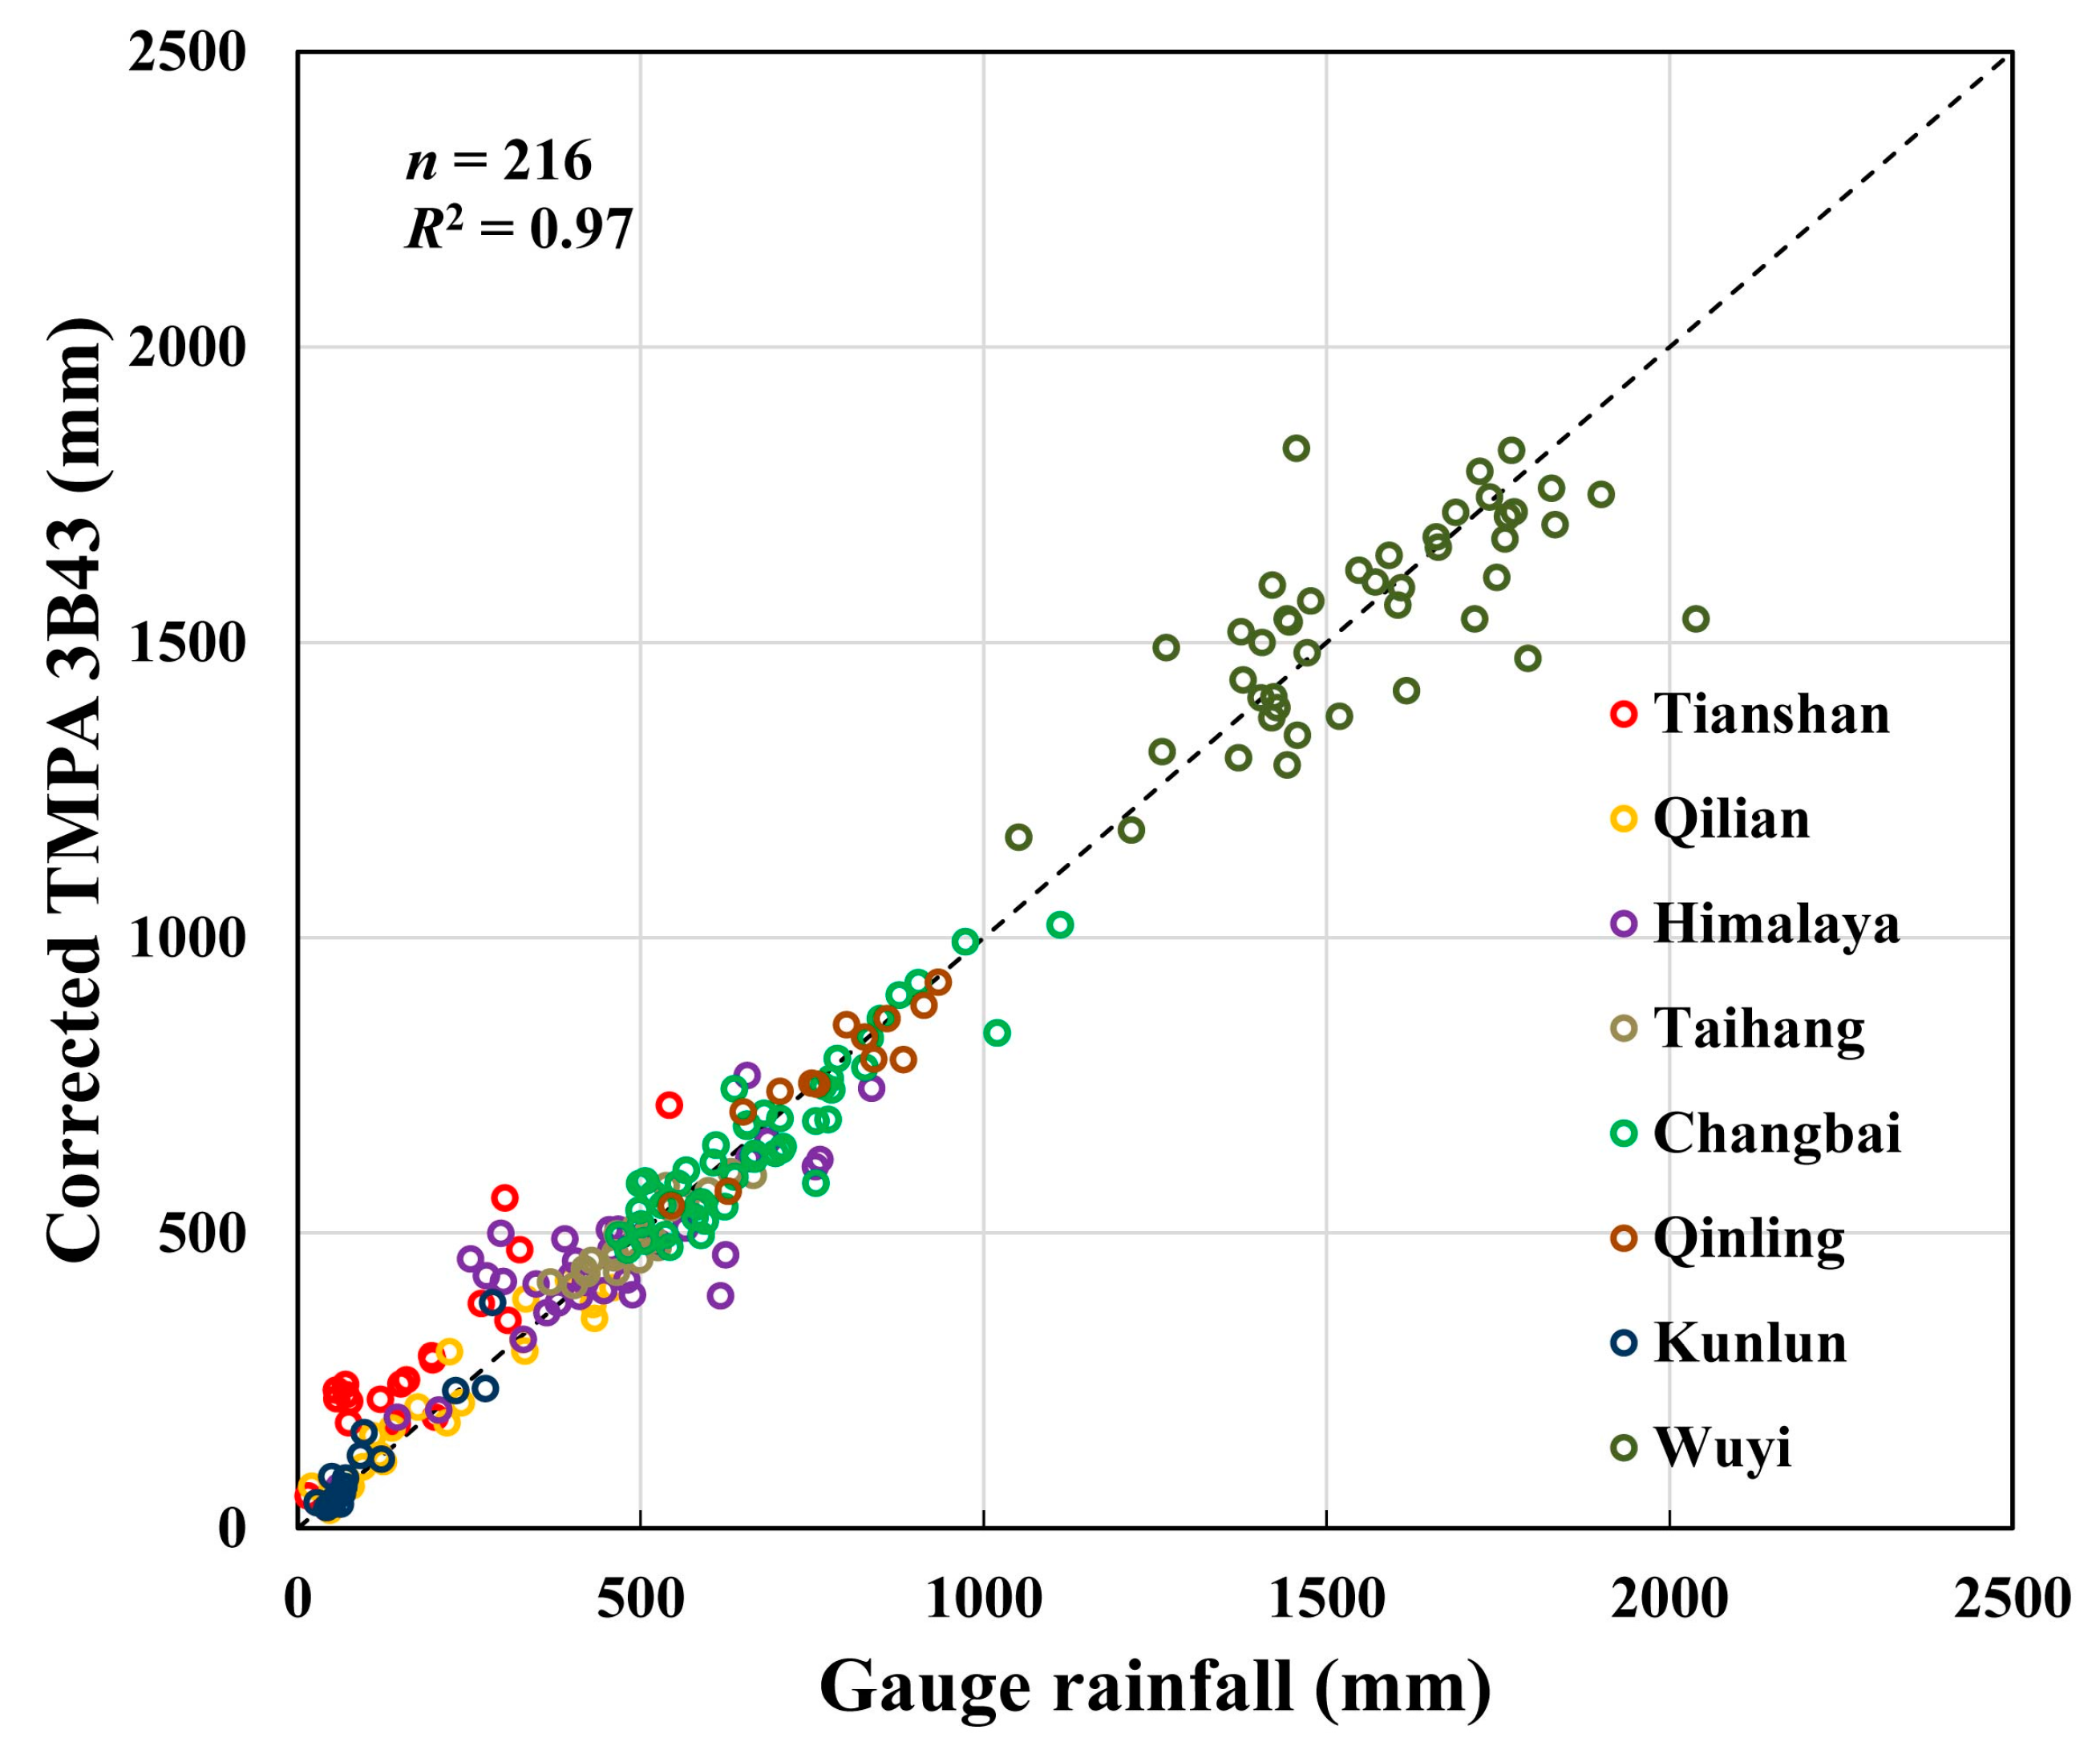
2.2. The Location-Elevation-TMPA (LET) Correlation for Improvement

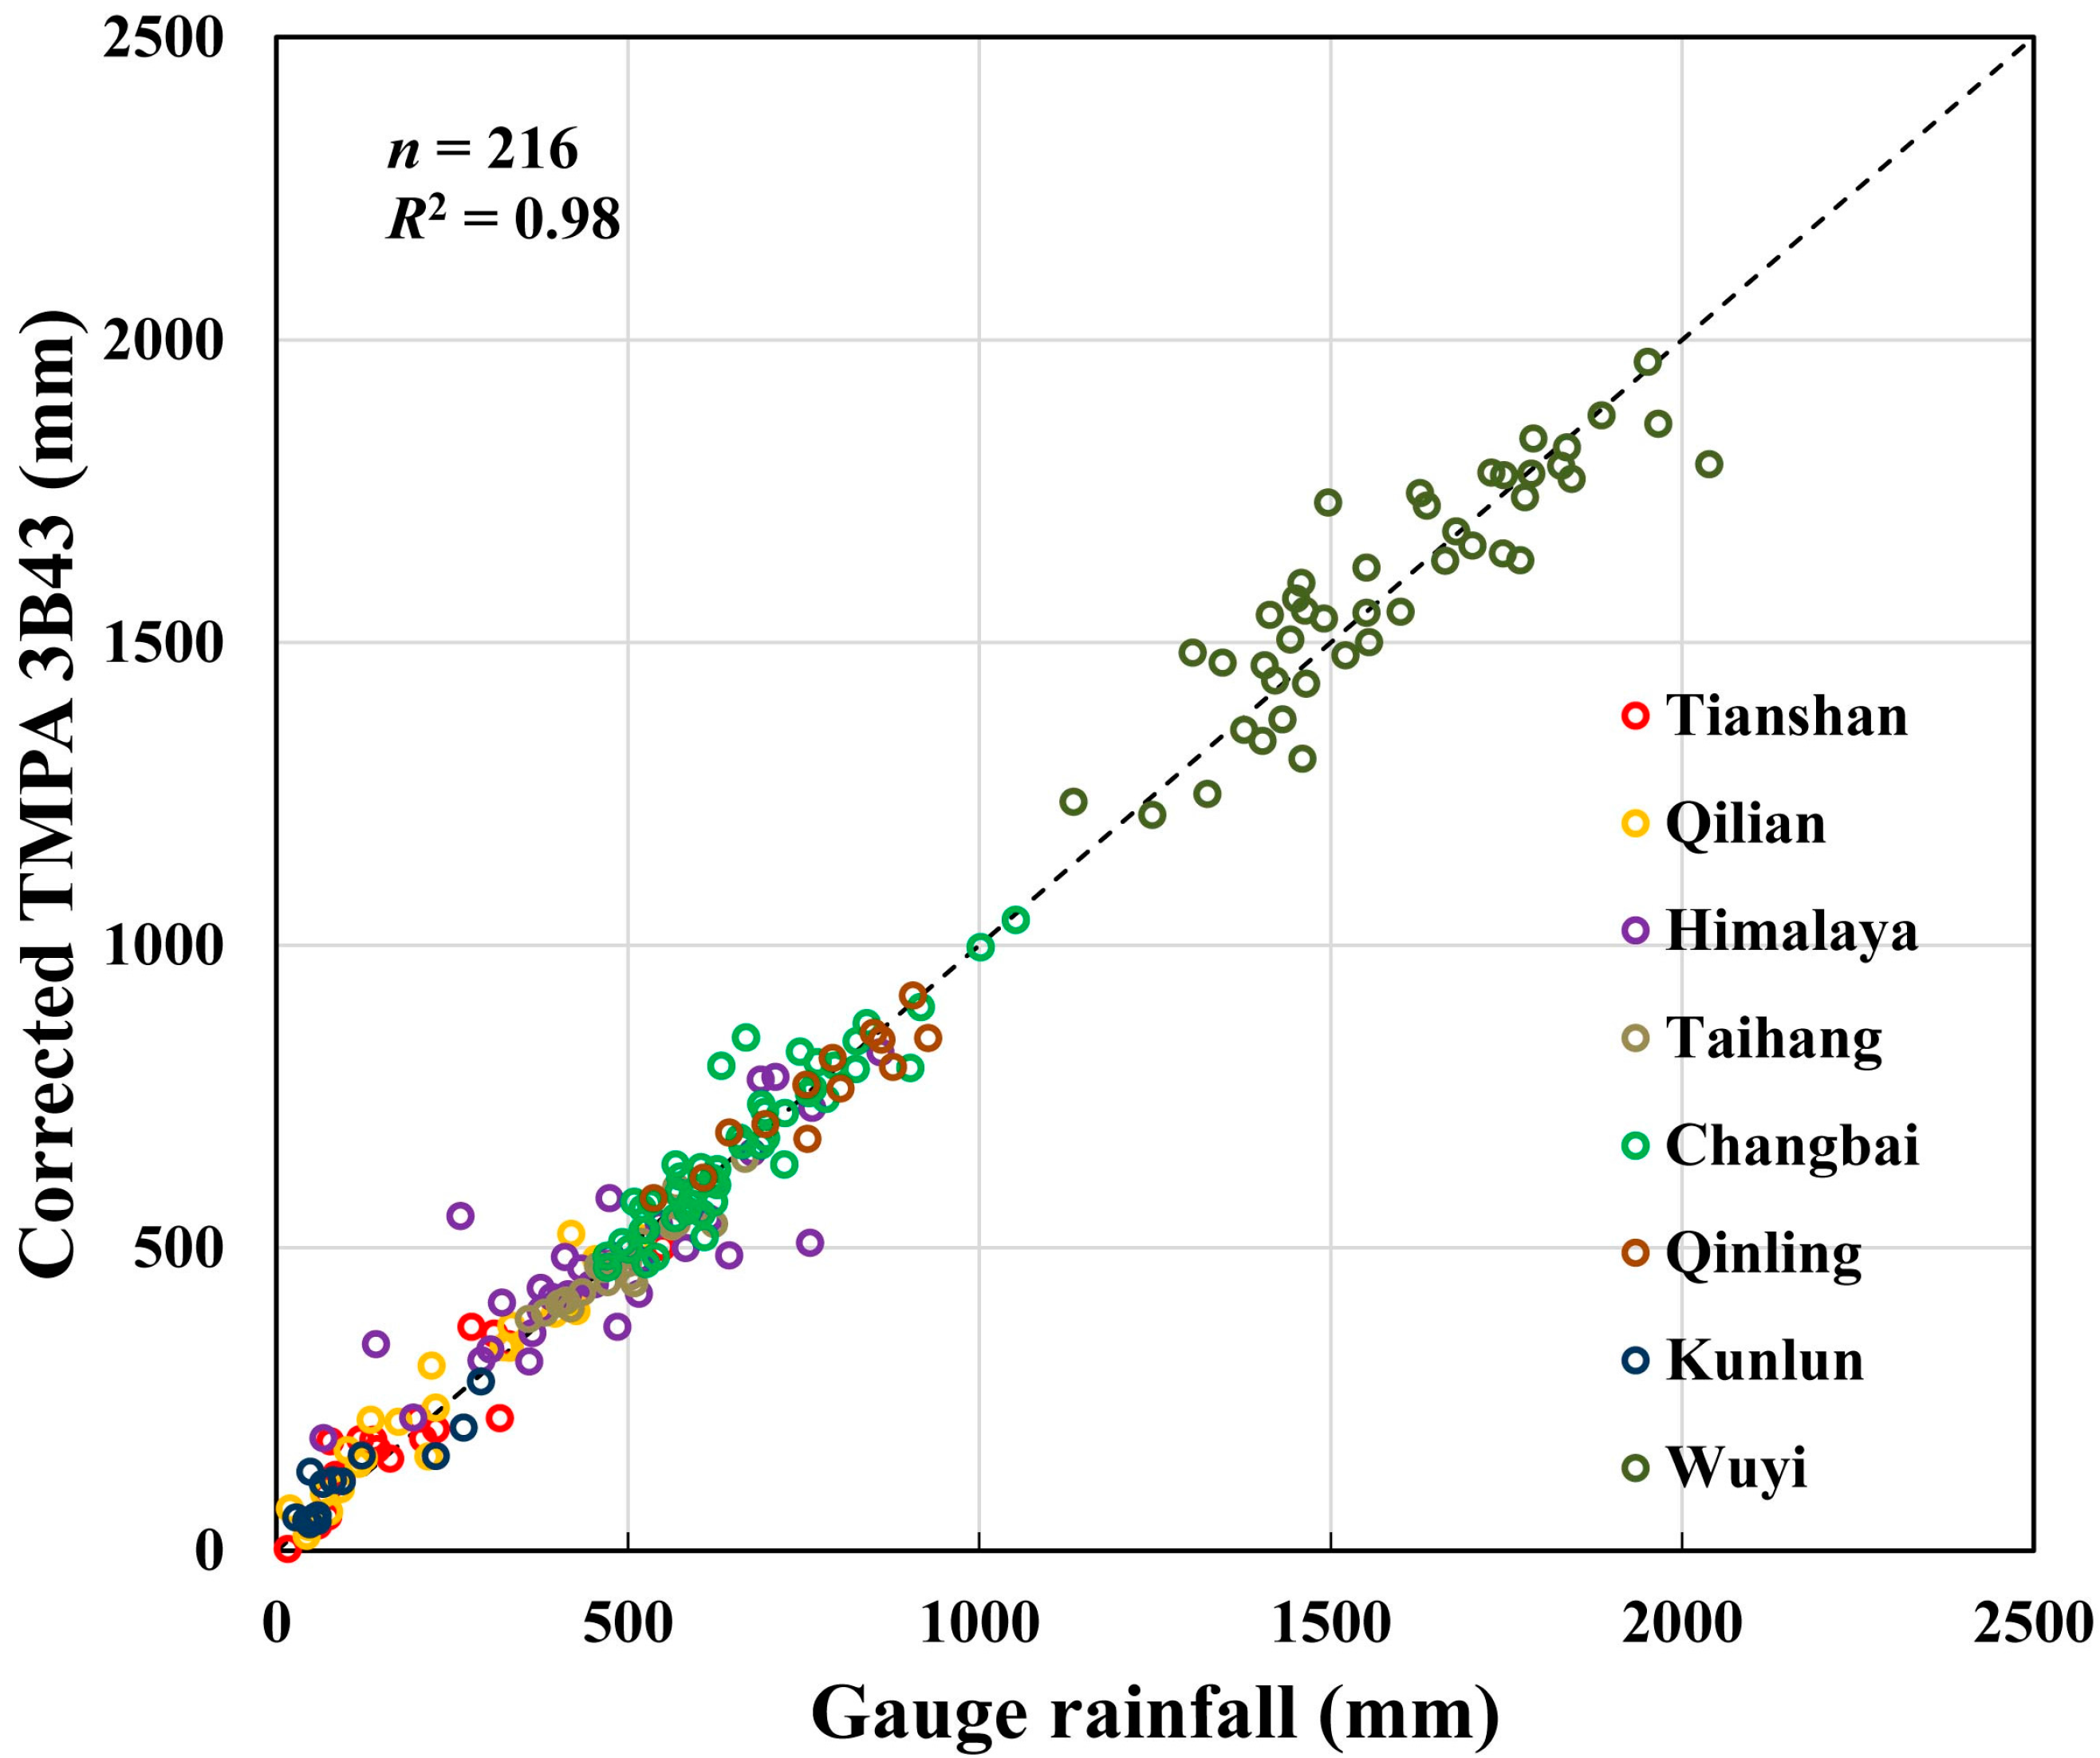
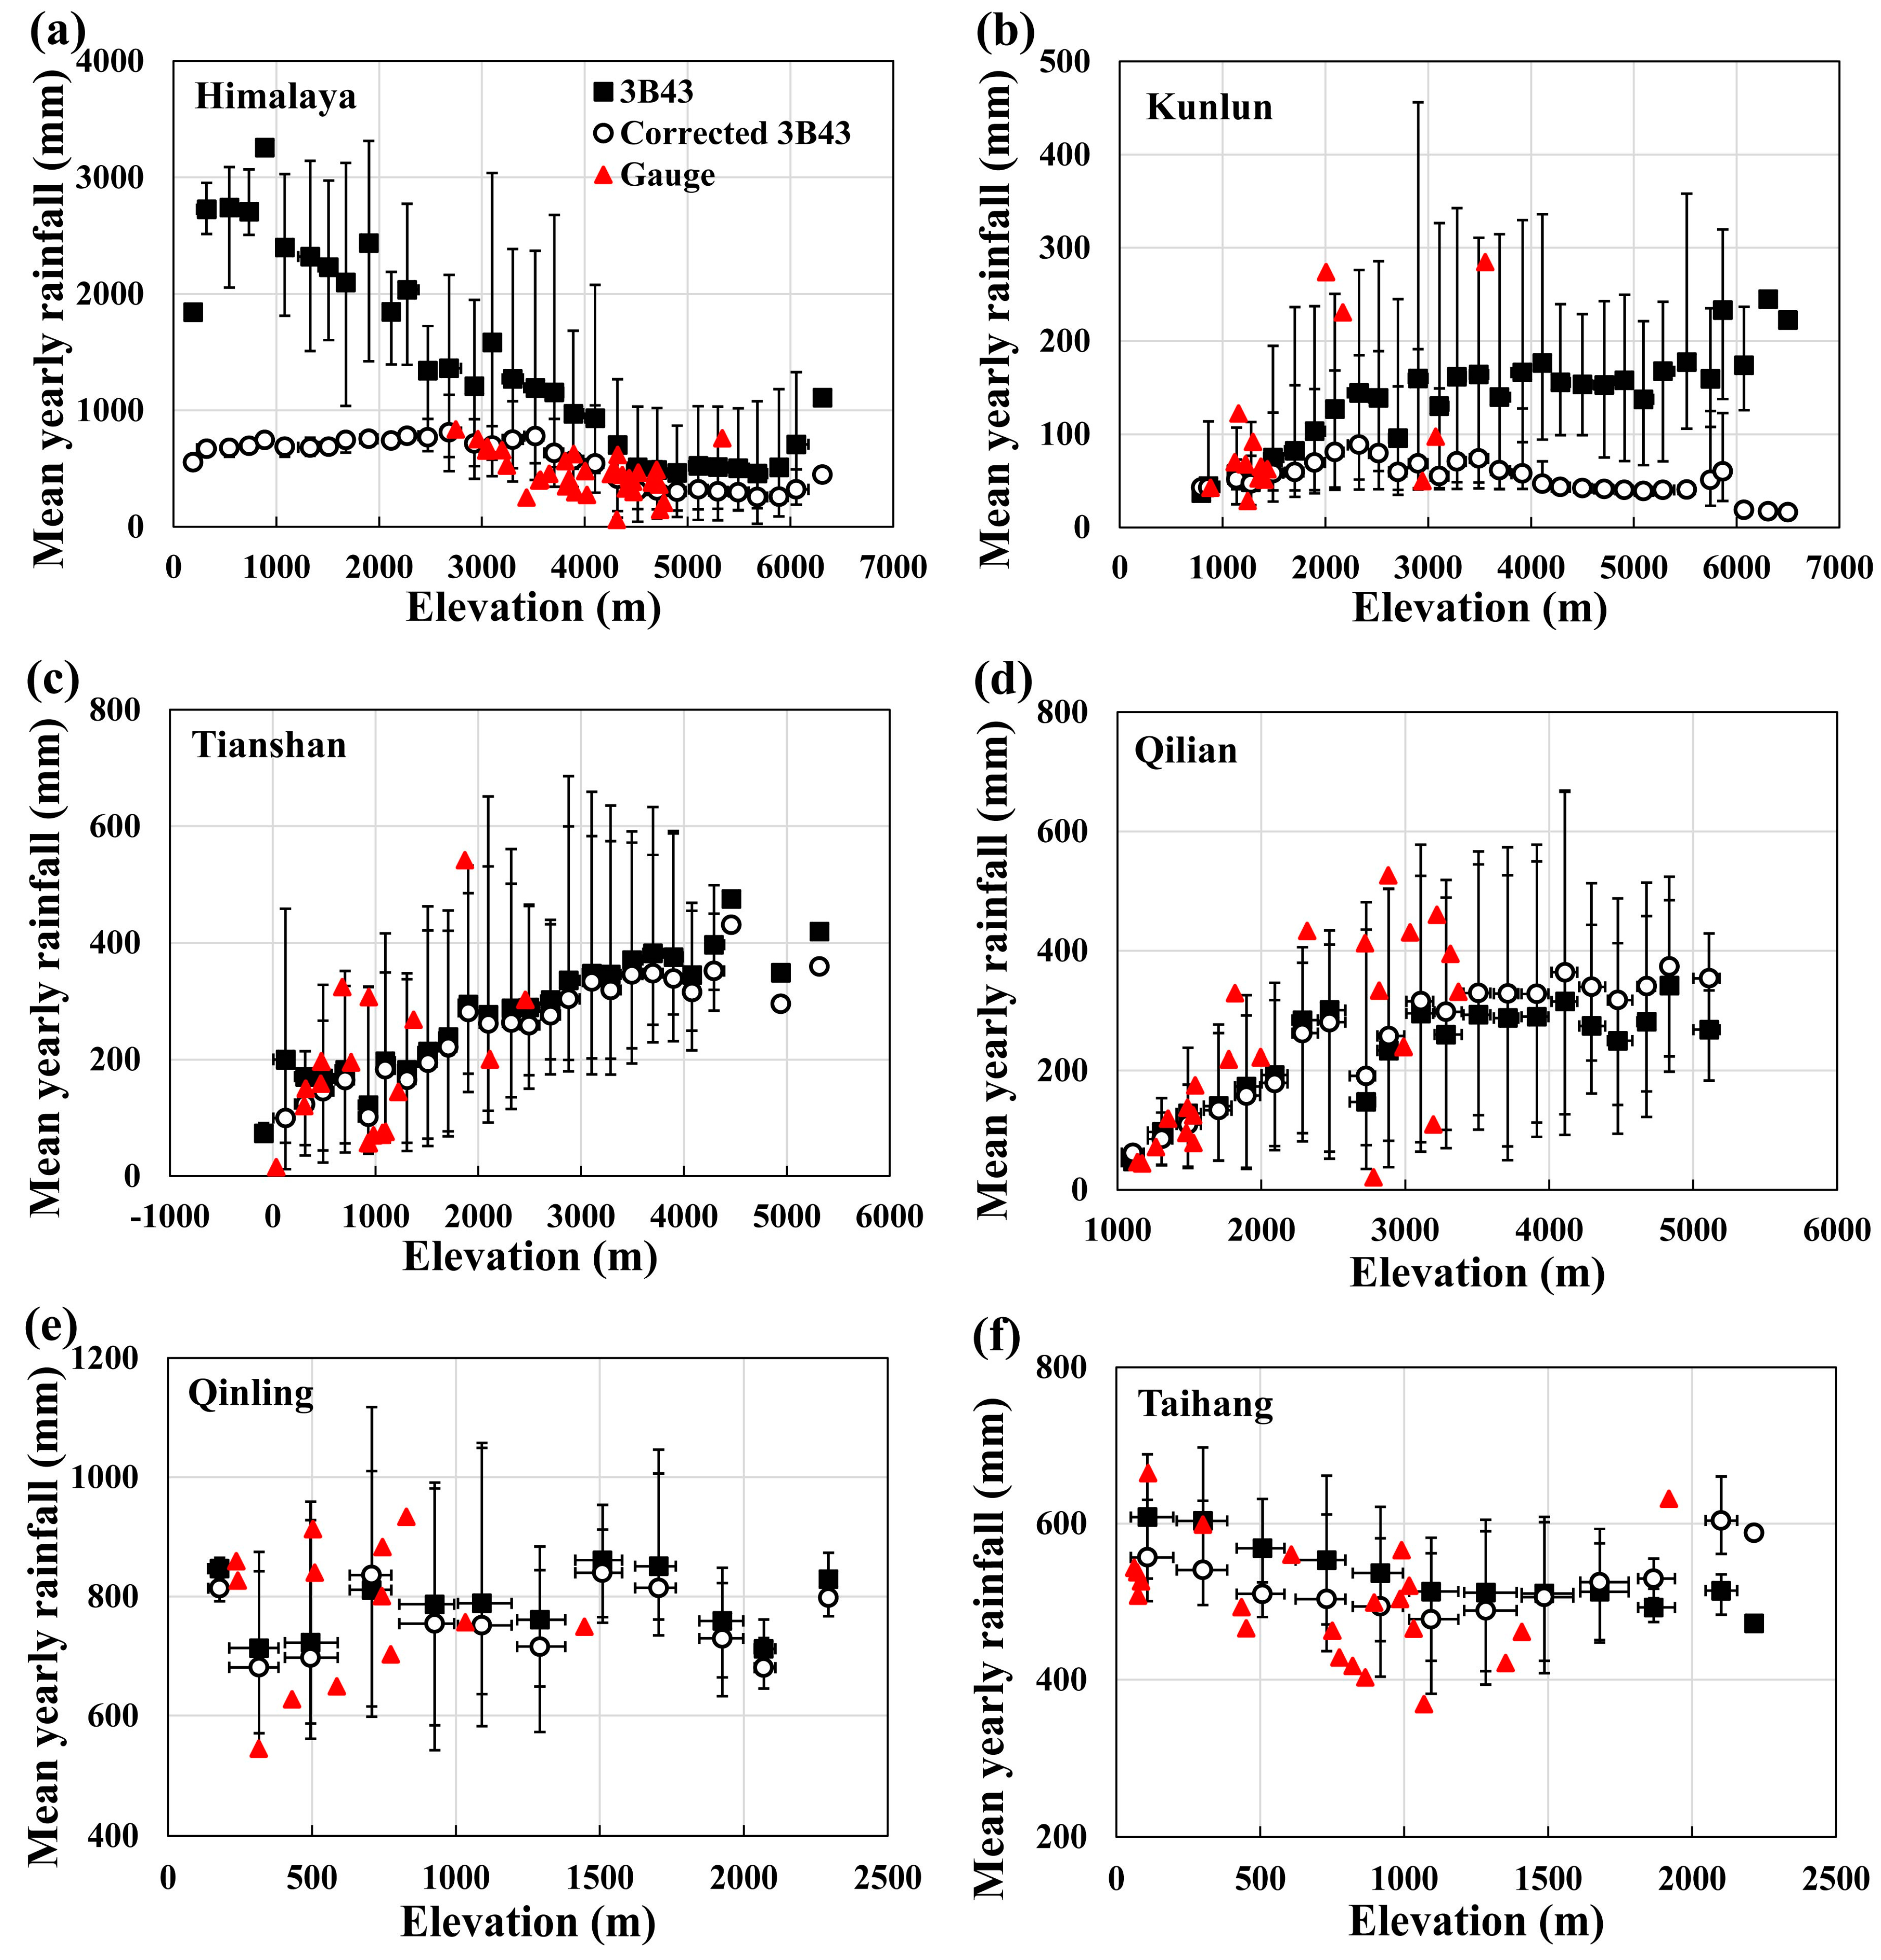
Considering the significant influence of topographic and geographical features on rainfall, topography and geography information is involved in improving the satellite rainfall in this study. The gauge data are assumed to be the actual rainfall values. For the grid cells with gauges, the relationships between the actual rainfall and topographic/geographic information as well as TMPA rainfall were investigated. Compared with the original TMPA rainfall, the final predicted rainfall incorporates topographic and geographic information. In other words, TMPA rainfall was corrected by the topographic and geographic information.
Given the unclear influence of topographic and geographic factors on rainfall, Genetic Programming (GP) was used as a tool to mine the relationship between rainfall and related factors. In the present study, the real rainfall (gauge measurements) was used as the target of GP, and the inputs include geographical location (north latitude and east longitude), elevation, and TMPA rainfall. The method is expressed below:
P A = f ( X , Y , E , P S )
where PA is the actual rainfall, X and Y are the locations (longitude and latitude, respectively), E is the elevation, and PS is the rainfall from TMPA. Elevation is considered as the main variable that influences the spatial distribution of precipitation in mountainous areas, geography information is regarded as the factor of regional and local climate patterns, and the TMPA data is involved to make full use of the satellite information.
There are three steps for mining the robust and explicit formula of Equation (9).
Step (1), testing calibration. Exclude part of ground gauges and then put the remaining gauges into the mining dataset together with the same grid cells of satellite for data mining. The information of the dataset includes location of the gauges, elevation and satellite precipitation in the same location as gauges. The problem of GP is as follows.
Min  R 2 = ( M i = 1 M ( P G i P A i ) i = 1 M P G i i = 1 M P A i ) 2 / [ M i = 1 M P G i 2 ( i = 1 M P G i ) 2 ] [ M i = 1 M P A i 2 ( i = 1 M P A i ) 2 ] Min  C V ( R M S D ) = R M S D P G ¯ × 100 % =  M i = 1 M P G i ( P G i P A i ) 2 M × 100 %
where R2 is the coefficient of correlation between gauge measurements (PG) and modeled actual rainfall (PA). CV(RMSD) is coefficient of variation of the RMSD, which is calculated by normalizing RMSD by the mean value of the measurements. The target of the GP problem is to minimize the R2 and CV(RMSD) between actual rainfall from Equation (9) and gauge measurements.
Step (2), cross-validation. Predict the satellite precipitation in the grid cells excluded gauges located by the mined explicit formula of Equation (9) and assess the fitness of the mined explicit formula.
Repeat step (1) and (2) until all the gauges are included and excluded at least once to validate the effectiveness of LET method.
Step (3), final calibration. If the cross-validation process indicates that LET is valid, put all gauges into mining dataset together with the same grid cells of satellite for data mining. The mind formula is the final explicit Equation (9), which can be used to predict and adjust satellite precipitation in the grid cells both with and without ground gauges.

3. Case Study and Results

3.1. Data

The data used in this paper are mainly the satellite precipitation products and ground gauges precipitation. The study area was focused on the eight mountainous areas of China, including Himalaya (the part in China), Kunlun, Tianshan (the part in China), Qilian, Qinling, Taihang, Changbai, and Wuyi. The location and basic information were shown in Figure 2 and Table 1.
The Himalaya, Kunlun and Qilian are located in the Qinghai–Tibetan High Plateau. The Himalaya tops at 8848 m and blocks the wet monsoon winds from south, drier and colder winds from the north [22]. Kunlun tops at 7576 m controlled by the Westerlies in summer and Mongolian–Siberian High in winter with a cold and arid climate [35]. Qilian has the peak of 5820 m and the climate varies from arid to semiarid with large temporal–spatial precipitation difference [36]. Tianshan is also located in the west of China and is kept away from the moisture, resulting in an arid continental climate [37]. Taihang and Qinling are located in the central part of mainland of China with the peak of 3059 m and 3747 m respectively. The Taihang serves as an important geographical boundary with the Loess Plateau to its west and the North Plain to its east [38]. The Qinling acts as a significant climate boundary in China, blocking cold, dry airflow from the north in winter and humid, warm airflow from the south in summer [39]. Influenced by the East Asian summer monsoon, Taihang and Qinling have the typical continental monsoon climate with wet summers and dry winters. Changbai and Wuyi are located in northeast and southeast of China, respectively, with relatively low altitude. The Changbai stretches along the boundary between China and North Korea and has a temperate continental climate with long cold winter and short summer [40]. Located in southeast China near the sea, the Wuyi has a warm, humid subtropical climate characterized as monsoon patterns. The hot season (April to September) has the greatest precipitation brought by summer monsoon and typhoons [41].
Figure 2. The location of the studied mountainous areas of China. The red lines are the boundaries of the mountainous areas, and the blue dots are the gauge stations.
Atmosphere 06 00983 g002
Table 1. Basic information for the studied mountainous areas.
RegionArea (103 km2)Mean Elevation a(m)Peak Elevation (m)Gauges Information
Gauges NumbersGauges Altitudes (m)Mean Annual Rainfall (2001–2012) (mm)
Himalaya1054.745928848332328–4900467
Kunlun786.72897757615887–3504102
Tianshan392.2171271251935–2458180
Qilian337.629545820231139–3367230
Qinling129.5921374713249–2065770
Taihang223.2101230592263–2208498
Changbai631.93342667484–775663
Wuyi366.23862154433–16541589
a The elevation is from the DEM of the Shuttle Radar Topography Mission with a spatial resolution of 90 m.
The satellite precipitation (2001–2012) comes from the last version (V7) of TMPA 3B43, which was adjusted by global gauge dataset and provides monthly precipitation with the spatial resolution of 0.25° and global coverage of 50°S–50°N data for research (http://mirador.gsfc.nasa.gov). The ground gauge precipitation (2001–2012) comes from the last version of China Daily Ground Climate Dataset, which was produced by National Meteorological Information Center of China (NMIC) and provides daily precipitation (http://cdc.cma.gov.cn/home.do). This dataset has been applied in numerous studies as an actual rainfall reference [30,42,43]. The publicly available NMIC dataset comprises daily climate observations from 824 meteorological stations covering almost the entire China. This research used 216 stations within the eight mountainous regions (see Figure 2). Following other researches [18,44], the precipitation is converted into the mean annual data (average of 2001–2012) in each grid cells of satellite and each gauge of ground measurement. The monthly 3B43 rainfall and near-real-time 3-h 3B42RT rainfall were also discussed in Section 4.
The digital elevation model (DEM) comes from the Geological Survey Earth Resources Observation and Science Center (http://eros.usgs.gov/) of the United States. The original spatial resolution of the DEM data over China is 90 m.

3.2. Assessment the Uncertainty of Satellite Precipitation

3.2.1. Grid Cells with Gauges

For grid cells with gauge measurements, the mean annual rainfall (2001–2012) from TMPA 3B43 (V7) was compared with that from the gauge stations over the eight mountainous regions, as shown in Table 2 and Figure 3.
Table 2. Comparison of mean annual rainfall (2001–2012) from gauge measurements and the original 3B43.
RegionAltitude of Gauges (m)Gauge (mm)3B43 (mm)Bias (%)RMSD (mm)
Higher MountainsHimalaya2328–490045366747.2272
Kunlun887–350410613123.676
Tianshan35–245817520014.354
Qilian1139–336723326413.365
Lower MountainsQinling249–20657767911.946
Taihang63–22085025428.049
Changbai4–77567475712.3103
Wuyi3–1654156016546.0161
Average--56062615.8103
It shows that the 3B43 products tended to overestimate rainfall by 15.8% on mean annual scale. In the higher mountains with peaks above 5800 m, including Himalaya, Kunlun, Tianshan and Qilian, the mean overestimation bias is 24.5% in the altitude from 35 m to 4900 m on gauged grid cells. In the other mountains with peaks lower than 3800 m, including Qinling, Taihang, Changbai and Wuyi, the mean overestimation bias is only 7.0% in the altitude from 3 m to 2208 m on gauged grid cells.
The result presented in the study is mostly consistent with previous reports, such as the study in east and northeast China during the period between 2005 and 2007 [30], in Gangjiang river basin originated from Wuyi Mountains [15], in Jinghe river basin originated from Qinling Mountains [45]. However, it varied in the Himalaya Mountains in literatures, both underestimation in Nepal and Pakistan [14,27] and significant overestimation over the Tibetan Plateau [26,46] was reported.
Figure 3. Validation of the mean annual rainfall (2001–2012) from gauge measurements and the original 3B43.
Atmosphere 06 00983 g003
Despite the merging of the global gauge network, TMPA 3B43 (V7) still shows a noteworthy error in most mountainous areas over China, especially in the higher mountain areas.

3.2.2. Grid Cells without Gauges

In order to refer to the closer region for the grid cells without gauges, each mountain was divided into two regions along the hillsides according to the watershed and vapor transportation direction. The three connected gauges (l = 3) rainfall-elevation mask was derived hillside by hillside, as shown in Figure 4.
Taking the filter by mask D, the Consistency Rate (CR) can be calculated obviously. The CR of gauged grid cells was also calculated to make a comparison as well as to test the effectiveness of CR in evaluating the rainfall accuracy. The result is shown in Table 3. For grid cells with gauges, the CR showed an average of 57.9% in higher mountains (including Himalaya, Kunlun, Tianshan, and Qinling) and 66.9% in other mountains (including Qinling, Taihang, Changbai, and Wuyi). This result is consistent with that from traditional assessment in Table 2.
There is a significant difference between the CR values for gauged and ungauged grid cells, and the difference can reach up to 17% in Qinling. In some cases, such as in Qilian and Wuyi, the CR was relatively low for grid cells without gauges despite of the high CR for gauged grid cells. Thus, satellite rainfall accuracy in grid cells with gauges might fail to represent the accuracy of grid cells without gauges.
Figure 4. The mean annual (2001–2012) rainfall-elevation mask and rainfall filter (the pink space, l = 3). The green/black forks stand for TMPA rainfall grid cells with gauges located in/out of the masks. The grey circles are the cells without gauges. Kunlun has only one mask because of lacking of enough gauges on another hillside. (a,b) Himalaya, (c) Kunlun, (d,e) Tianshan, (f,g) Qilian, (h,i) Qinling, (j,k) Taihang, (l,m) Changbai, (n,o) Wuyi.
Atmosphere 06 00983 g004
A common issue in the current evaluation is the mismatch in spatial scale between the satellite rainfall (always 0.25° × 0.25° grid) and the gauge measurements (point scale). Before the potential improvement of the spatial resolution of satellite rainfall products, some endeavors for the mismatch issue were attempted by averaging the gauge rainfall within the satellite grid cells [47], or obtaining grid gauge rainfall by an interpolation technique [15] if a denser gauge network is available. Given the sparse available gauges, the corresponding grid cell values were separately extracted for comparison with gauge data over grid cells with gauges, which was the common method to conduct accurate evaluations [17].
Table 3. Consistency rate (%) of mean annual rainfall (2001–2012) of the original 3B43.
RegionCR in the Whole RegionCR in the Hillside Face to Vapor TransportationCR in the Hillside Back to Vapor Transportation
Gauged Grids Ungauged GridsGauged Grids Ungauged GridsGauged Grids Ungauged Grids
Higher MountainsHimalaya51.557.4100.084.742.947.7
Kunlun57.160.057.160.0----
Tianshan57.963.555.674.460.053.4
Qilian65.258.750.051.488.969.5
Lower MountainsQinling92.375.0100.073.187.577.6
Taihang63.664.642.955.073.368.2
Changbai60.467.058.167.064.767.5
Wuyi51.233.850.036.451.932.5
Average62.460.4 64.262.867.059.5

3.3. Improvement the Robust of Satellite Precipitation

3.3.1. Testing Calibration and Cross Validation

The LET method was validated by cross-validation process before being applied to the satellite rainfall. For each mountain, 3–6 gauges were excluded when searching for the best fit through GP, and then the mined relation was applied on the excluded gauge for validating the relation. The procedure is then repeated until all the gauges have been excluded only once. Given the number of available gauges (see Table 1), the cross-validation process is repeated 4–8 times for the eight areas.
Figure 5 shows the comparison between corrected rainfall and measurements. RMSD of original 3B43 rainfall ranged within 46~272 mm (see Table 2). However after the correction by the LET method, RMSD was reduced to 31~97 mm. Corrected rainfall fitted gauge data well in Figure 5. Therefore, the relationships between the actual rainfall and relevant factors obtained from GP were capable of deriving reliable actual rainfall over grid cells with gauges.

3.3.2. Final Calibration and Correction of TMPA

Put all the ground gauges into the mining dataset to correct the mean annual rainfall of 3B43 of the period 2001–2012 by LET. The mined final equations are listed in the Appendix. The error parameters are listed in Table 4. It indicates that the accuracy of 3B43 rainfall was significantly improved in gauge grid cells after the calibration, compared with the original 3B43 accuracy in Table 2. The average bias was reduced from 15.8% to −4.5%; meanwhile, the average RMSD was reduced from 103 mm to 47 mm. Compared with Table 3, the average CR was improved from 62.4% to 76.6% and from 60.0% to 64.2% for the grid cells with and without gauges, respectively.
Figure 5. Cross-Validation of the Location-Elevation-TMPA (LET) method using mean annual rainfall (2001–2012) from gauge measurements and corrected 3B43.
Atmosphere 06 00983 g005
Table 4. Comparison of mean annual rainfall (2001–2012) from gauges and corrected 3B43.
RegionMean of Gauges (mm)Mean of gauged grids (mm)Bias (%)RMSD (mm)CR of Gauged Grids (%)CR of Ungauged Grids (%)
Himalaya453422−6.89284.878.2
Kunlun10676−28.24964.363.7
Tianshan175171−2.23184.266.7
Qilian2332351.02682.660.4
Qinling7767770.22776.971.6
Taihang5025030.31972.777.0
Changbai6746740.04475.055.1
Wuyi156015610.08972.141.1
Average560552−4.54776.664.2
Figure 6 shows the rainfall-elevation scatters from the original 3B43, corrected 3B43 and gauged data. Scatter for 3B43 was plotted every 200 m in bins based on the elevation range of each mountain. It can be found that the rainfall presented an obvious tendency versus elevation in most cases. The rainfall presents a positive correlation to elevation in Wuyi, Changbai and Qilian, as well as Tianshan and Kunlun in the range of elevation <4000 m. The rainfall-elevation relation did not show an obvious trend in Qinling (Figure 6e). However, it shows a negative relation between rainfall and elevation in Taihang (Figure 6f), and in Himalaya when elevation <4500 m (Figure 6a). The similar feature was also reported in the Himalaya north foreland to the Tibetan Plateau [20] and south foreland to Nepal [34], and also in Awash River in Ethiopia [23]. Rainfall-elevation scatters from corrected satellite rainfall were much closer to that from gauge data, especially in Himalaya (see Figure 6a).
Figure 6. The original (black squares), corrected (black circles) 3B43 and gauged (red triangles) mean annual rainfalls (2001–2012) versus elevation in study areas. The error bars denote the lower 5% and upper 95% rainfall value within each elevation range. (a) Himalaya, (b) Kunlun, (c) Tianshan, (d) Qilian, (e) Qinling, (f) Taihang, (g) Changbai, (h) Wuyi.
Atmosphere 06 00983 g006aAtmosphere 06 00983 g006b
It should be noted that the LET method relies on gauge data to fit the relationship. The mined relation may only be valid within areas that have similar rainfall error patterns as the gauge grid cells do. To extend the relation to where exceeding to the gauge elevation range, more attention should be paid.

4. Discussion

4.1. The Sensitive of CR to l of Rainfall-Elevation Mask

As described in Section 2.1, l is the number of the gauges for the sequential gauge group used to derive the rainfall-elevation mask. The CR values were calculated with different l as shown in Table 5. The CR increases with the increasing of l, which is reasonable since a larger l contributes a larger overlap for rainfall-elevation mask. However, sensitivity of CR to l decreases when l surpasses 3, and l = 2 might be too strict, l = 3 might be a good option for evaluating the accuracy of satellite rainfall without gauges.
Table 5. Consistency rate (%) changes with l for mean annual rainfall (2001–2012) of original 3B43.
Regionl = 2l = 3l = 4l = 5
Higher MountainsHimalaya42.057.461.462.8
Kunlun31.960.069.475.9
Tianshan29.863.575.183.0
Qilian36.958.771.077.8
Lower MountainsQinling40.575.089.794.0
Taihang44.064.682.585.9
Changbai38.267.079.884.0
Wuyi12.933.844.053.6
Average34.560.071.677.1

4.2. The Suitability of LET for Monthly Precipitation of TMPA 3B43 (V7)

To test the effectiveness of LET on monthly scale, Kunlun was taken as a case study. The rainfall of every July and every month were corrected from the dataset of 2001–2012, and the R2 and CV(RMSD) before and after correction were listed in Table 6. Comparison between satellite rainfall and measurements were shown in Figure 7. For both every July and every month cases, the corrected rainfall has higher R2 and lower CV(RMSD) than originals, indicating the valuable effectiveness of LET method on monthly scale.
Table 6. Errors of original and corrected monthly rainfall (2001–2012) of 3B43 in Kunlun.
Time ScaleOriginalCorrected
R2CV(RMSD) (%)R2CV(RMSD) (%)
Every July0.5572.90.7357.1
Every month0.53124.90.61109.2
Figure 7. Comparison between 3B43 rainfall (original and corrected) and gauge rainfall on every July (a) and every month (b) in Kunlun during 2001–2012.
Atmosphere 06 00983 g007

4.3. The Effectivity for the of TMPA 3B42RT (V7)

4.3.1. Effective for Assessment

In this section, the evaluation and correction methods were applied on TMPA 3B42RT (V7) to test the effectiveness of the proposed methods on near-real-time products which is free from bias-correction procedure. The statistical parameters and scatter comparison showing the fitness between rainfall from 3B42RT and gauges were shown in Table 7 and Figure 8.
Table 7. Comparison of mean annual rainfall (2001–2012) from gauge measurements and original 3B42RT.
RegionMean of Gauge (mm)Mean of Gauged Grids (mm)Bias (%)RMSD (mm)CR of Gauged Grids (%)CR of Ungauged Grids (%)
Himalaya4531457221.610500.01.9
Kunlun106360239.633214.344.0
Tianshan175771340.66600.02.3
Qilian23345494.827630.447.8
Qinling7768357.68176.958.6
Taihang50265330.116222.716.5
Changbai6746760.310477.167.3
Wuyi156015620.131334.922.5
Average560846116.837232.032.6
Figure 8. Validation of the mean annual rainfall (2001–2012) from gauge measurements and original 3B42RT.
Atmosphere 06 00983 g008
The result showed that the TMPA 3B42RT products tended to overestimate rainfall in most study areas too. In the higher mountains with peak above 5800 m, including Himalaya, Kunlun, Tianshan and Qilian, the mean overestimation bias is 224.0%. In the others with peak lower than 3800 m, including Qinling, Taihang, Changbai and Wuyi, the mean overestimation bias is 9.5%. For the grid cells with gauges, CR is averagely 32.0%, 11.2% in higher mountains, and 52.9% in the other mountains. For the grid cells without gauges, CR is averagely 32.6%, 24.0% in higher mountains, and 41.2% in other mountains. Comparison with the result of 3B43 in Table 2 and Table 3, the 3B42RT presents a larger uncertainty judged by both traditional criteria of bias and RSMD and the new criterion of CR. The similar result was also found in western and northern China from 2008 to 2011 [46]. This is obviously reasonable since 3B42RT has not been adjusted by ground gauged data.

4.3.2. Effective for Correction

The finesses between LET-corrected 3B42RT rainfall and measurements in gauged grid cells are listed in Table 8. Figure 9 shows the comparison between corrected 3B42RT and measurements. It is clear that the accuracy of 3B42RT rainfall was significantly improved in gauge grid cells after the calibration, compared with the original 3B42RT accuracy in Table 7. Average Bias was reduced from 116.8% to 8.7% and average RMSD was reduced from 372 to 72 mm, the average CR was improved significantly from 32.0% to 77.1% in the grid cells with gauges and from 32.6% to 62.7% in the grid cells without gauges. Compared with that of 3B43 (Table 3 and Table 4), the improvement for 3B42RT is almost doubled. This is reasonable since 3B43 had been corrected by GPCC dataset.
Table 8. Comparison of mean annual rainfall (2001–2012) from gauge measurements and corrected 3B42RT.
RegionMean of Gauges (mm)Mean of Gauged Grids (mm)Bias (%)RMSD (mm)CR of Gauged Grids (%)CR of Ungauged Grids (%)
Himalaya4534540.29587.976.1
Kunlun10611710.83564.378.8
Tianshan17529065.213042.146.8
Qilian233231−0.63878.361.1
Qinling776770−0.841100.062.1
Taihang502496−1.23086.471.8
Changbai674656−2.76083.350.5
Wuyi15601544−1.014374.454.3
Average5605708.77277.162.7
Figure 9. Validation of the mean annual rainfall (2001–2012) from gauge measurements and corrected 3B42RT.
Atmosphere 06 00983 g009

5. Conclusions

Based on gauge data and TMPA data on the eight mountainous regions of China, methods were proposed for evaluating and calibrating satellite rainfall. The main findings are as follows.
Most evaluation and calibration approaches for satellite rainfall are primarily conducted on grid cells with gauges. However, the evaluation method based on the context of consistency rule shows that a higher accuracy of satellite rainfall in gauged grid cells does not absolutely indicate the same accuracy in ungauged grid cells. The consistency rule should be paid enough attention to the grid cells both on the gauged and ungauged satellite grid cells.
Many literatures reported that calibration for satellite rainfall in mountainous regions is unsatisfactory, especially at higher elevations, which is attributed to the complex topography and geography of higher mountains. This study demonstrated that the topographic and geographic information is valuable for correcting satellite rainfall. The location-elevation-TMPA (LET) method based on GP data mining presents great potential to overcome the difficulty of unknown pattern of the relationship and is valid both for near-real-time and research products, and both on monthly and annual scales.
It should be mentioned that the basic assumption of the evaluation and correction methods is the reliability of the gauge rainfall. Gauges may suffer from various uncertainty caused by the many reasons, such as difficulty of capturing solid precipitation. Meanwhile, satellite rainfall also tends to have large errors due to low signal-to-noise ratio in high-altitude and cold area. However, reliable methods to fix this problem are still missing with the current techniques. Results from the proposed methods should be double checked in these areas. Moreover, particular attention should also be paid when applying the relationship from gauged cells to areas with elevation exceeding the gauge elevation range.

Acknowledgments

This work was financially supported by the National Natural Science Foundation of China via Grant 51279076 and 91125018, the National Science and Technology Support Program Project of China (2013BAB05B03) and the Public Non-profile Project of the Ministry of Water Resources of China (Grant No. 201301082, 201401031). We greatly thank the editors and reviewers for providing thorough and constructive comments to improve the manuscript.

Author Contributions

Zhongjing Wang and Ting Xia designed this study, conducted the analysis, and wrote the manuscript; Hang Zheng provided important suggestions, and improved the manuscript.

Conflicts of Interest

The authors declare no conflicts of interest.

Appendix

Table A1. Relationship between actual rainfall and related factors (PT: TMPA rainfall; E: elevation; X: longitude; Y: latitude).
RegionRelationships for 3B42RTRelationships for 3B43
Himalaya P a = { exp [ exp ( 1 4 X 1 2 ) 2 E X 3 2 ] } 1 4 ( P T E 1 2 + 5.67 P T 9.35 X + E X 1 2 ) 1 2 X 2 Y P a = ( P T 2 Y X ) 1 4 exp ( 0.25 ( X + Y ) 1 2 ) Y ( E X 1 2 E 1 2 2 P T ) 1 8 4 X Y
Kunlun P a = E exp ( 3 Y 1 2 ) X 4 [ 1 + E 4 Y 3 exp ( 3 Y 1 2 ) + X Y P T + Y 1 2 + Y ] 1 P a = Y + X 3 2 exp [ 6.13 E ( T + 3 X ) X + Y 3 2 ( X 2 1.35 E ) 1 16 P T 1 8 X 1 ]
Tianshan P a = exp { [ exp ( P T X ) E + P T + ( E 9.88 ) E 2 P T 3 exp ( E Y ) E + P T 3 exp ( P T X ) + X P T 3 E + E ] 1 16 Y 3 2 X 1 } P a = P T ( X Y ) [ ( P T + 3 X ) ( Y X ) exp ( E T X ) + 1.69 P T Y ( Y X ) + Y ] 1 P T exp ( E P T ) Y + P T 1 2
Qilian P a = ( P T X ) 1 2 ( 4 P T + E ) 1 4 ( X 2 Y ) E Y 1228.5 ( P T E ) 2 Y P a = E 1 2 P T { ( 3 Y X ) [ P T 3 X 0.005 E 2 ( E X ) + Y ] + 0.62 E } 1 2
Qinling P a = 1 + exp [ 0.5 exp ( 0.5 P T 1 4 ) 0.5 X 1 2 ] P T 1 2 E 1 2 X + 2 X + T + T 1 2 ( 1 Y 2 1 X ) exp ( X 1 2 ) P a = ( E + 2 X ) X ( P T E ) 2 + ( 2 X + P T ) E ( 2 P T E ) ( P T E ) + P T Y
Taihang P a = X 1.51 Y { ( 1.41 Y 1 2 P T E ) 1 2 [ X Y 8 + X 3 2 ( X 2.35 ) 1 2 Y 15 2 + P T E 4 ] 3 2 1.19 Y 61 4 + X } P a = ( X Y 1.5 ) [ ( X Y E ) 1 2 + X 33 16 Y E 1 16 Y X + P T 1.2 ] ( X E Y X Y E ) 1
Changbai P a = ( P T 2 Y + X P T E 2 + E 3 2 + X ) 2 [ Y ( P T Y ) ( E 2 + X Y P T + E Y ) Y E 2 + X Y 2 P T + E Y 2 Y P T 2 ] 1 P a = P T Y E Y 1 2 ( 0.731 X Y E ) P T 2 ( Y E ) 2 ( 0.80 P T E ) ( Y E )
Wuyi P a = X + Y + [ P T + P T 9 ( P T E 1 + E ) 3 Y 9 E 3 ( E 2 + Y + X ) 1 2 ] 1 16 P T 5 16 E 1 16 X 7 8 P a = P T + ( 3 E + P T + Y + P T 1 2 X ) 1 2 ( 2 E + P T + Y ) { X E P T + E X + exp [ ( X Y ) 1 2 E 1 2 ] } 1

References

  1. Nespor, V.; Sevruk, B. Estimation of wind-induced error of rainfall gauge measurements using a numerical simulation. J. Atmos. Ocean. Technol. 1999, 16, 450–464. [Google Scholar] [CrossRef]
  2. Rubel, F.; Hantel, M. Correction of daily rain gauge measurements in the Baltic Sea drainage basin. Nord. Hydrol. 1999, 30, 191–208. [Google Scholar]
  3. AghaKouchak, A.; Nasrollahi, N.; Habib, E. Accounting for Uncertainties of the TRMM Satellite Estimates. Remote Sens. 2009, 1, 606–619. [Google Scholar] [CrossRef]
  4. Huffman, G.J.; Adler, R.F.; Morrissey, M.M.; Bolvin, D.T.; Curtis, S.; Joyce, R.; McGavock, B.; Susskind, J. Global precipitation at one-degree daily resolution from multisatellite observations. J. Hydrometeorol. 2001, 2, 36–50. [Google Scholar] [CrossRef]
  5. Sorooshian, S.; Hsu, K.L.; Gao, X.; Gupta, H.V.; Imam, B.; Braithwaite, D. Evaluation of PERSIANN system satellite-based estimates of tropical rainfall. Bull. Am. Meteorol. Soc. 2000, 81, 2035–2046. [Google Scholar] [CrossRef]
  6. Joyce, R.J.; Janowiak, J.E.; Arkin, P.A.; Xie, P. CMORPH: A method that produces global precipitation estimates from passive microwave and infrared data at high spatial and temporal resolution. J. Hydrometeorol. 2004, 5, 487–503. [Google Scholar] [CrossRef]
  7. Kubota, T.; Shige, S.; Hashizume, H.; Aonashi, K.; Takahashi, N.; Seto, S.; Hirose, M.; Takayabu, Y.N.; Ushio, T.; Nakagawa, K.; et al. Global precipitation map using satellite-borne microwave radiometers by the GSMaP Project: Production and validation. IEEE Trans. Geosci. Remote Sens. 2007, 45, 2259–2275. [Google Scholar] [CrossRef]
  8. Huffman, G.J.; Bolvin, D.T.; Nelkin, E.J.; Wolff, D.B.; Adler, R.F.; Gu, G.; Nelkin, E.J.; Bowman, K.P.; Hong, Y.; Stocker, E.F.; et al. The TRMM Multisatellite Precipitation Analysis (TMPA): Quasi-global, multiyear, combined-sensor precipitation estimates at fine scales. J. Hydrometeorol. 2007, 8, 38–55. [Google Scholar] [CrossRef]
  9. Huffman, G.J.; Adler, R.F.; Bolvin, D.T.; Nelkin, E.J. The TRMM Multi-satellite Precipitation Analysis (TMPA). Chapter 1. In Satellite Rainfall Applications for Surface Hydrology; ISBN 978-90-481-2914-0. Springer Netherlands: Berlin, Germany, 2010; pp. 3–22. [Google Scholar]
  10. Hossain, F.; Lettenmaier, D.P. Flood prediction in the future: Recognizing hydrologic issues in anticipation of the Global Precipitation Measurement mission. Water Resour. Res. 2006, 42, W11301. [Google Scholar] [CrossRef]
  11. Hong, Y.; Adler, R.; Huffman, G. Evaluation of the potential of NASA multi-satellite precipitation analysis in global landslide hazard assessment. Geophys. Res. Lett. 2006, 33, L22402. [Google Scholar] [CrossRef]
  12. Huffman, G.J.; Bolvin, D.T. TRMM and Other Data Precipitation Data Set Documentation; NASA Goddard Space Flight Center: Greenbelt, MD, USA, 2014; p. 42. [Google Scholar]
  13. Hong, Y.; Hsu, K.L.; Moradkhani, H.; Sorooshian, S. Uncertainty quantification of satellite precipitation estimation and Monte Carlo assessment of the error propagation into hydrologic response. Water Resour. Res. 2006, 42, W08421. [Google Scholar] [CrossRef]
  14. Khan, S.I.; Hong, Y.; Gourley, J.J.; Khattak, M.U.K.; Yong, B.; Vergara, H.J. Evaluation of three high-resolution satellite precipitation estimates: Potential for monsoon monitoring over Pakistan. Adv. Space Res. 2014, 54, 670–683. [Google Scholar] [CrossRef]
  15. Hu, Q.; Yang, D.; Li, Z.; Mishra, A.K.; Wang, Y.; Yang, H. Multi-scale evaluation of six high-resolution satellite monthly rainfall estimates over a humid region in China with dense rain gauges. Int. J. Remote Sens. 2014, 35, 1272–1294. [Google Scholar] [CrossRef]
  16. Tian, Y.; Peters-Lidard, C.D.; Choudhury, B.J.; Garcia, M. Multitemporal analysis of TRMM-based satellite precipitation products for land data assimilation applications. J. Hydrometeorol. 2007, 8, 1165–1183. [Google Scholar] [CrossRef]
  17. Li, Z.; Yang, D.; Hong, Y. Multi-scale evaluation of high-resolution multi-sensor blended global precipitation products over the Yangtze River. J. Hydrol. 2013, 500, 157–169. [Google Scholar] [CrossRef]
  18. Cheema, M.J.M.; Bastiaanssen, W.G. Local calibration of remotely sensed rainfall from the TRMM satellite for different periods and spatial scales in the Indus Basin. Int. J. Remote Sens. 2012, 33, 2603–2627. [Google Scholar] [CrossRef]
  19. Shen, Y.; Zhao, P.; Pan, Y.; Yu, J. A high spatiotemporal gauge-satellite merged precipitation analysis over China. J. Geophys. Res. Atmos. 2014, 119, 3063–3075. [Google Scholar] [CrossRef]
  20. Anders, A.M.; Roe, G.H.; Hallet, B.; Montgomery, D.R.; Finnegan, N.J.; Putkonen, J. Spatial patterns of precipitation and topography in the Himalaya. Geol. Soc. Am. Spec. Pap. 2006, 398, 39–53. [Google Scholar]
  21. Gebregiorgis, A.S.; Hossain, F. Understanding the dependence of satellite rainfall uncertainty on topography and climate for hydrologic model simulation. IEEE Trans. Geosci. Remote Sens. 2012, 51, 704–718. [Google Scholar] [CrossRef]
  22. Bookhagen, B.; Burbank, D.W. Topography, relief, and TRMM-derived rainfall variations along the Himalaya. Geophys. Res. Lett. 2006, 33, L08405. [Google Scholar]
  23. Hirpa, F.A.; Gebremichael, M.; Hopson, T. Evaluation of high-resolution satellite precipitation products over very complex terrain in Ethiopia. J. Appl. Meteorol. Climatol. 2010, 49, 1044–1051. [Google Scholar] [CrossRef]
  24. Ji, X.; Luo, Y. Quality Assessment of the TRMM Precipitation Data in Mid Tianshan Mountains. Arid Land Geogr. 2013, 36, 253–262. [Google Scholar]
  25. Zhu, G.F.; Pu, T.; Zhang, T.; Liu, H.L.; Zhang, X.B.; Liang, F. The Accuracy of TRMM Precipitation Data in Hengduan Mountainous Region, China. Sci. Geogr. Sinca 2013, 33, 1125–1131. [Google Scholar]
  26. Yin, Z.Y.; Zhang, X.; Liu, X.; Colella, M.; Chen, X. An assessment of the biases of satellite rainfall estimates over the Tibetan Plateau and correction methods based on topographic analysis. J. Hydrometeorol. 2008, 9, 301–326. [Google Scholar] [CrossRef]
  27. Müller, M.F.; Thompson, S.E. Bias adjustment of satellite rainfall data through stochastic modeling: Methods development and application to Nepal. Adv. Water Resour. 2013, 60, 121–134. [Google Scholar] [CrossRef]
  28. Brunsdon, C.; McClatchey, J.; Unwin, D.J. Spatial variations in the average rainfall–altitude relationship in Great Britain: An approach using geographically weighted regression. Int. J. Climatol. 2001, 21, 455–466. [Google Scholar] [CrossRef]
  29. Derin, Y.; Yilmaz, K.K. Evaluation of multiple satellite-based precipitation products over complex topography. J. Hydrometeorol. 2014, 15, 1498–1516. [Google Scholar] [CrossRef]
  30. Shen, Y.; Xiong, A.; Wang, Y.; Xie, P. Performance of high-resolution satellite precipitation products over China. J. Geophys. Res. 2010, 115, D02114. [Google Scholar] [CrossRef]
  31. Scheel, M.L.M.; Rohrer, M.; Huggel, C.; Santos Villar, D.; Silvestre, E.; Huffman, G.J. Evaluation of TRMM multi-satellite precipitation analysis (TMPA) performance in the central Andes region and its dependency on spatial and temporal resolution. Hydrol. Earth Syst. Sci. 2011, 15, 2649–2663. [Google Scholar] [CrossRef] [Green Version]
  32. AghaKouchak, A.; Mehran, A.; Norouzi, H.; Behrangi, A. Systematic and random error components in satellite precipitation data sets. Geophys. Res. Lett. 2012, 39, L09406. [Google Scholar] [CrossRef]
  33. Yong, B.; Liu, D.; Gourley, J.J.; Tian, Y.; Huffman, G.J.; Ren, L.; Hong, Y. Global view of real-time TRMM Multi-satellite Precipitation Analysis: Implication to its successor Global Precipitation Measurement mission. Bull. Am. Meteorol. Soc. 2014. [Google Scholar] [CrossRef]
  34. Krakauer, N.Y.; Pradhanang, S.M.; Lakhankar, T.; Jha, A.K. Evaluating Satellite Products for Precipitation Estimation in Mountain Regions: A Case Study for Nepal. Remote Sens. 2013, 5, 4107–4123. [Google Scholar] [CrossRef]
  35. Zhang, W.Y.; Mischke, S.; Zhang, C.J.; Gao, D.; Fan, R. Ostracod distribution and habitat relationships in the Kunlun Mountains, northern Tibetan Plateau. Quat. Int. 2013, 313, 38–46. [Google Scholar] [CrossRef]
  36. Wang, Y.Z.; Zhang, H.P.; Zheng, D.W.; Zheng, W.J.; Zhang, Z.Q.; Wang, W.T.; Yu, J.X. Controls on decadal erosion rates in Qilian Shan: Re-evaluation and new insights into landscape evolution in north-east Tibet. Geomorphology 2014, 223, 117–128. [Google Scholar]
  37. Xu, G.B.; Liu, X.H.; Qin, D.H.; Chen, T.; Wang, W.Z.; Wu, G.J.; Sun, W.Z.; An, W.L.; Zeng, X.M. Tree-ring delta δ18O evidence for the drought history of eastern Tianshan Mountains, northwest China since 1700 AD. Int. J. Climatol. 2014, 34, 3336–3347. [Google Scholar] [CrossRef]
  38. Cai, Q.F.; Liu, Y. Climatic response of Chinese pine and PDSI variability in the middle Taihang Mountains, north China since 1873. Trees 2013, 27, 419–427. [Google Scholar] [CrossRef]
  39. Cai, Y.J.; Tan, L.C.; Cheng, H.; An, Z.S.; Edwards, R.L.; Kelly, M.J.; Kong, X.G.; Wang, X.F. The variation of summer monsoon precipitation in central China since the last deglaciation. Earth Planet. Sci. Lett. 2010, 291, 21–31. [Google Scholar] [CrossRef]
  40. Zheng, D.L.; Wallin1, D.O.; Hao, Z.Q. Rates and patterns of landscape change between 1972 and 1988 in the Changbai Mountain area of China and North Korea. Landsc. Ecol. 1997, 12, 241–254. [Google Scholar] [CrossRef]
  41. Luo, P.; Peng, P.A.; Gleixner, G.; Zheng, Z.; Pang, Z.H.; Ding, Z.L. Empirical relationship between leaf wax n-alkane delta D and altitude in the Wuyi, Shennongjia and Tianshan Mountains, China: Implications for paleoaltimetry. Earth Planet. Sci. Lett. 2011, 301, 285–296. [Google Scholar] [CrossRef]
  42. Long, D.; Shen, Y.J.; Sun, A.; Hong, Y.; Longuevergne, L.; Yang, Y.T.; Li, B.; Chen, L. Drought and flood monitoring for a large karst plateau in Southwest China using extended GRACE data. Remote Sens. Environ. 2014, 155, 145–160. [Google Scholar] [CrossRef]
  43. Qin, Y.X.; Chen, Z.Q.; Shen, Y.; Zhang, S.P.; Shi, R.H. Evaluation of Satellite Rainfall Estimates over the Chinese Mainland. Remote Sens. 2014, 6, 11649–11672. [Google Scholar] [CrossRef]
  44. Tong, K.; Su, F.; Yang, D.; Hao, Z. Evaluation ofsatellite precipitation retrievals and their potential utilities in hydrologic modeling over the Tibetan Plateau. J. Hydrol. 2014, 519, 423–437. [Google Scholar] [CrossRef]
  45. Yong, B.; Chen, B.; Hong, Y.; Gourley, J.J.; Li, Z. Impact of Missing Passive Microwave Sensors on Multi-Satellite Precipitation Retrieval Algorithm. Remote Sens. 2015, 7, 668–683. [Google Scholar] [CrossRef]
  46. Chen, S.; Hong, Y.; Cao, Q.; Gourley, J.J.; Kirstetter, P.E.; Yong, B.; Tian, Y.; Zhang, Z.; Shen, Y.; Hardy, J.; et al. Similarity and difference of the two successive V6 and V7 TRMM multisatellite precipitation analysis performance over China. J. Geophys. Res. Atmos. 2013, 118, 13060–13074. [Google Scholar] [CrossRef]
  47. Yong, B.; Ren, L.L.; Hong, Y.; Wang, J.H.; Gourley, J.J.; Jiang, S.H.; Chen, X.; Wang, W. Hydrologic evaluation of Multisatellite Precipitation Analysis standard precipitation products in basins beyond its inclined latitude band: A case study in Laohahe basin, China. Water Resour. Res. 2010, 46, W07542. [Google Scholar] [CrossRef]

