Article

Machine Learning Approach for Prediction of Lateral Confinement Coefficient of CFRP-Wrapped RC Columns

by
Xingsi Xue
1,
Celestine Makota
2,
Osamah Ibrahim Khalaf
3,
Jagan Jayabalan
2,*,
Pijush Samui
4 and
Ghaida Muttashar Abdulsahib
5
1
Fujian Provincial Key Laboratory of Big Data Mining and Applications, Fujian University of Technology, Fuzhou 350118, China
2
Department of Civil Engineering, Galgotias University, Greater Noida 203201, Uttar Pradesh, India
3
Al-Nahrain Research Center for Renewable Energy, Department of Solar, Al-Nahrain University, Baghdad 64074, Iraq
4
Department of Civil Engineering, National Institute of Technology Patna, Patna 800005, Bihar, India
5
Department of Computer Engineering, University of Technology, Baghdad 10066, Iraq
*
Author to whom correspondence should be addressed.
Symmetry 2023, 15(2), 545; https://doi.org/10.3390/sym15020545
Submission received: 18 January 2023 / Revised: 6 February 2023 / Accepted: 13 February 2023 / Published: 17 February 2023

Abstract

:
Materials have a significant role in creating structures that are durable, valuable and possess symmetry engineering properties. Premium quality materials establish an exemplary environment for every situation. Among the composite materials in constructions, carbon fiber reinforced polymer (CFRP) is one of best materials which provides symmetric superior strength and stiffness to reinforced concrete structures. For the structure to be confining, the region jeopardizes seismic loads and axial force, specifically on columns, with limited proportion of ties or stirrups implemented to loftier ductility and brittleness. The failure and buckling of columns with CFRP has been studied by many researchers and is ongoing to determine ways columns can be retrofitted. This article symmetrically integrates two disciplines, specifically materials (CFRP) and computer application (machine learning). Technically, predicting the lateral confinement coefficient (Ks) for reinforced concrete columns in designs plays a vital role. Therefore, machine learning models like genetic programming (GP), minimax probability machine regression (MPMR) and deep neural networks (DNN) were utilized to determine the Ks value of CFRP-wrapped RC columns. In order to compute Ks value, parameters such as column width, length, corner radius, thickness of CFRP, compressive strength of the unconfined concrete and elastic modulus of CFRP act as stimulants. The adopted machine learning models utilized 293 datasets of square and rectangular RC columns for the prediction of Ks. Among the developed models, GP and MPMR provide encouraging performances with higher R values of 0.943 and 0.941; however, the statistical indices proved that the GP model outperforms other models with better precision (R2 = 0.89) and less errors (RMSE = 0.056 and NMBE = 0.001). Based on the evaluation of statistical indices, rank analysis was carried out, in which GP model secured more points and ranked top.

1. Introduction

Hindering of buckling and brittle failure for any structure have become life-long issues. Loads, such as seismic load, wind load and axial or transient forces, are substantial to structures. In order to overcome these, effectuating columns, shear factors and seismic resistance are significantly considered when designing a structure. The application of steel materials for reconstruction and maintenance of structures was applied over a long period. Steel materials complied to their mechanical performance, oxidization act and complex in operations, therefore the innovation of new material such as fiber-reinforced polymer (FRP), can be considered for retrofitting. Ref [1] utilized it to reinforce both strength and ductility of concrete columns by implementing limited proportion confinement to the concrete core. Due to its symmetrical weightlessness, lifespan imperishability and anti-corrosion properties, FRP was appropriate for jacketing or retrofitting the RC columns. Many examples in the literature have manifested the utilization of FRP for retrofitting columns. Ref. [2] enhanced achievement through experimental assessment of the load-bearing capacity and ductility of columns externally strengthened with fitful FRP composite confinement wraps under contemporaneous axial loading and bending moment due to buckling of bars principally dependent on the lateral restraint by the inward steel ties. Most research studies have been steadfast in the assessment of the performance of FRP-confined RC columns under the application of axial loads, which enables execution of its yield stress. On the other side, output has focused on FRP-jacketed columns under axial load and buckling effect. Ref. [3] studied the behavior of partially and fully FRP-confined circularized square columns under axial compression. Ref. [4] utilized the stress-strain method for analysis and design of FRP-wrapped RC columns.
A carbon fiber reinforced polymer (CFRP) combination for external wrapping is new-fangled engineering science that plays an important, indispensable aspect for both buttressing and confining methods for dysfunctional or crippled RC concrete structures. All engineering structures are jeopardized under intense loading conditions, such as seismic load, shear stress and buckling effects, leading to severe wrecking in a fraction of the time. The composite material availed greater strength–to–weight ratio, non-corrodible, inexpensive implementation and application, as well as thin layers’ size for coating. The following Figure 1 depicts the partially and fully CFRP-covered RC columns and their load distributions. Ref. [5] CFRP can achieve up to 60% diminish in weight in correspondence to elements present in steel. Utilization of CFRP is established for retrofitting and reinforcing existing RC concrete elements structures, such as columns, piers and piles. The performance diminished replacement of constructions, stabilizing the lifespan of the existing structure. American institute of concrete [6] characterized behaviors of CFRP for retrofitting RC concrete structures. This study elaborated how carbon fiber reinforced polymer (CFRP) has been extensively exerted recently to wrap RC columns, with the purpose of upgrading endurance, axial compressive load-bearing capacity and buckling impact. Generally, wrecking of structures required CFRP impact design to improve or jacket their longevity and load-carrying capacity compared to the costs of rebuilding or reconstruction. Ref. [7] utilized CFRP for strengthening RC columns in the marine environment. The utilization of carbon fiber reinforced polymers (CFRP) to restrain RC columns has been accredited in resisting axial load compression applications and increasing capacity and ductility of RC performance. Ref. [8] applied CFRP to revamp circular RC columns. The impact of failure size on the integrity of CFRP-confined RC column is detailed in Ref. [9]. The researchers explored the tough character and water percipiency of concrete wrapped with CFRP. Compressive strength of the concrete was upgraded through escalating the amount of CFRP layers used as anti-corrosion [10].
Lateral confinement coefficient (Ks) is the predicted numerical value in design consideration for the magnitude of hindered columns, since columns play an important role in lateral seismic resistance. Ref. [11] predicted the lateral confinement coefficient of columns cased with FRP, reinforcing and increasing the capability of RC columns. Ref. [12] utilized Gaussian and tree model for the predication of Ks. The design code of Ks value must be strict to ensure execution of the lateral force or axial load acting on the column. With the enhancement of CFRP material, the Ks value is based on retrofitting ductile and brittle materials to improve endurance strength and hardness of the column or structure lifespan. In actuality, concrete as composite materials can simply rupture in the instance of axial load application. Under seismic load, employed reinforcement bars claim to enlarge the designed capability. Therefore, they dispel the seismic impact penetrate zone of structures in a state of hysteresis strength and cause bilateral numbers of cycle loading. Due to this, RC columns experience risky condition at maximum moments in term of stress and strain. Concrete material is unable to sustain or withhold such amount of stress and strain under tension application, which is why Ks vales are needed as supportive elements for confining or tying the zones so as to achieve ductility, as well as to enhance the lifespan of RC columns. At various stages, many researchers have determined the equation of Ks for CFRP-wrapped RC columns, which are tabulated in Table 1.
Genetic programming (GP) is one of the machine learning models evolved from Genetic Algorithms, which was proposed and regulated [20]. The ideology of GP was aroused from the theory of biological evolution: “survival of fittest.” Generally, GP targets to enhance the population of individuals by executing the preceded metrics of fitness. In a nuclear power plant, the identification of accidents was crucial, and it was effectively determined by the GP model. Ref. [21] utilized the GP model and proved its potential of being less time-consuming and almost 100% precise. Forecasting the strength of cemented paste backfill (CPB) plays a vital role in minerals engineering for the effective design of CPB. However, the traditional way of determining UCS consumes more time and money. Ref. [22] utilized the GP model in order to predict the UCS of CPB, which exhibits promising performance. The determination of undrained shear strength (Nk) of clayey soil is one of the tedious tasks in the field. Therefore, the researchers employed the GP model for computing the undrained shear strength of clay soil for the location East Port-Said by using liquid limit, plastic limit, plasticity index, water content and unit weight of the clayey soil as parameters. The researchers justified that the GP model predicts Nk with a good correlation [23]. The capability of GP was extended to resolve many engineering problems with better preciseness [24,25,26,27,28].
Minimax probability machine regression (MPMR) is a framework wing model of machine learning that was developed by Ref. [29] as a nonlinear model for predicting or estimating that the forthcoming mathematical outputs of the regression model will be within some bound of the true regression function. Ref. [30] utilized minimax probability machine regression (MPMR) to evaluate daily vaporization passing (Ep), forecasting models was employed for the design of water systems, urban water assessments and irrigation management. Other researchers such as Ref. [31] utilized MPMR for the prediction of hardness and fracture toughness in liquid–phase–sintered alumina, which is considerably more appropriate for predicting the parameters of liquid–phase–sintered alumina. Ref. [32] determined the uplift capacity of suction caisson (P), where MPMR became stout models for the prediction of suction caisson. Ref. [33] utilized minimax probability machine regression (MPMR) for the prediction of rapid chloride permeability of self-compacting concrete. The output verified that the MPMR model was satisfactory.
Deep neural networks (DNN), a framework of machine learning models, uses computer applications to decode complex functions over huge datasets, whereby the classification challenges contributes a major function in the advanced systems. Ref. [34] deployed an analysis of DNN for practical applications, and it showed a persuasive data package that helps in the design and engineer effective performance. Ref. [35] highlighted a survey of the application of (DNN) learning techniques on some selected areas (speech recognition, pattern recognition and computer vision). Ref. [36] raised awareness of separate parameters in (DNN) inclusion; the analytic framework enumerates antagonistic charges to semantic image editing. Ref. [37] applied deep neural networks for the discovery and examination of COVID-19 pandemic from chest X-ray illustrations. The DNN model carried out substantially higher results with minimum pre-processing of data for clinical practitioners. Ref. [38] utilized DNN for a survey on traffic prediction: proclivities, approaches and difficulties. The output offers a consultation based on the difficulties and a way forward based on this field. Similarly, more researchers integrated the computer applications in various engineering and medical problems [39,40,41,42,43,44,45,46,47,48,49,50,51,52,53].
This article comprises various sections as follows: Section 2 describes the summary of variables that was adopted for the dataset. This section shows the heatmap of correlation coefficient among the variables of the dataset and the scatter matrix of the variables. The next section, Section 3, explains the detailed interpretations of the nominated machine learning models. After the descriptions of the respective machine learning models, the performances of the developed models were inferred elaborately in Section 4. In this section, comparison of the models has been carried out by different statistical parameters, Taylor diagram and distribution functions. Section 5 derives the summary of this article.

2. Dataset Interpretation

In order to determine the lateral confinement coefficient (Ks), variables such as column width (b), length (h), corner radius (r), thickness of CFRP (tw), compressive strength of the unconfined concrete (f’co) and elastic modulus (Efrp) are considered as inputs. The following Table 1 conveys the comparison on the dataset of Ref. [11] and the adopted dataset.
In the above Table 2, the researchers had utilized 100 datasets of rectangular RC column and developed fuzzy logic model without the consideration of the corner radius [11]. The corner radius is one of the input parameters which has been considered in this study as it furnishes the following significances:
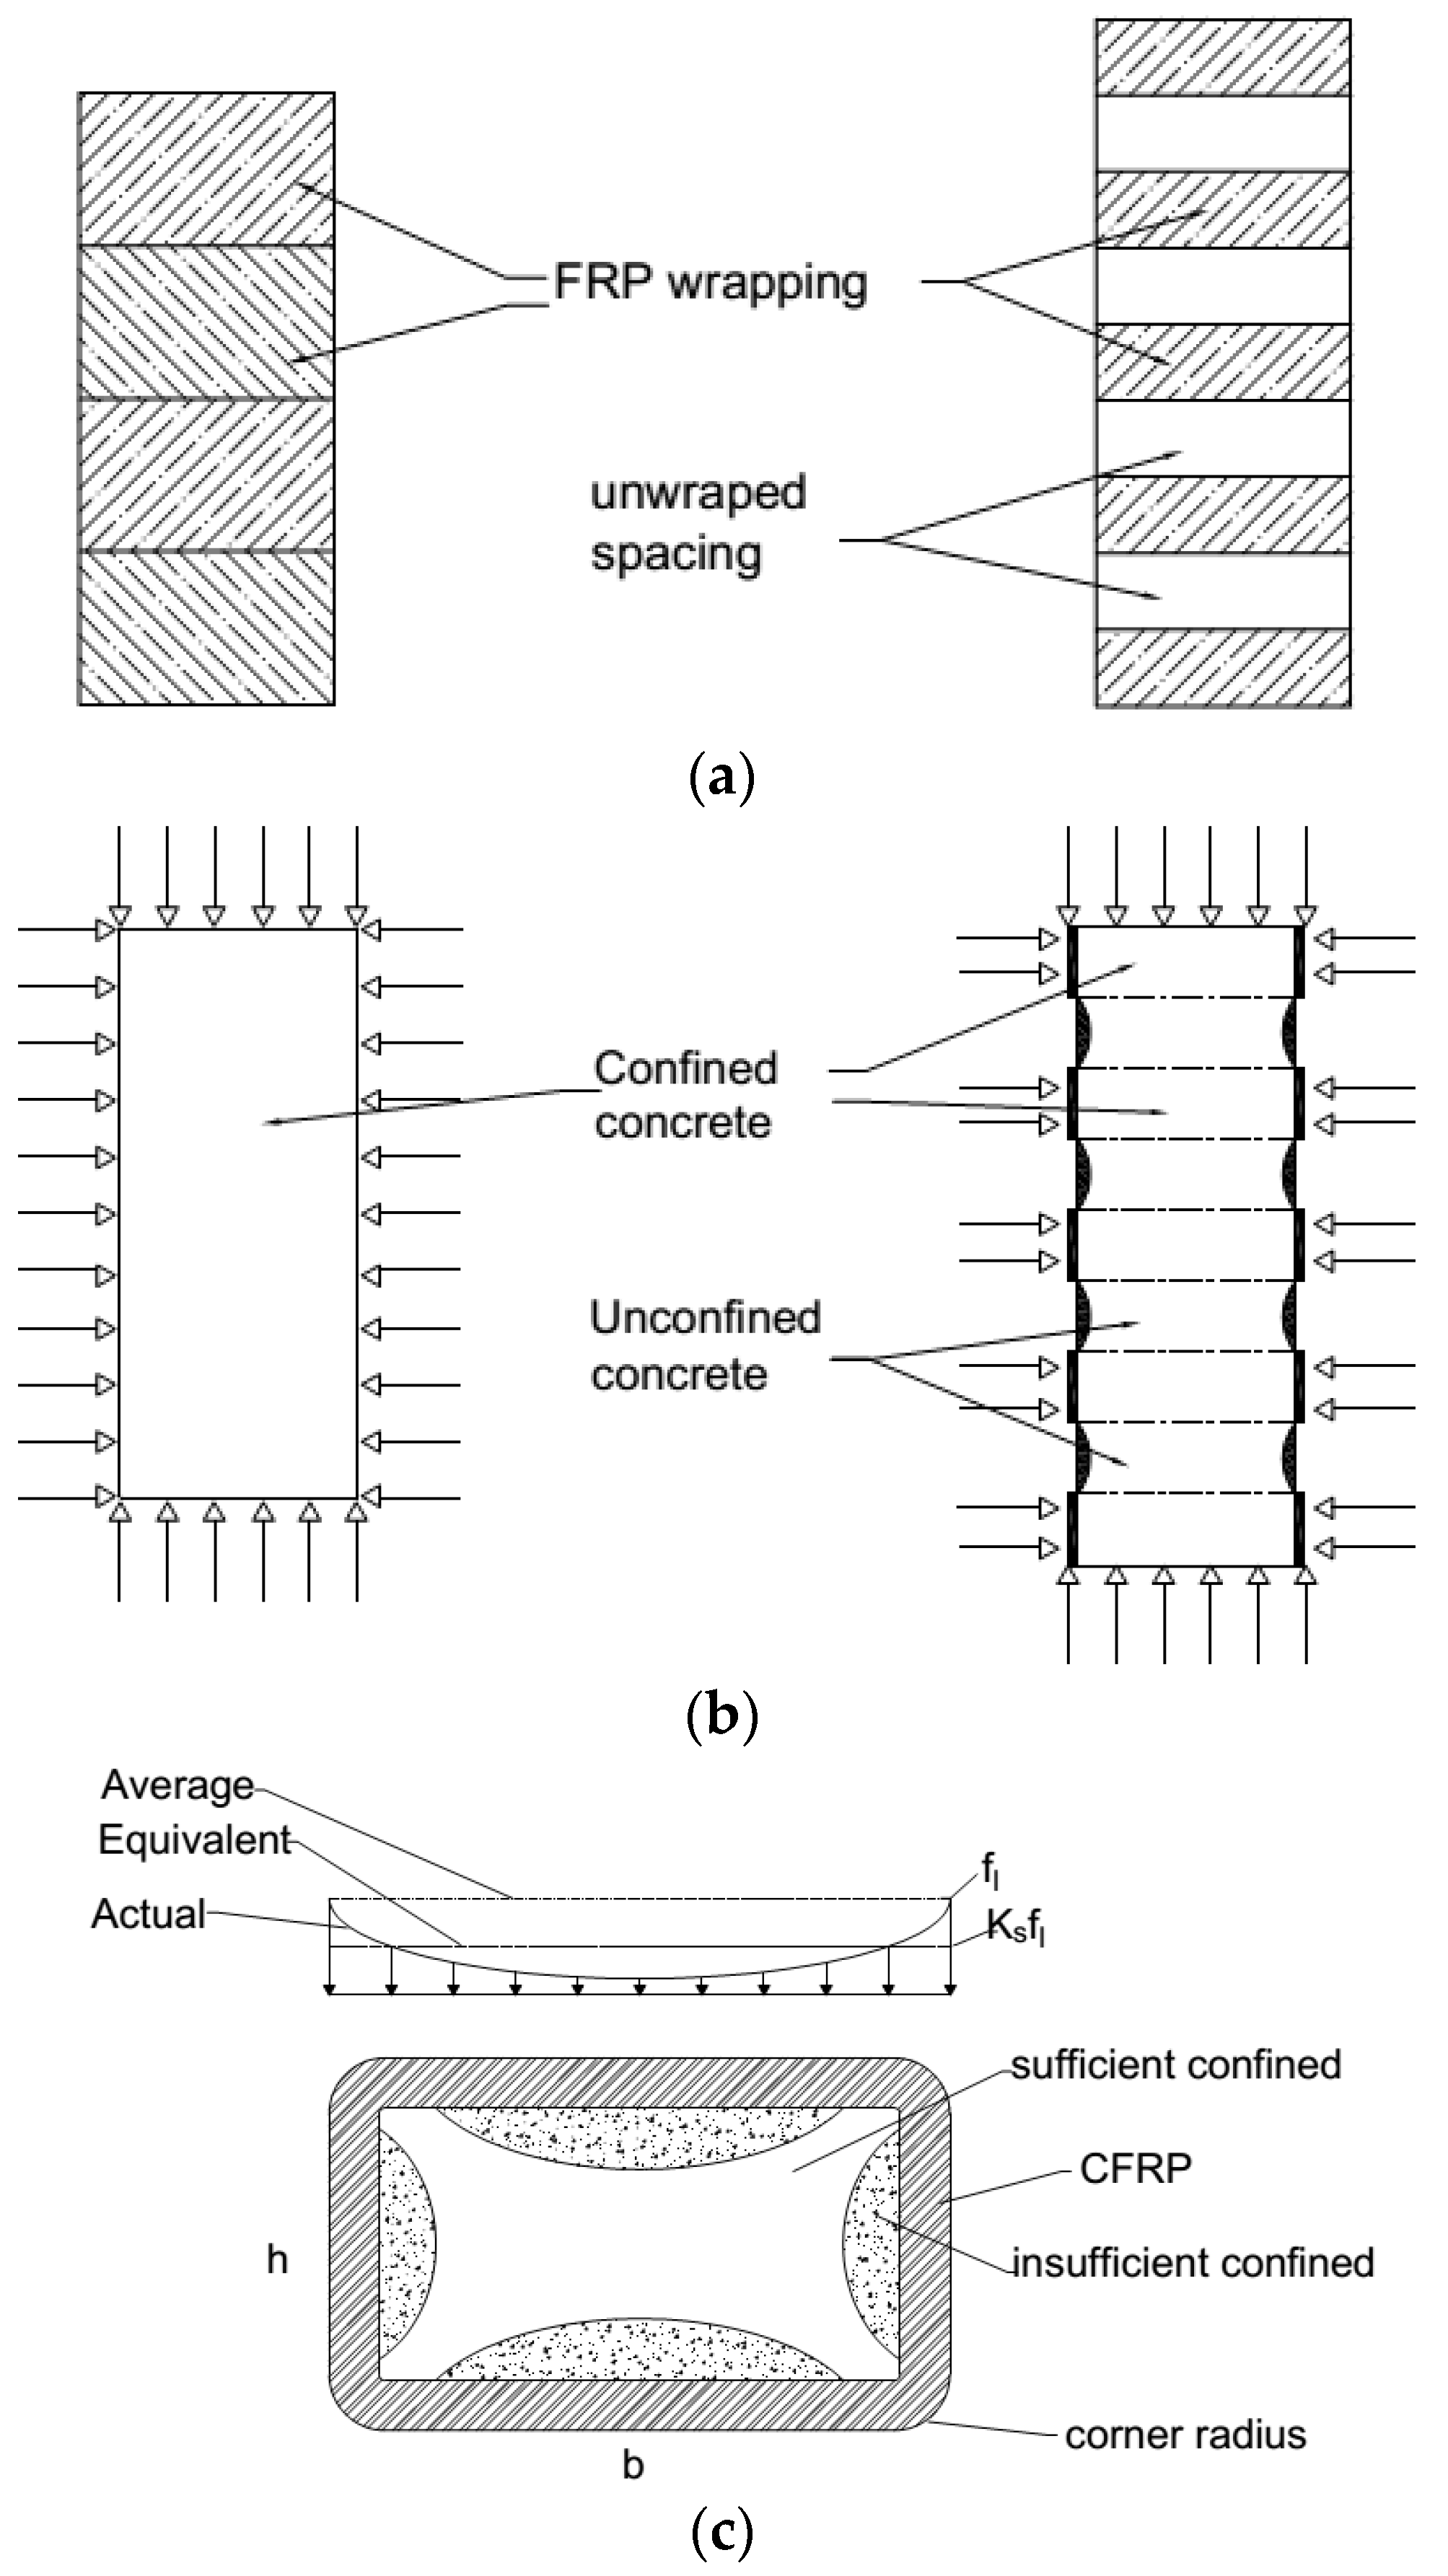
  • Corner radii are most significantly due to reduction/curtailments of the stress attack and improved strain distribution during extreme load application. At this moment, RC columns jeopardized maximum load, causing damage to weak zones due to uneven stirrup distribution, proper reinforcement arrangement or mixing proportion.
  • By reducing corner radii and wrapping with CFRP material, we can technically ensure that our RC columns have enhanced performance, with improved ductility and comprehensive strength.
  • Specimens examined by Ref. [54] showed that the compressive strength ratio (f’cc/f’co) of relatively large-scale square columns confined by CFRP increases almost linearly along with the increase of corner radius.
  • Demonstrating that with CFRP, confinement is inconsequential to enlarge the compressive strength of RC columns with sharp corners (r = 0 mm) at the highest loading extents, although the ductility can be increased.
  • A confinement effectiveness model, which considers lateral confinement level, corner radius ratio and size effect of the column, displayed that the strain efficiency factor at corner increases as the corner radius ratio increases [55,56].
  • Ref. [57] pointed out that the strength and strain augmentation effect of sporadically wrapped specimens can be perfected with evenly-distributed overlap regions. Thereupon, respective overlapping zones were staged on a different side and ducked the corner zones.
  • Ref. [58] demonstrated the confinement potency model by considering lateral confinement level, corner radius ratio and size effect, proposed for FRP-confined square columns. Juxtaposed with other extant models, the contemplated one provides an enhanced examination of FRP-confined square columns.
In order to determine the confinement coefficient of square and rectangular columns covered by CFRP fibers, a total of 293 datasets have been compiled from various works in the literature [1,11,59,60,61,62,63,64,65,66,67,68,69,70,71,72,73,74,75,76,77,78,79,80]. The following Table 3 conveys the statistical summary of the dataset.
The above Table 2 exhibits the lowest, average, standard deviation, maximum value, skewness and kurtosis for the compiled dataset, which has been utilized for developing the machine learning models.
The above Figure 2 conveys the symmetrical correlation between various variables in the form of matrix. In the above Figure 2, one color refers to the positive, and the other color indicates the negative correlation among the variables. The variation in the shades represents the potency of correlation which is easier to understand. The upcoming Figure 3 represents the scatterplot matrix which infers the companion relationship among various combinations of variables in the form of a grid, for the development of machine learning models and the understanding of variables between divergent features.
The above Figure 3 exhibits the association between the adopted variables. This is used to assess the linear correlation among the different variables.

3. Methodology

In this section, the adopted dataset, which was collected from various works in the literature, has been compiled then normalized between null and unity in order to deduce the perplexity of the machine learning models. The following Equation (1) depicts the formula for normalizing the dataset. In the next step, the dataset is segregated as 75% training dataset and 25% testing dataset. The datasets are then incorporated in the machine learning models such as GP, MPMR and DNN. Then, the models are compared based on the performance of the developed machine learning models by various statistical computations.
N o r m a l i z e d   d a t a = value lower   limit upper   limit lower   limit
where value represents the data to be normalized; upper and lower limits indicate the greatest and the lowest values of the parameter, respectively.
The following Figure 4 shows the traditional and adopted methodology for the current research work [19,81,82].

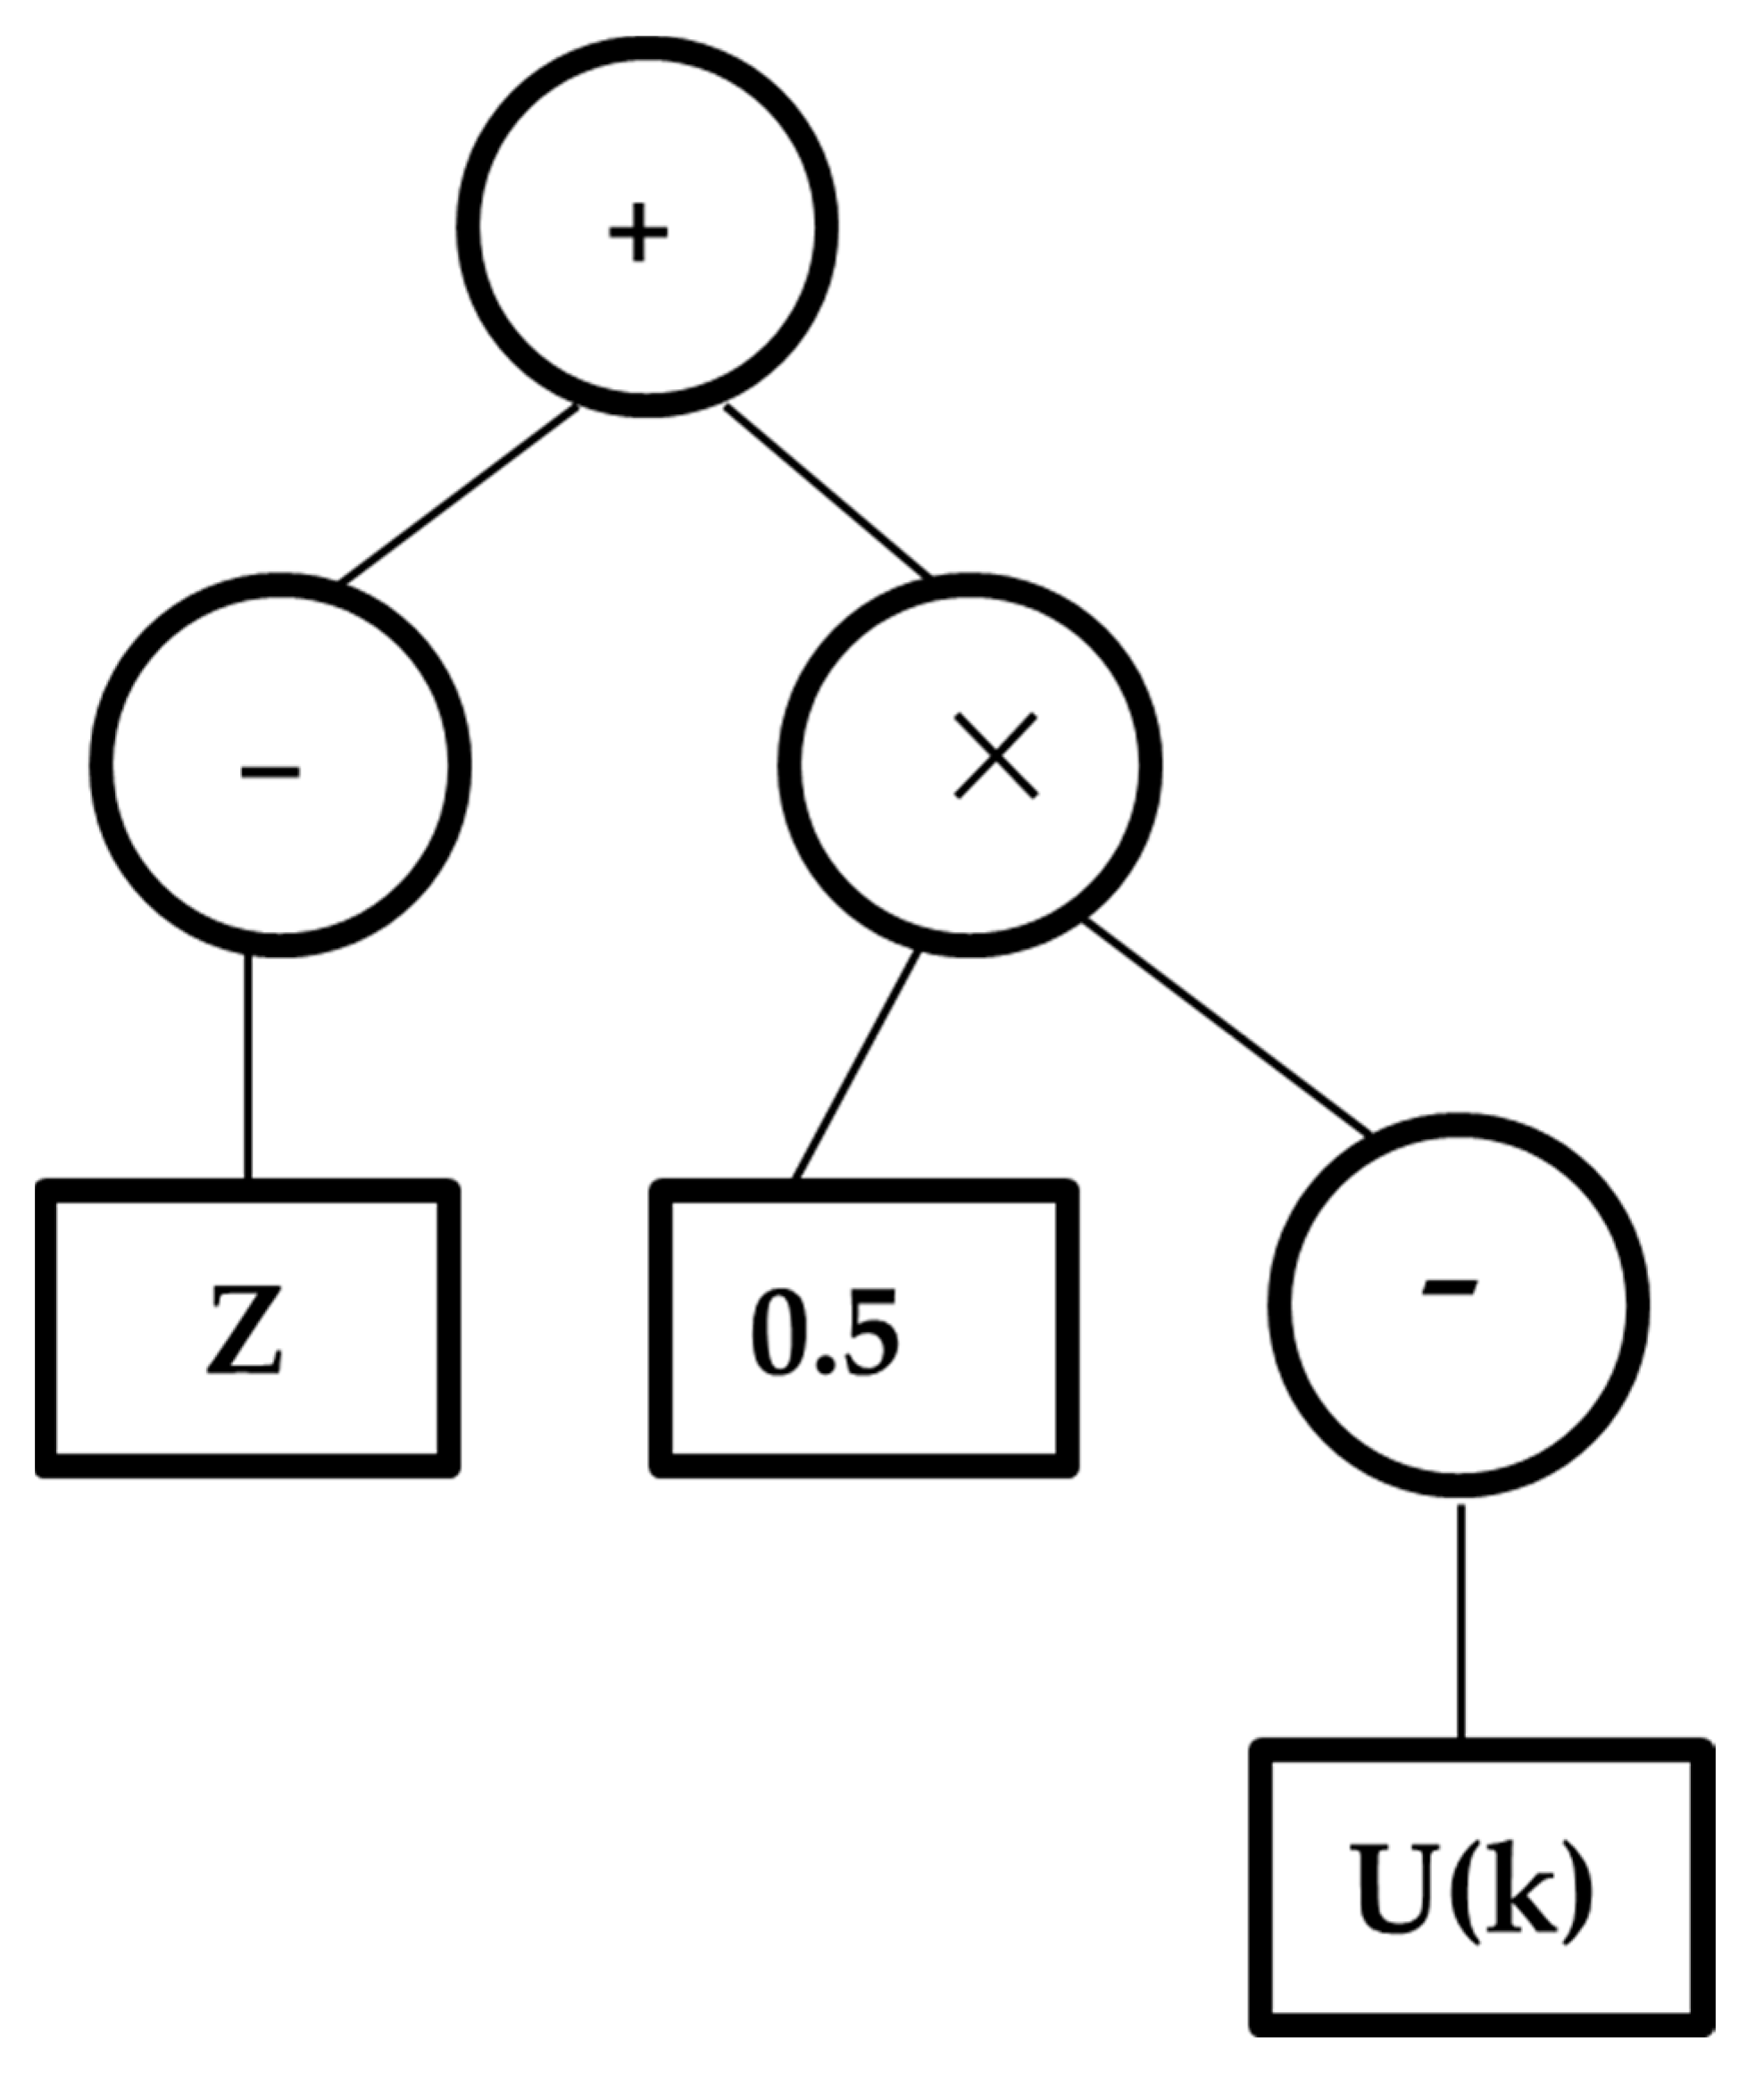
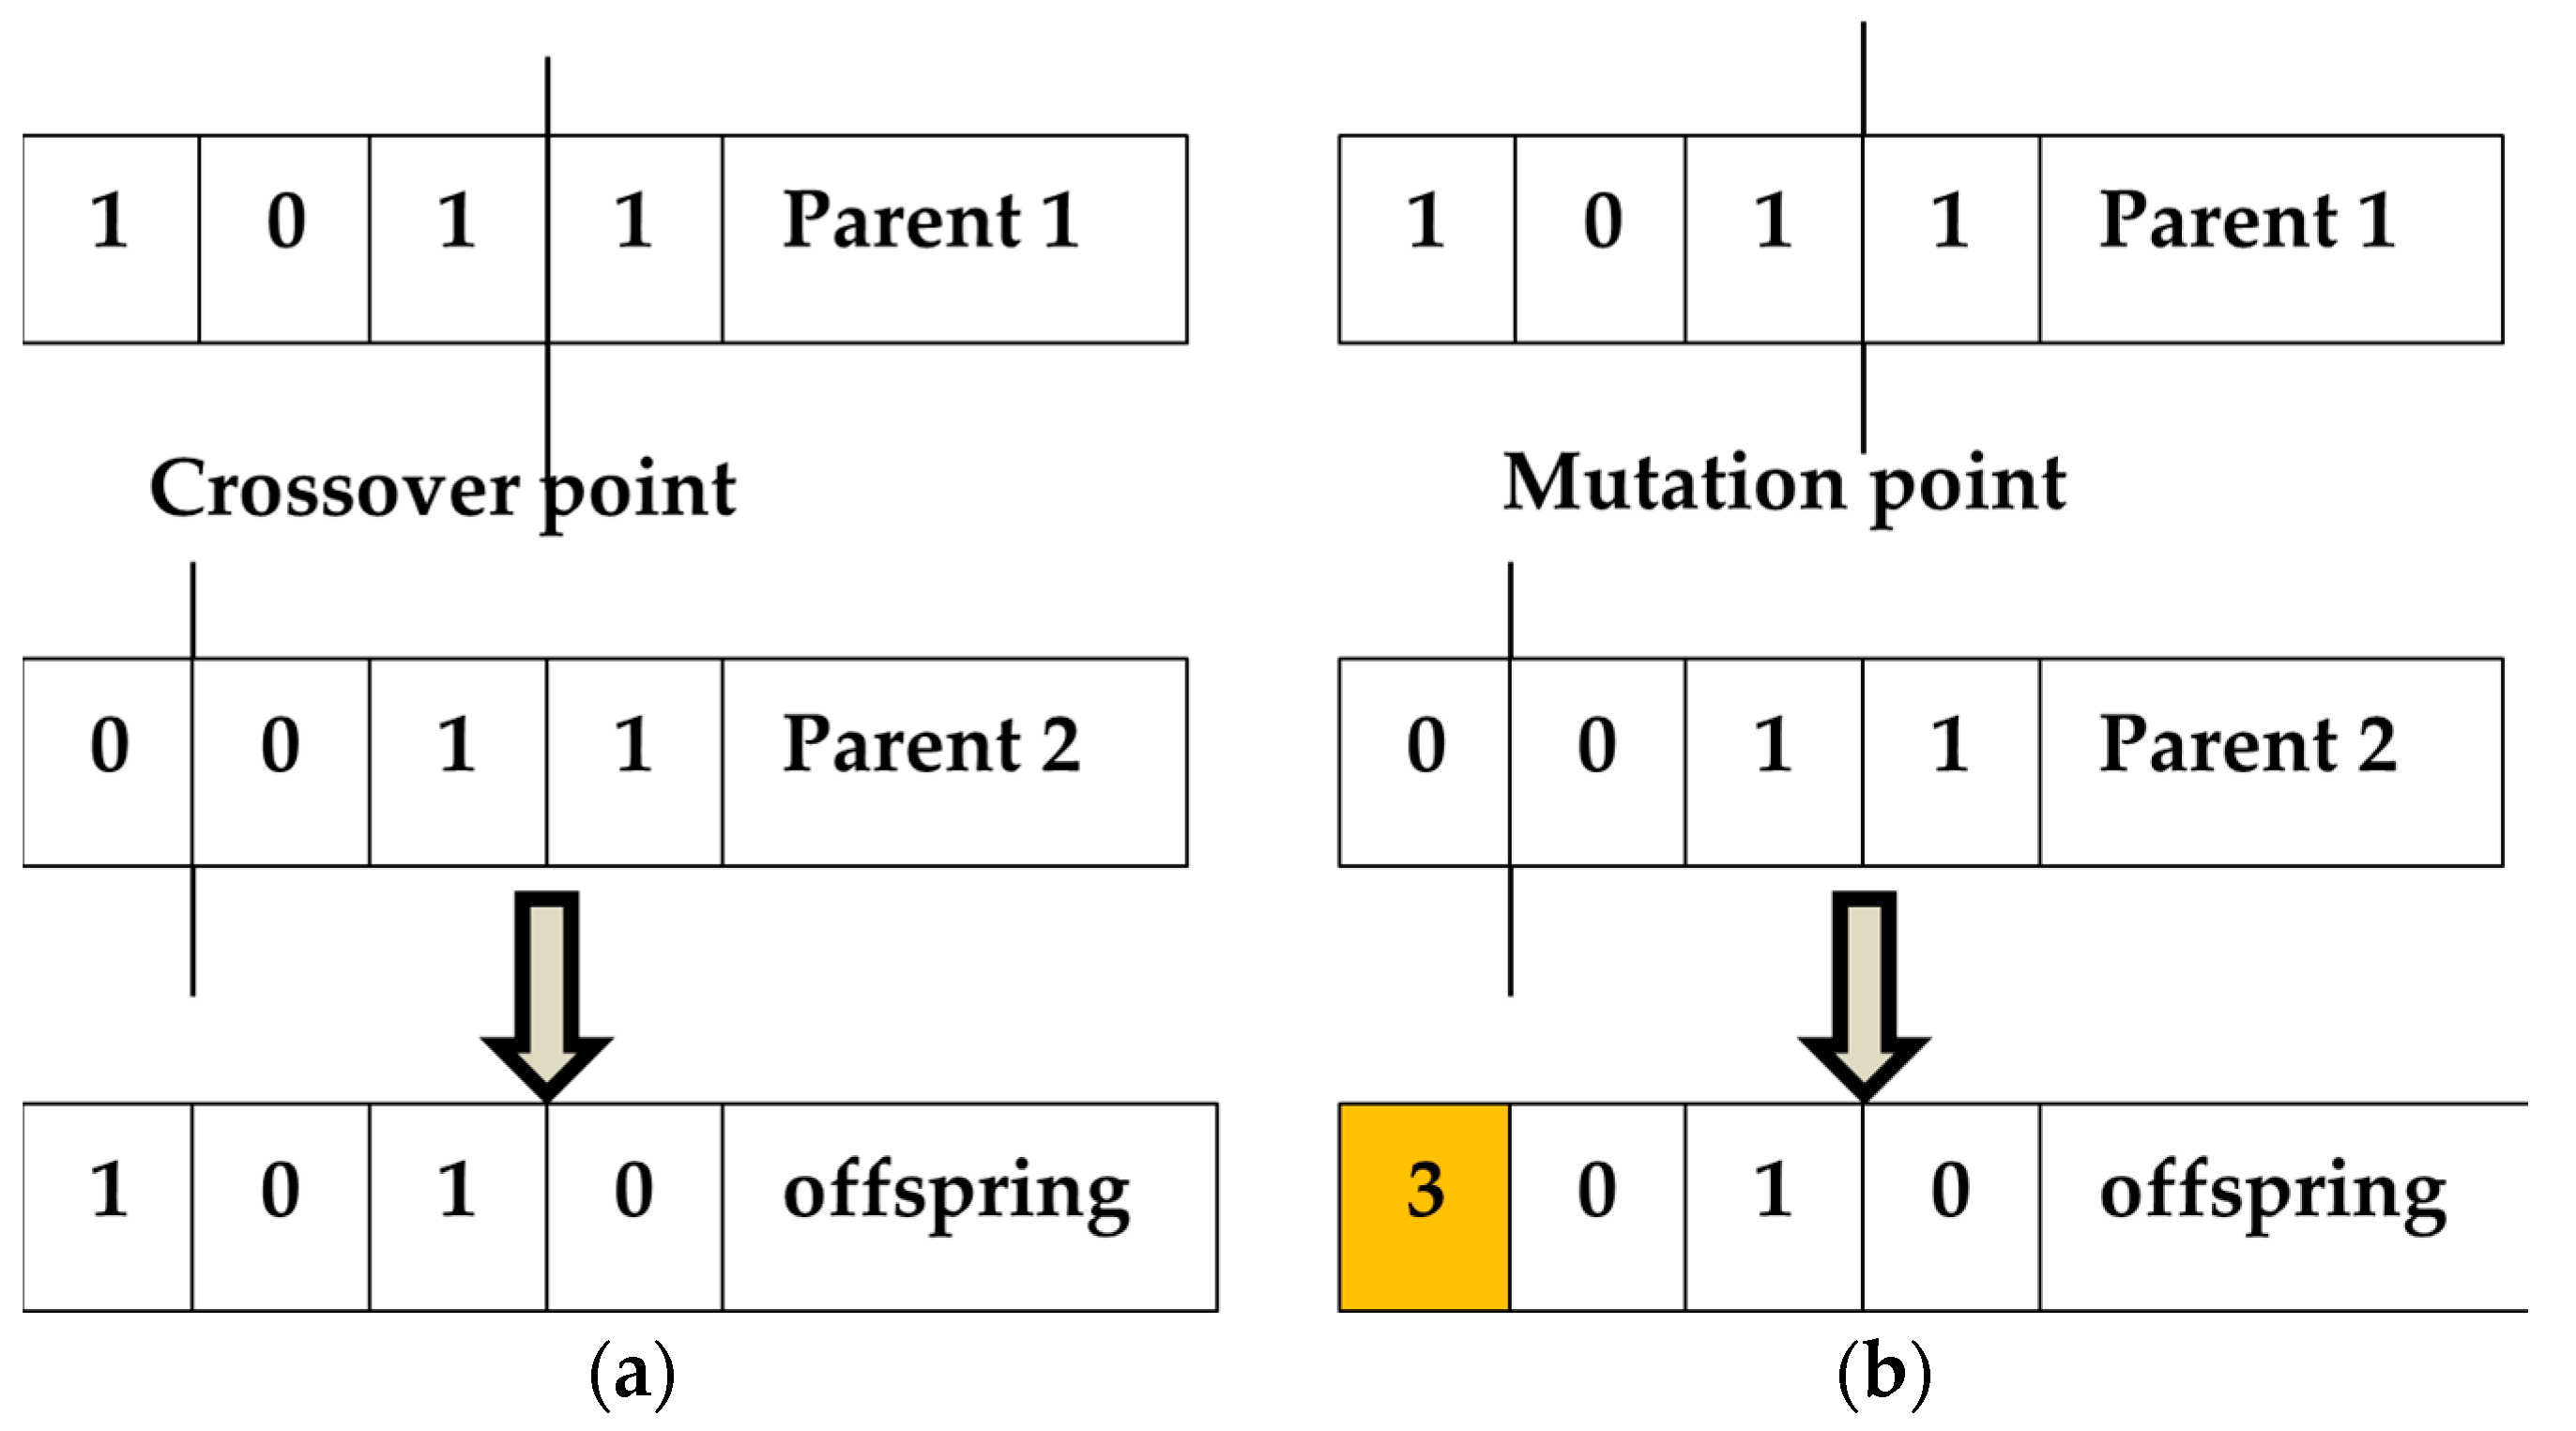
3.1. Genetic Programming (GP)

Evolutionary algorithms arose from biological evolution processes which figured out issues by executing the idea of natural selection to a population of individuals with the anticipation of the fittest model. Genetic Algorithm (GA) is one of the evolutionary algorithms which comprises reproduction as a tactic for yielding the better offspring with good fitness using the leading genetic operators. GP is the subsection of GA, and hence the principles of GP is homogenous as of GA. GP consists of hierarchical tree-like patterns with prior functions and terminal nodes. The following Figure 5 shows the conventional tree structure of the GP.
The following steps define the typical technical procedure adopted by the GP model [83]:
Stage 1: Initially, the beginning populations are formed randomly, and the formation of establishing the random trees can be achieved by full and grow strategies. Ref. [20] proposed ramped half-and-half method for population initialization by partially full and partially grows methods.
Stage 2: The developed tree was assessed by the fitness function, which forecasts how a solution works on the issue. The solutions with greater precision are nominated as parents for breeding in the process of evolution.
Stage 3: In every recurrence, two trees are chosen as better parents for producing the offspring by genetic operations, such as crossover and mutation. Technically, the crossover randomly determines the crossover point in every parent tree. Offspring trees were generated by splicing together at the crossover point, whereas mutation with the same process deputize a new randomly formed subtree which modifies the GP tree. The pictorial representations of crossover and mutation are depicted in the following Figure 6a,b.
Stage 4: The above stages 2 to 3 are recapitulated until specified requirements have been met.
The above are the procedures of GP. The adopted dataset has been incorporated in the developed GP model. MATLAB was the software package adopted to develop the machine learning models.

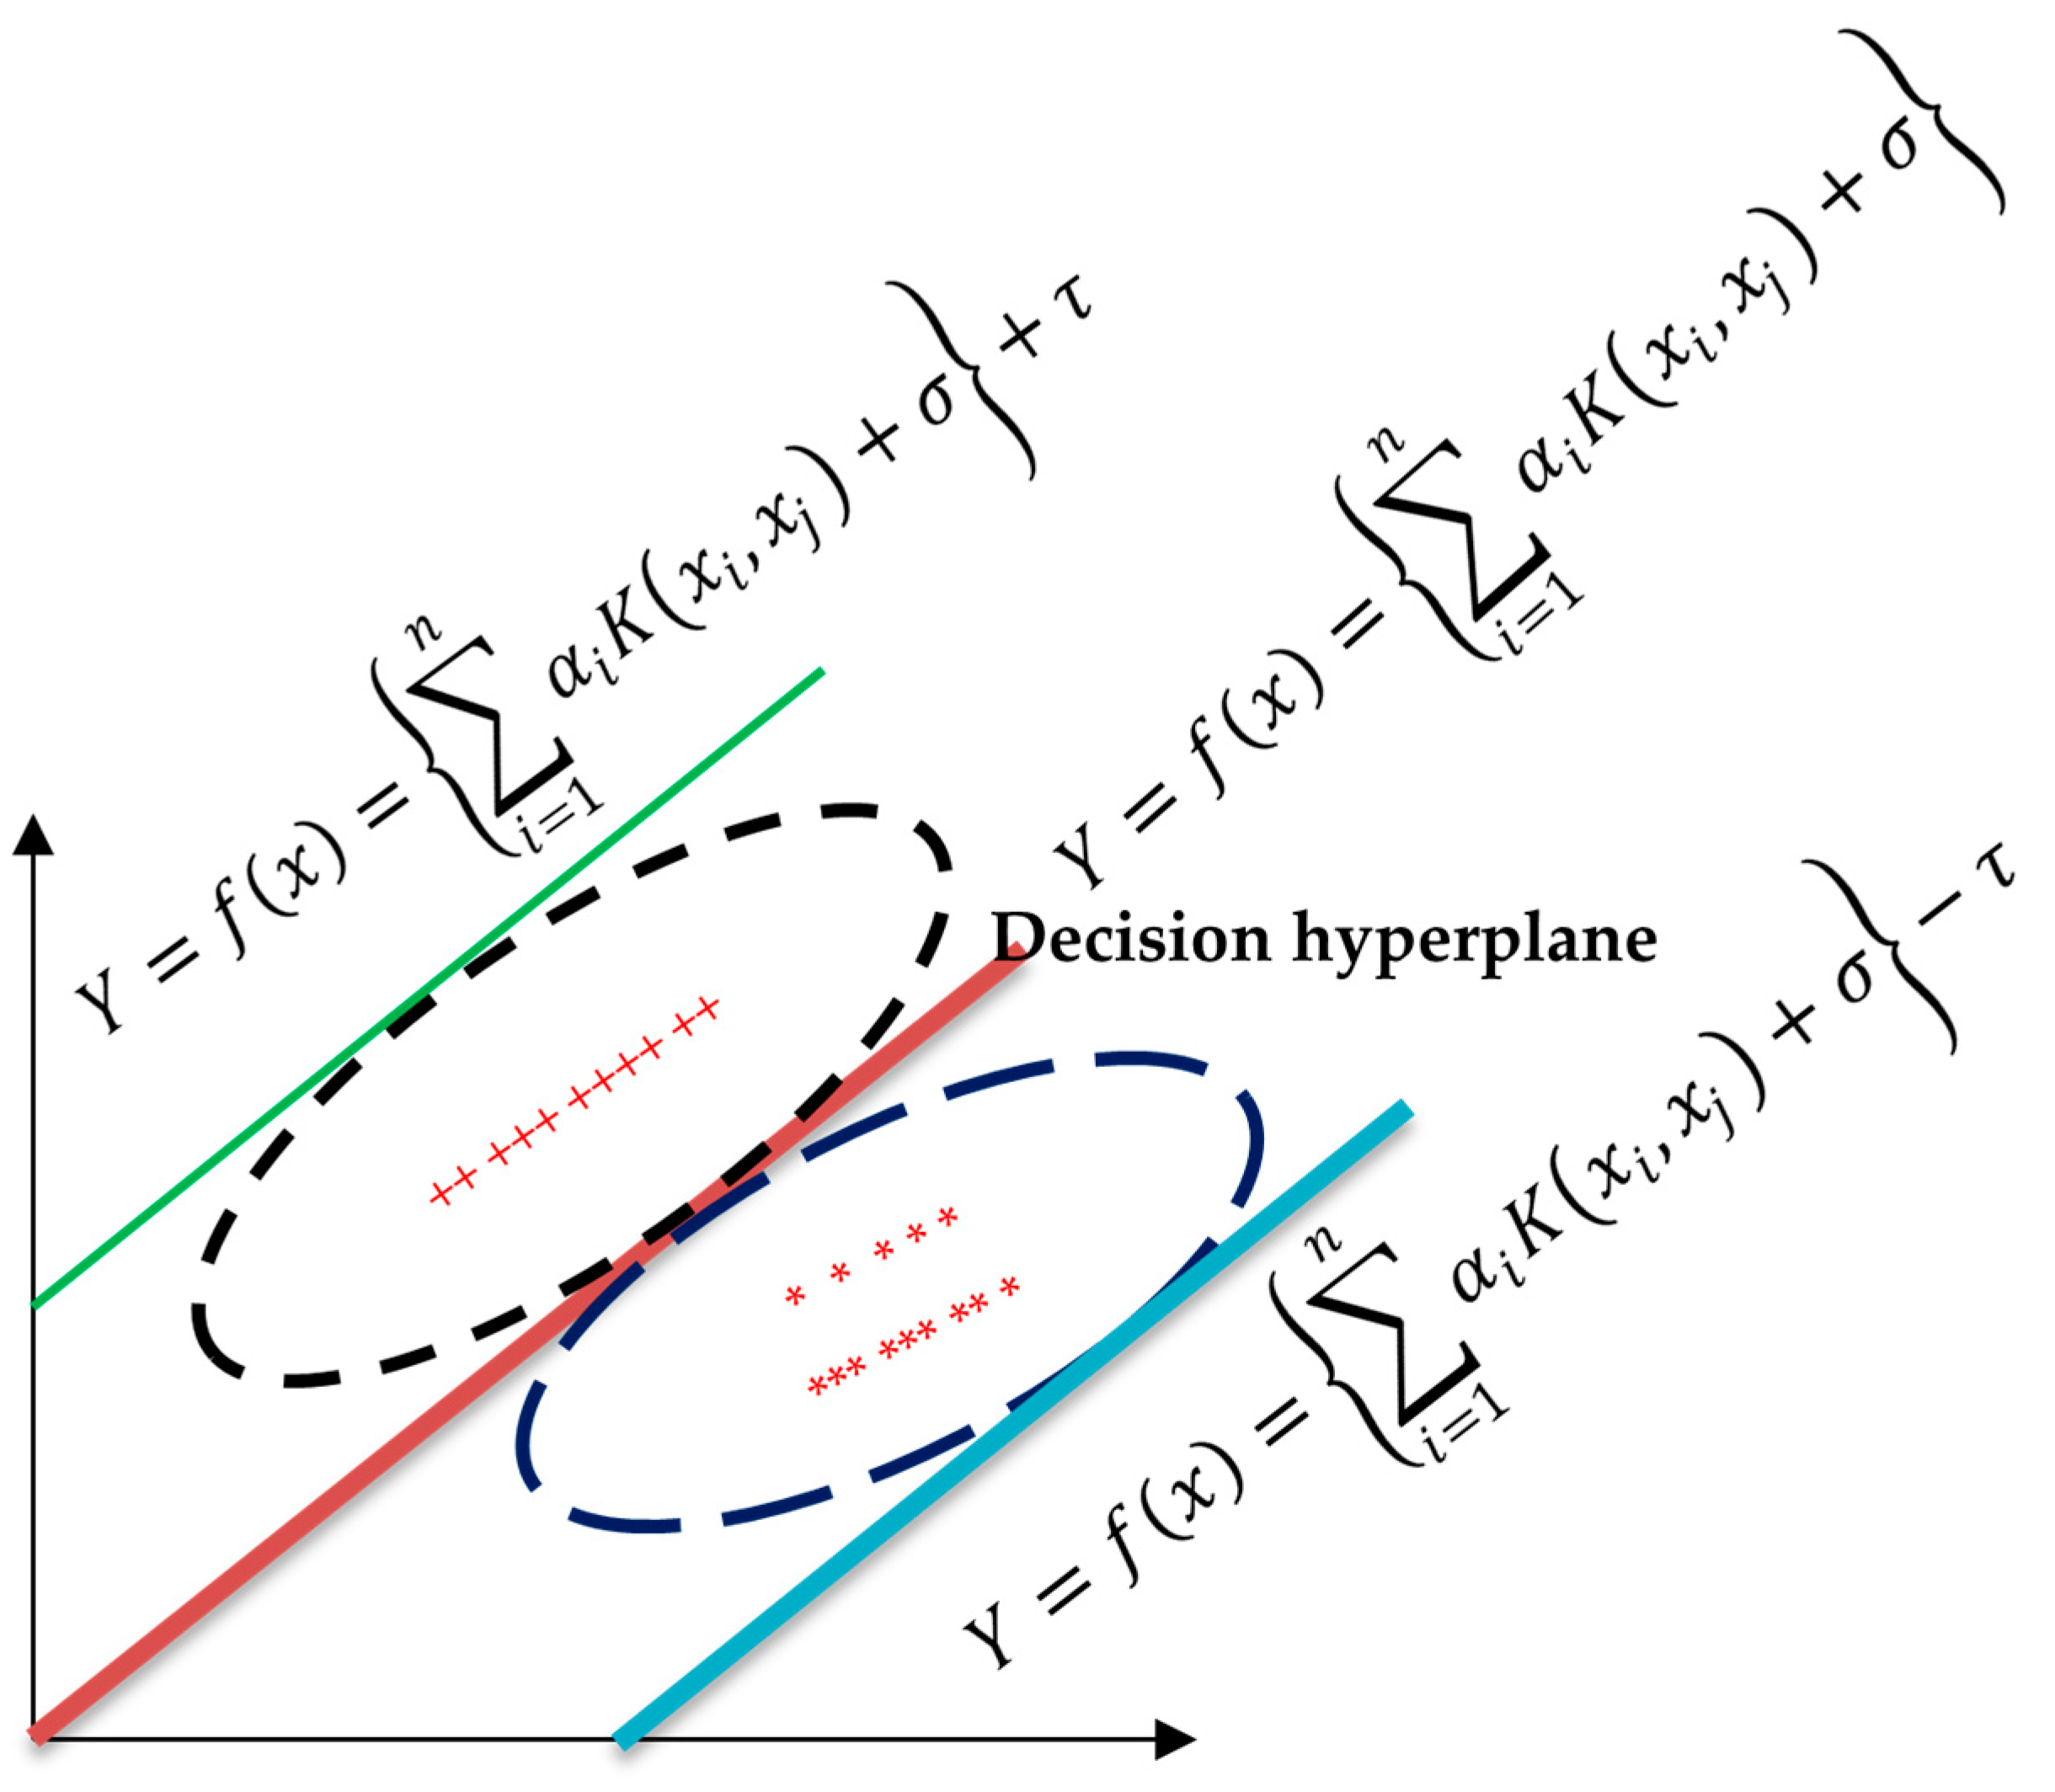
3.2. Minimax Probability Machine Regression (MPMR)

MPMR is one of the intelligent machine learning models proposed by [29] that reduces the maximal probability of a test sample being mismatched. The core idea is to depress the upper limit of the misclassification probability with respect to any choice of class conditional dissemination that indulge the constraints. The following Figure 7 represents a typical MPMR deciding the hyperplane for segregating the data.
The regression surface, which is the area in between the lower and the upper limit of probability, determines the space for misclassifying a point without making distributional assumptions by the model [84]. The training dataset was classified into 2 random categories, U and V, assuming that U is formed from the limited dispensation with the means U ¯ and V ¯ and covariance matrices Σ U and Σ V   . They can be defined as U ~ ( U ¯ , Σ U ) and V ~ ( V ¯ , Σ V ) . The main objectives of MPMR are to determine the approximation function f ( x ) and to predict the limits on the minimum probability [29,30]. The MPMR is based on kernel function. Hence, the f ( x ) can also be fabricated by representing the input data to a greater dimensional space by the following Equations (2a) and (2b):
U ω ( U ) ~ ( ω ¯ ( U ) , Σ ω ( U ) )
V ω ( V ) ~ ( ω ¯ ( V ) , Σ ω ( V ) )
Let us consider c as the slope of the hyperplane, and σ is the bisecting term of the hyperplane, therefore
c T ω ( x ) = σ
The ordinary least squares method symmetrically reduces the total sum of squared residuals, but it can be utilized for linear and non-linear regressions. According to the kernel method K ( x i , x j ) = ω ( x i ) ω ( x j ) , we can avoid ω explicitly. MPMR can evaluate the predictive power of a regression function by a bound on the least probability, which represents that data are in true regression function. The Equation (4) provides the true regression function.
Y = f ( x ) = { i = 1 n α i K ( x i , x j ) + σ }  
In order to determine the lateral confinement coefficient of the CFRP-wrapped rectangle and square RC columns, the dataset that was utilized for the GP model is incorporated into the MPMR model.

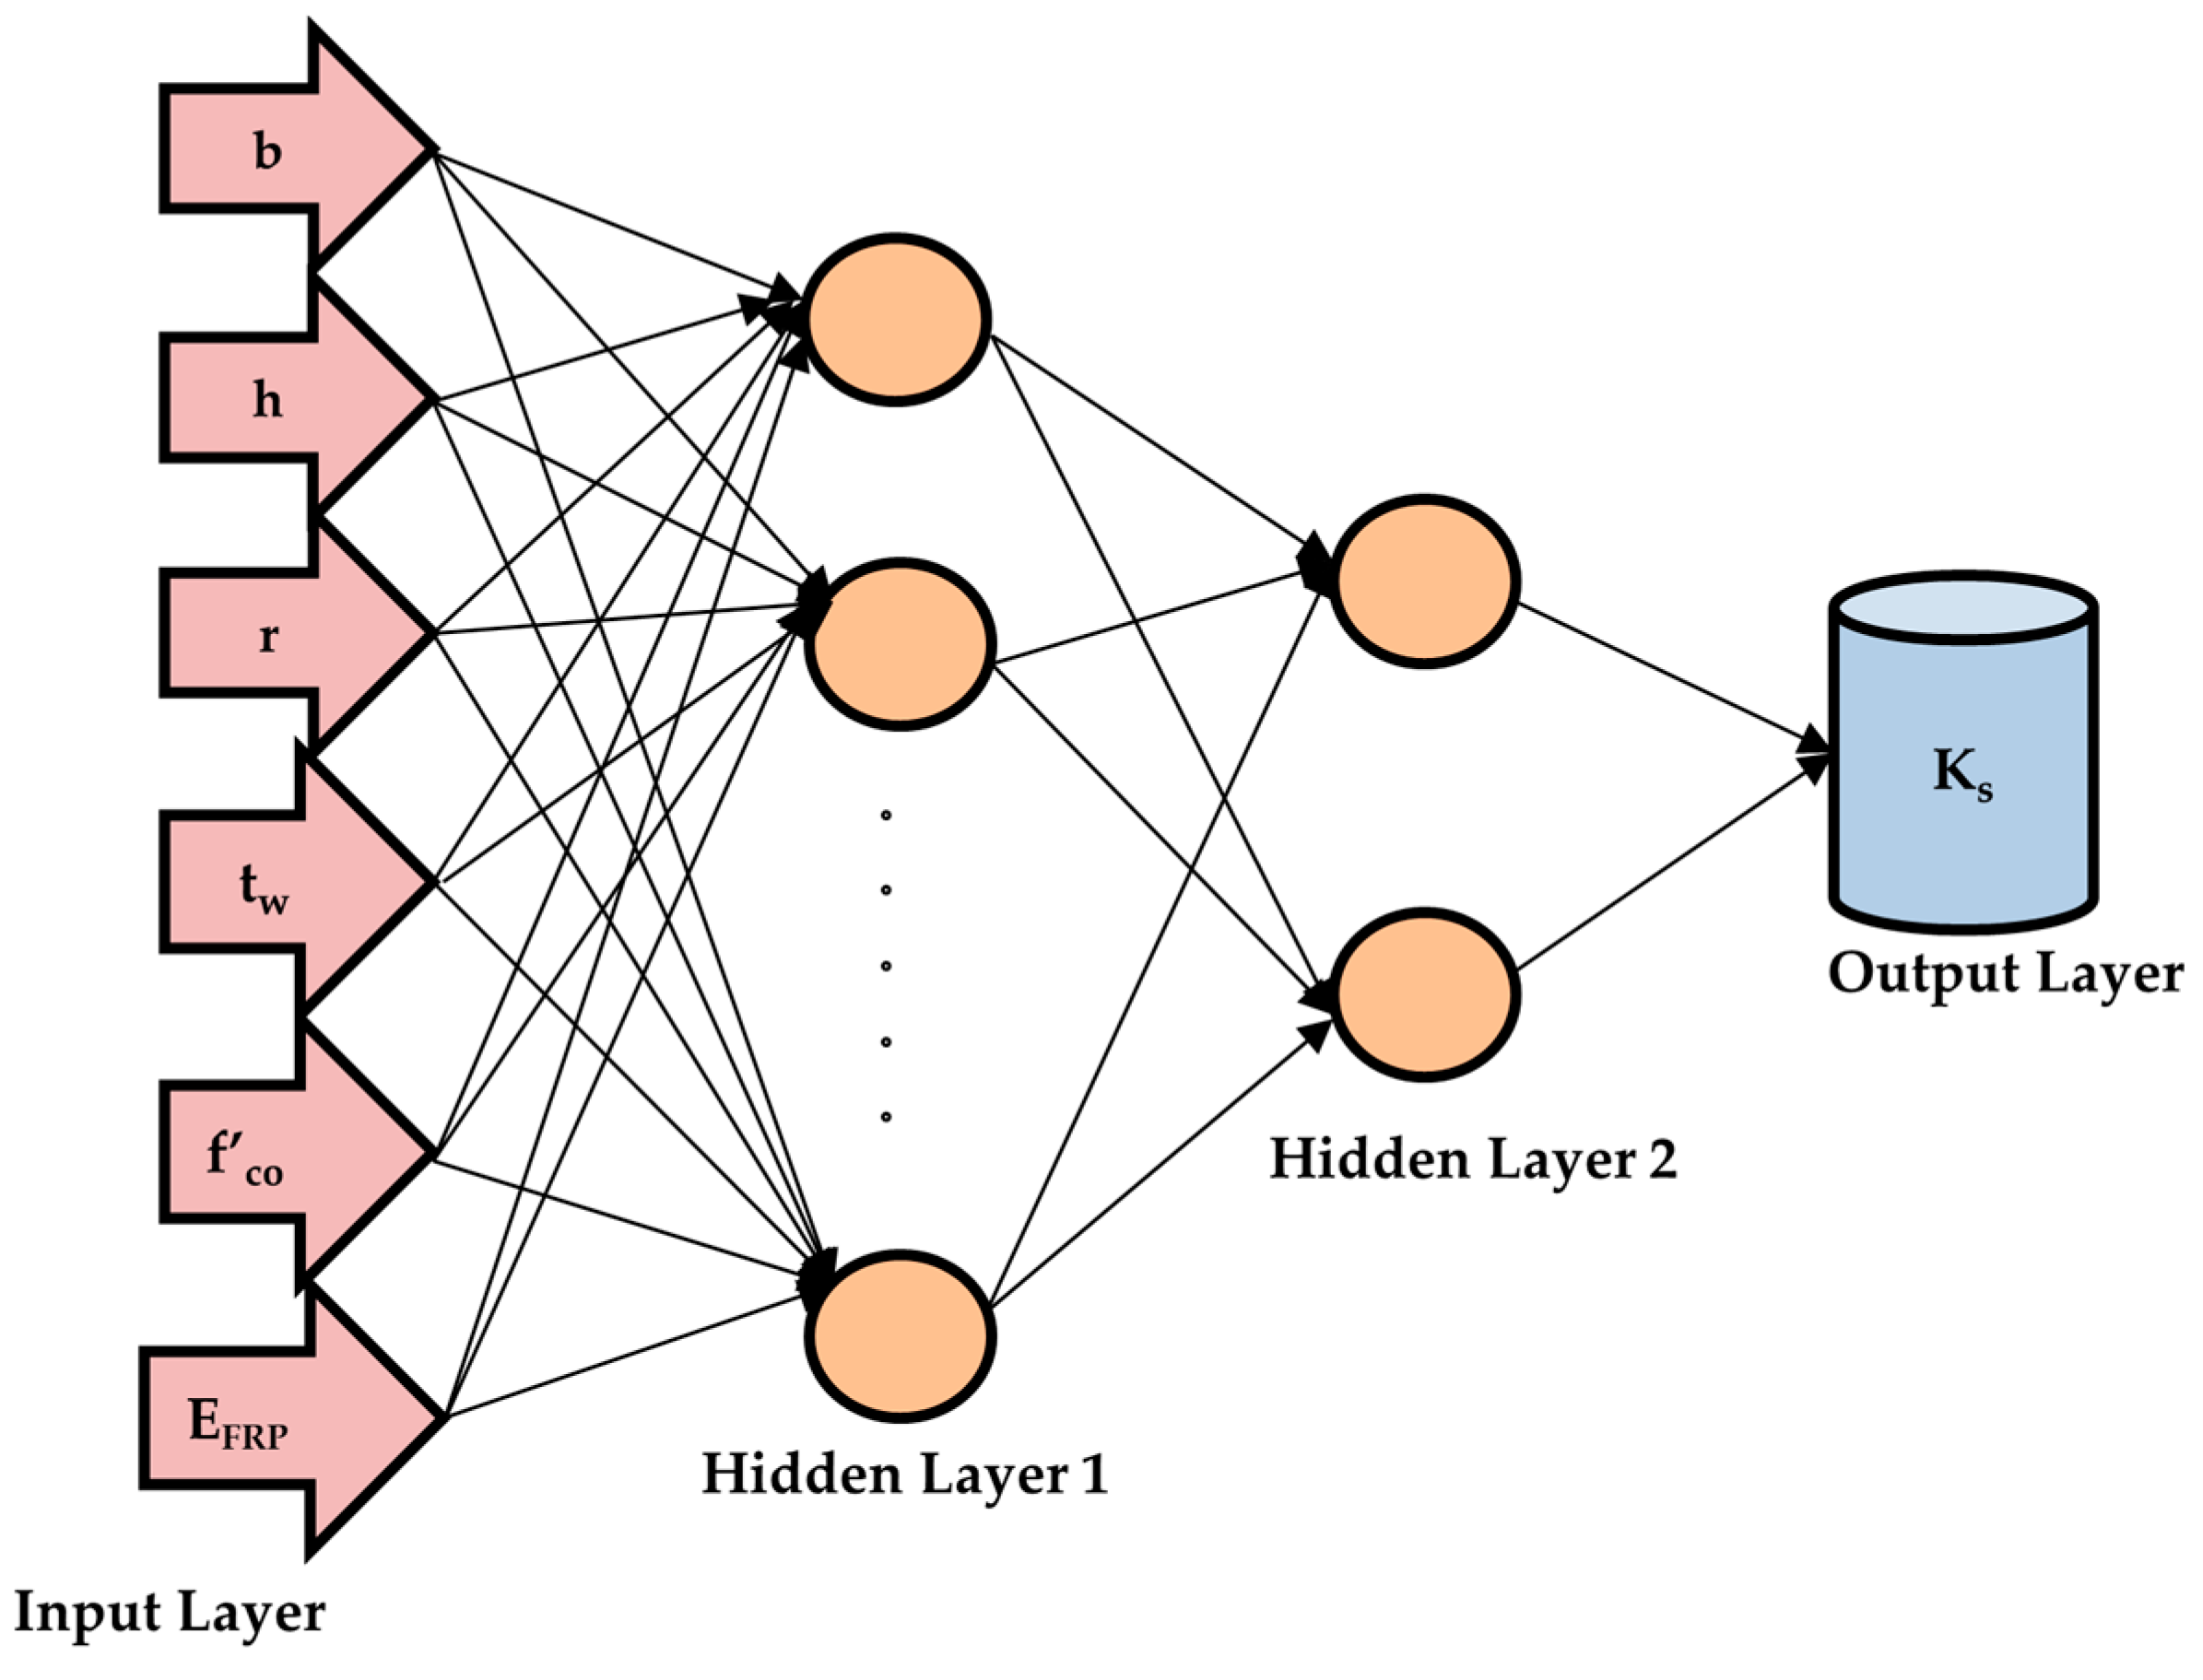
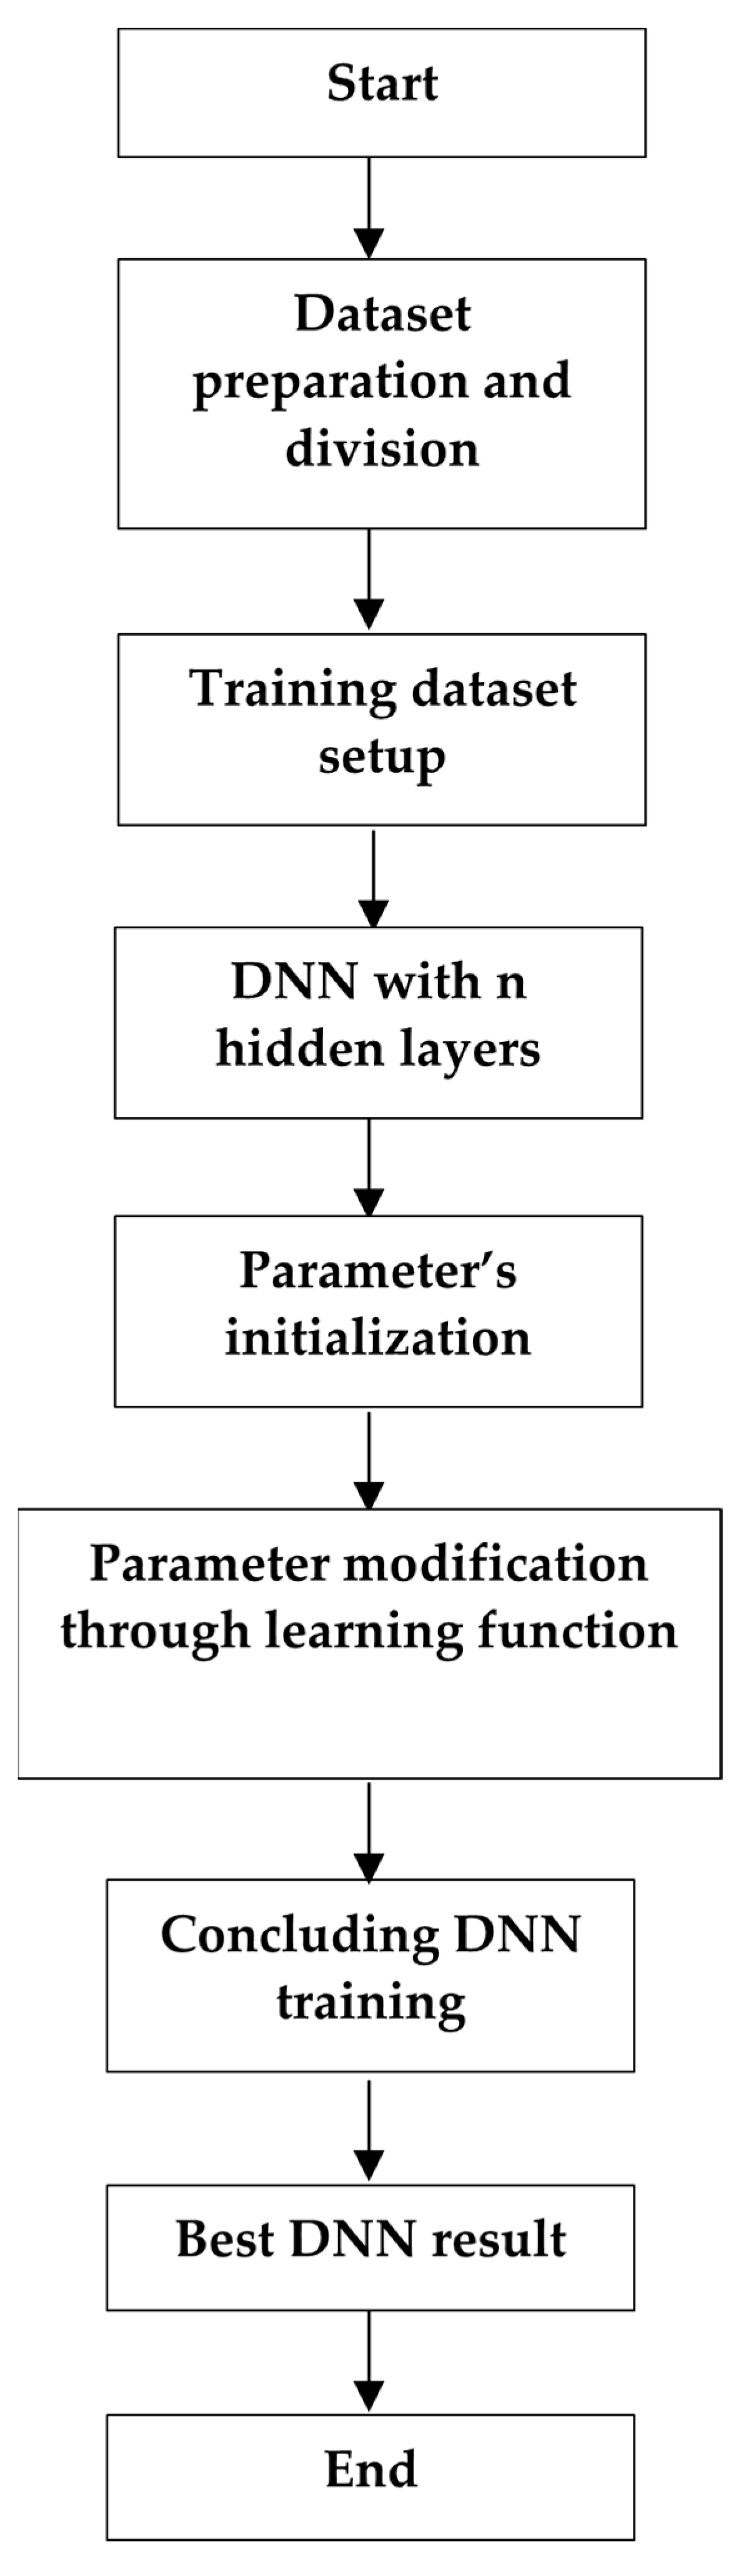
3.3. Deep Neural Network (DNN)

Deep neural network, a machine learning model, was originally proposed by Ref. [85]. The DNN model mimics the techniques of human brain in order to normalize complex and non-linear classification and regression problems. Technically, DNN is comprised of a number of neurons which are arrayed in a series of layer. A neuron is a mathematical unit that consists of 1 or more weighted input connections, with a transfer function that integrates the inputs in its way and connects the output [86]. The following Figure 8 depicts the common DNN structure.
The input data will be incorporated in the input layer, transforming in the hidden layers and finally reaching the output layer as a prediction. The values in all the neurons of hidden and output layers are computed by the activation function multiplied by the weight plus the bias, in which the weights and bias can be modified, based on the errors generated during the prediction or until the errors are minimal [87]. Let us consider the input dataset I with the dimension M × N which is formulated as X = {x(1), x(2), ….x(M)} ∈RN, where N and M represent the length and number of samples. In this feature, learning and understanding the expression of input data can be given as
h ( x ( i ) , W , b ) = ξ ( W x ( i ) + b ) ,   i = 1 , M )
and the output layer function can be expressed as
O u t p u t   l a y e r = ξ ( W T h ( x ( i ) + b ) + c
The activation function aj (x) of the j th hidden layer can be expressed as follows
a = a j ( W X + b )
where W represents the weight of input feature and indicates the bias. Using this presumption, the mean weight of activation function can be depicted as
δ j = 1 n i = 1 n [ a j ( x ( i ) ) ]
During the preliminary stage of training the DNN, average activation function is presumed to be 0 due to the idleness of the neurons. The penalty (P) can be implemented to the average activation function if it deviates from the substantial value of average activation function, which can be expressed as:
P = j = 1 s K L ( δ δ j )
where s represents the total number of neurons in the hidden layer
K L ( δ δ j ) = δ l o g δ δ j + ( 1 δ ) l o g 1 δ 1 δ j
The determination of cost function (C), W and b is a significant task since these parameters are directly proportional to each other. The optimization problem can be resolved by using back-propagation approach by modifying the values of W and b recurrently.
C ( W , b ) = ( W , B ) + β j = 1 s K L ( δ δ j )
W i j ( l ) = W i j ( l ) ϑ ψ ψ W i j ( l ) C ( W , b )
b i ( l ) = b i ( l ) ϑ ψ ψ b i ( l ) C ( W , b )
where β is the weight of penalty; ϑ depicts the learning rate of the adopted DNN [88]. The upcoming Figure 9 shows the technical procedure of the adopted DNN model.
The DNN also adopts the same dataset utilized for GP and the MPMR model.

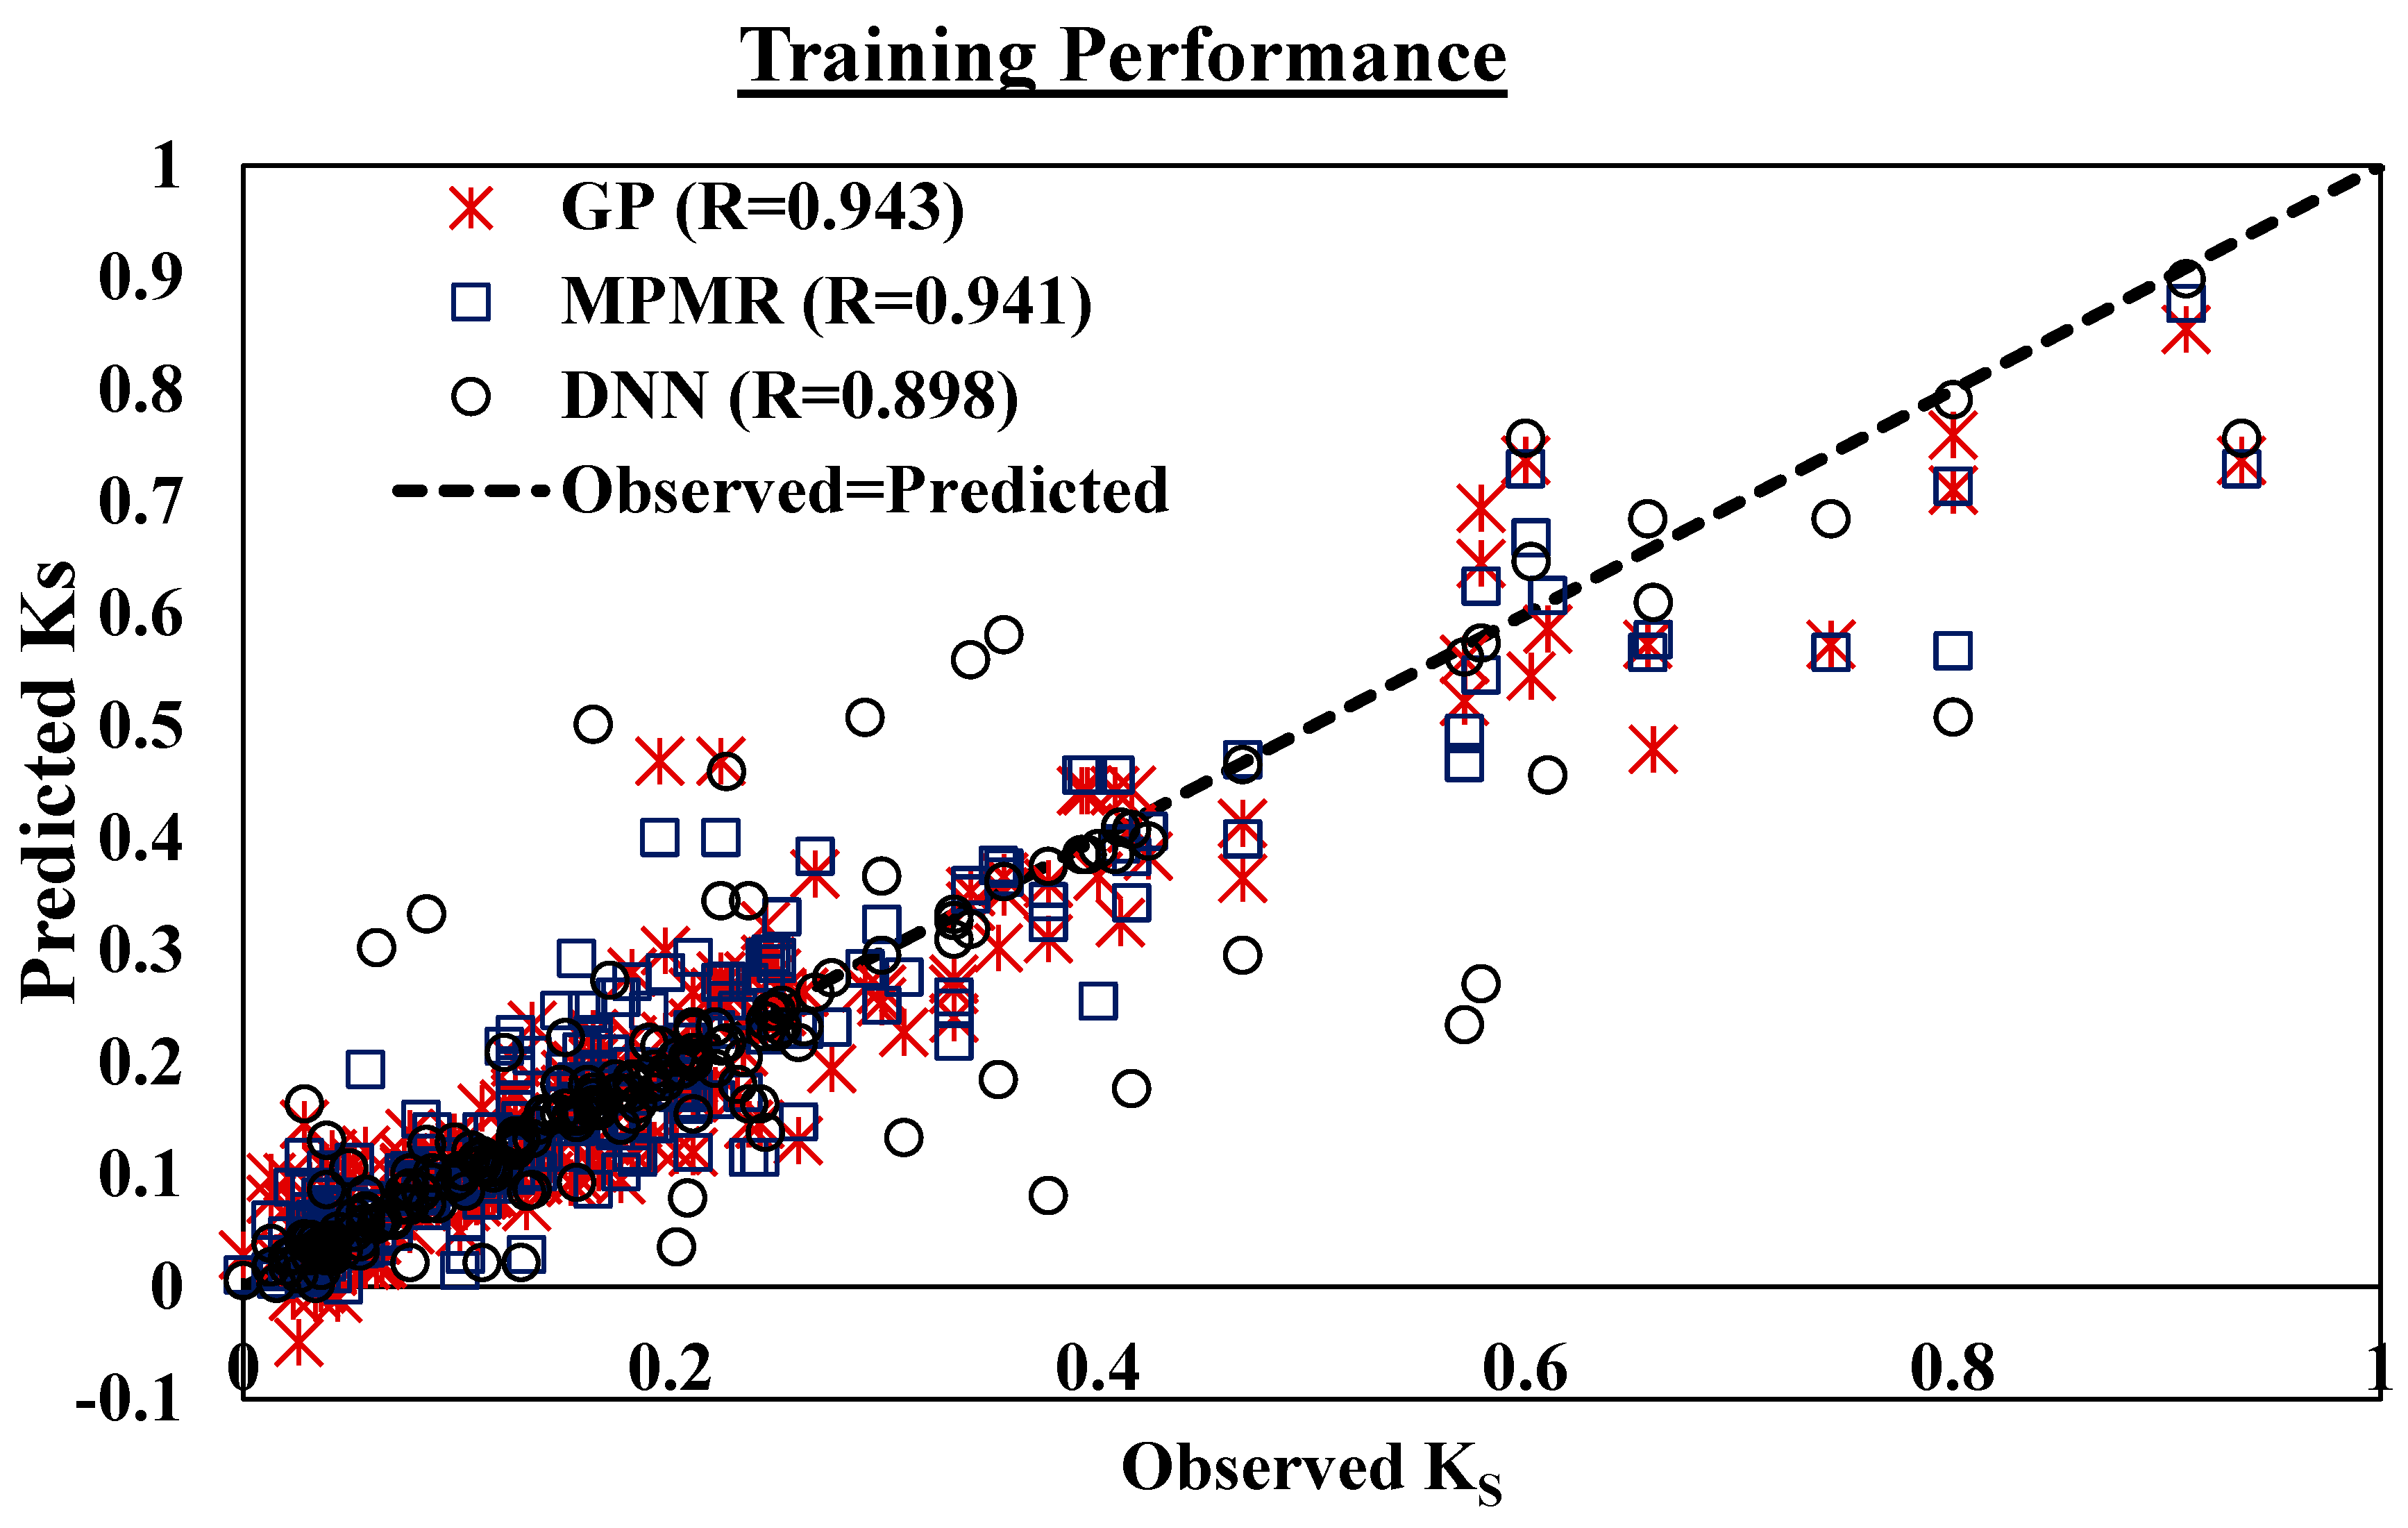
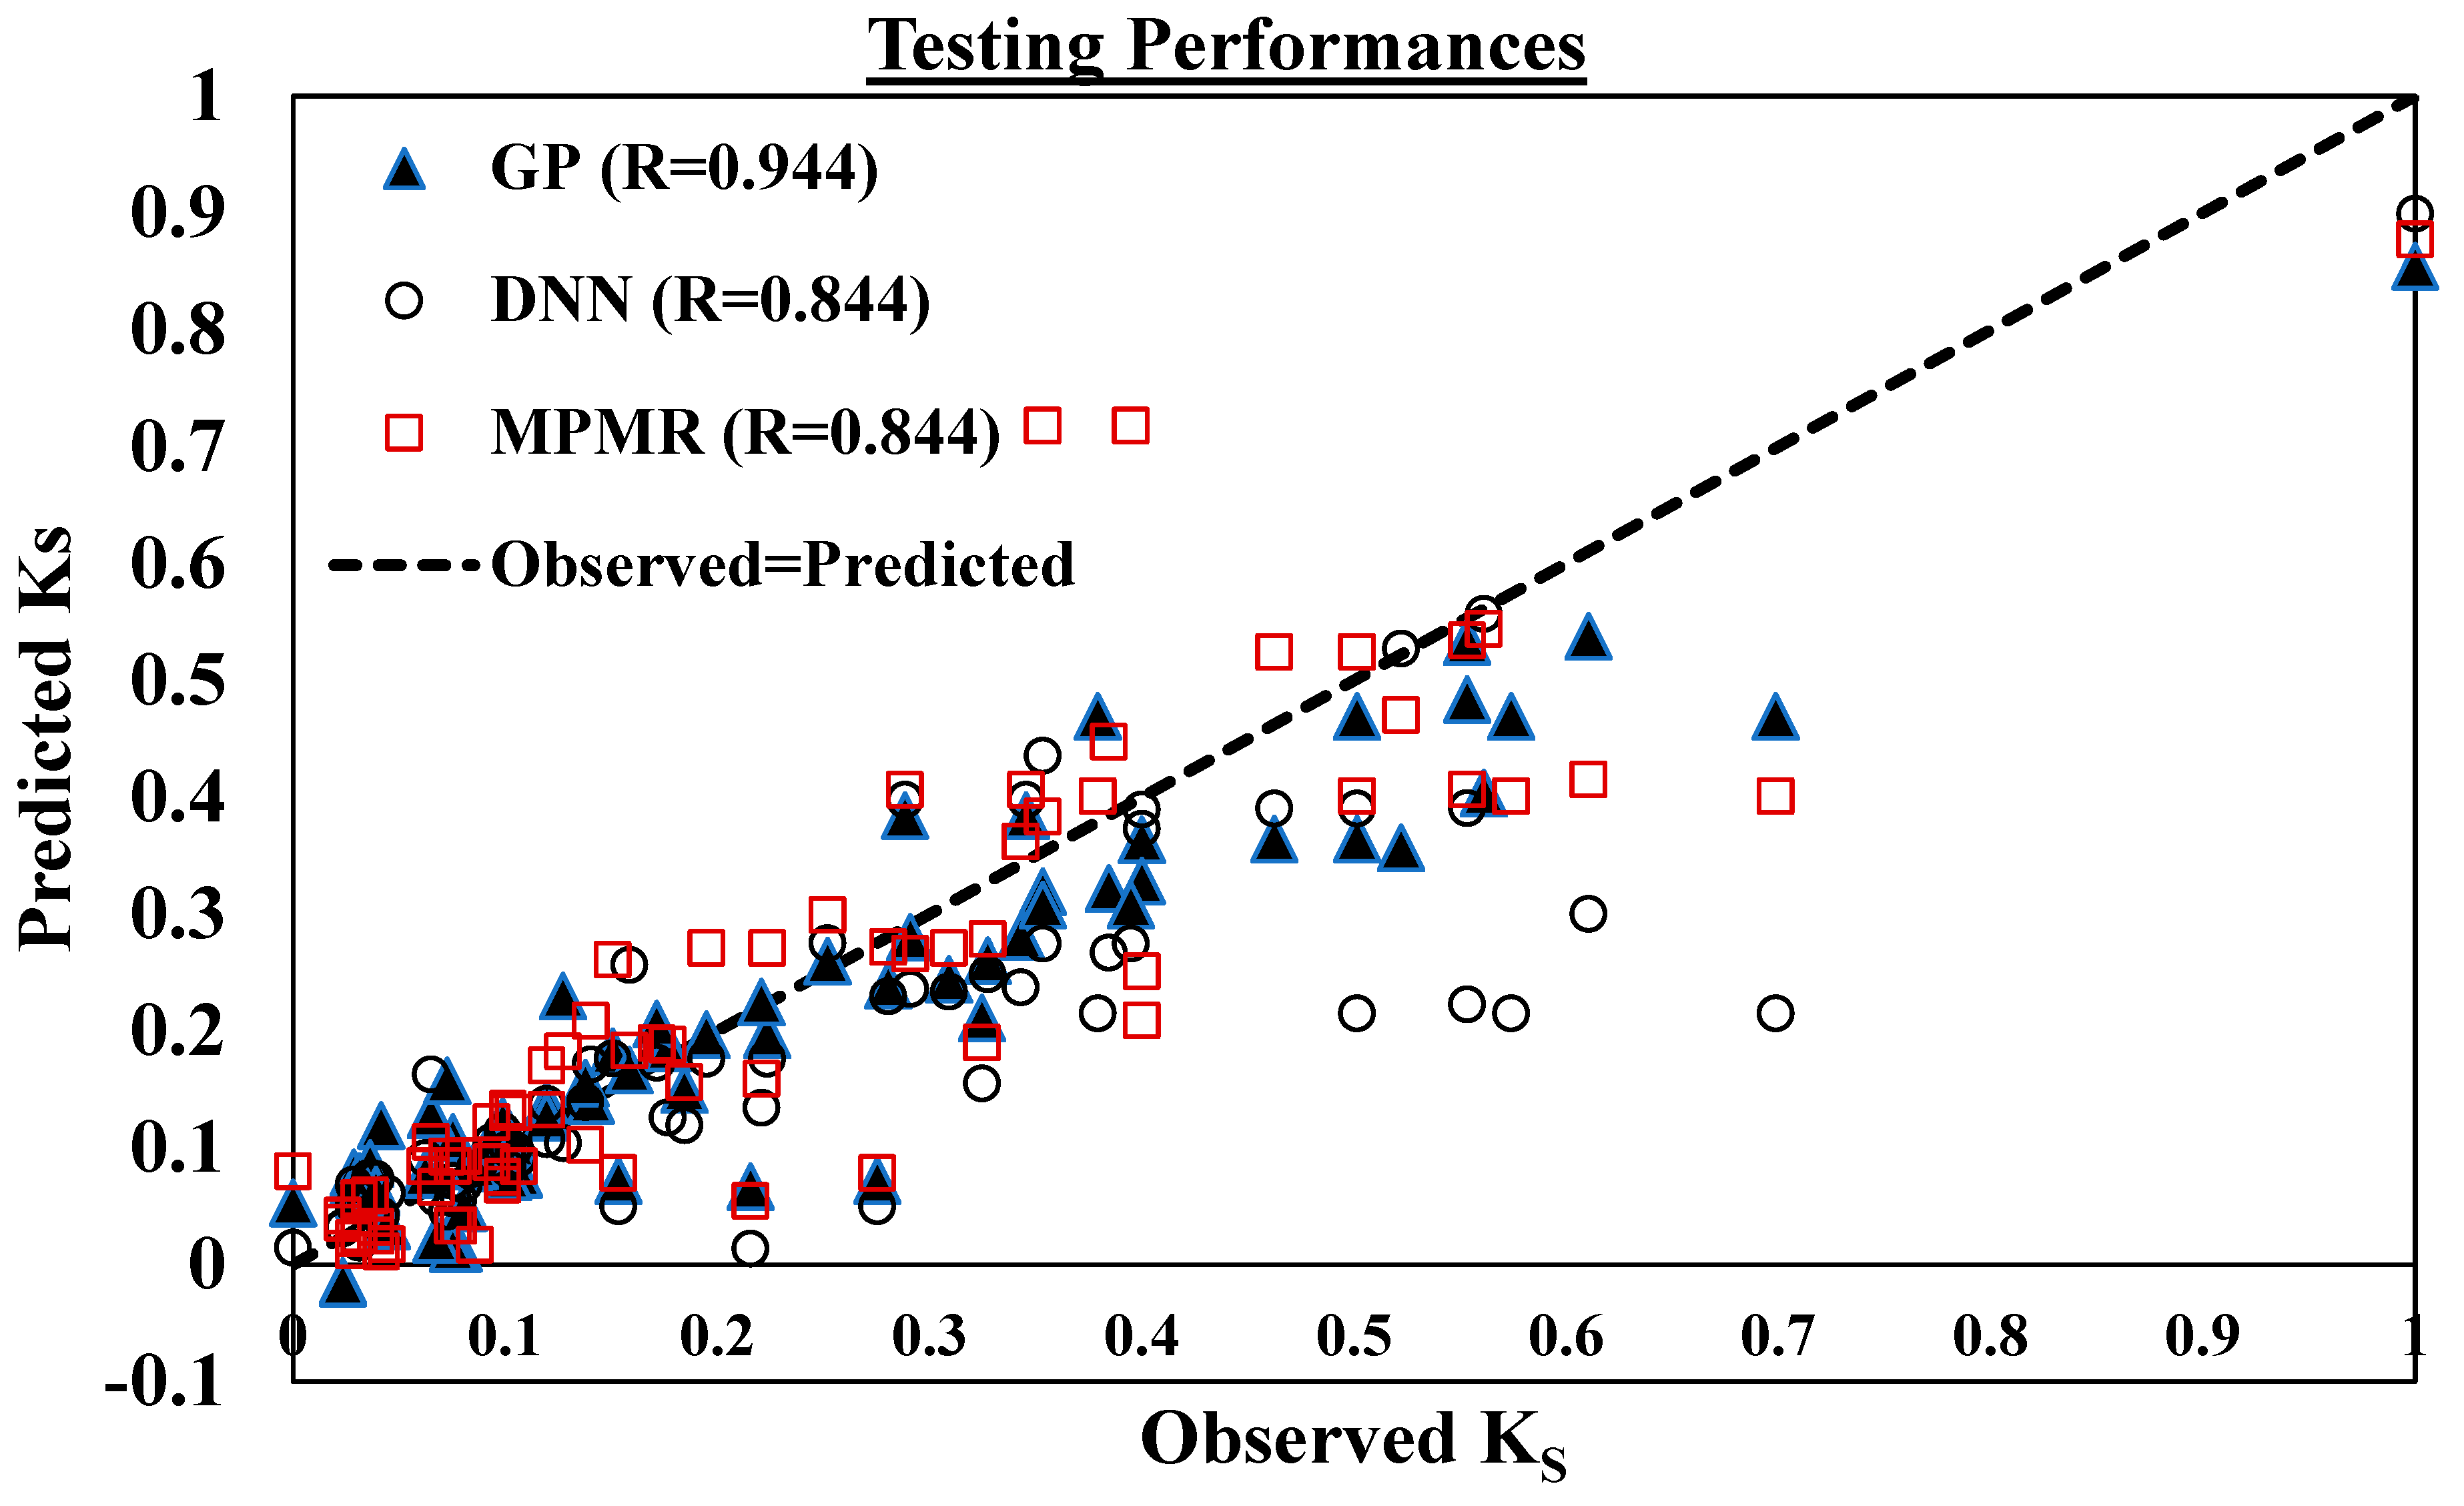
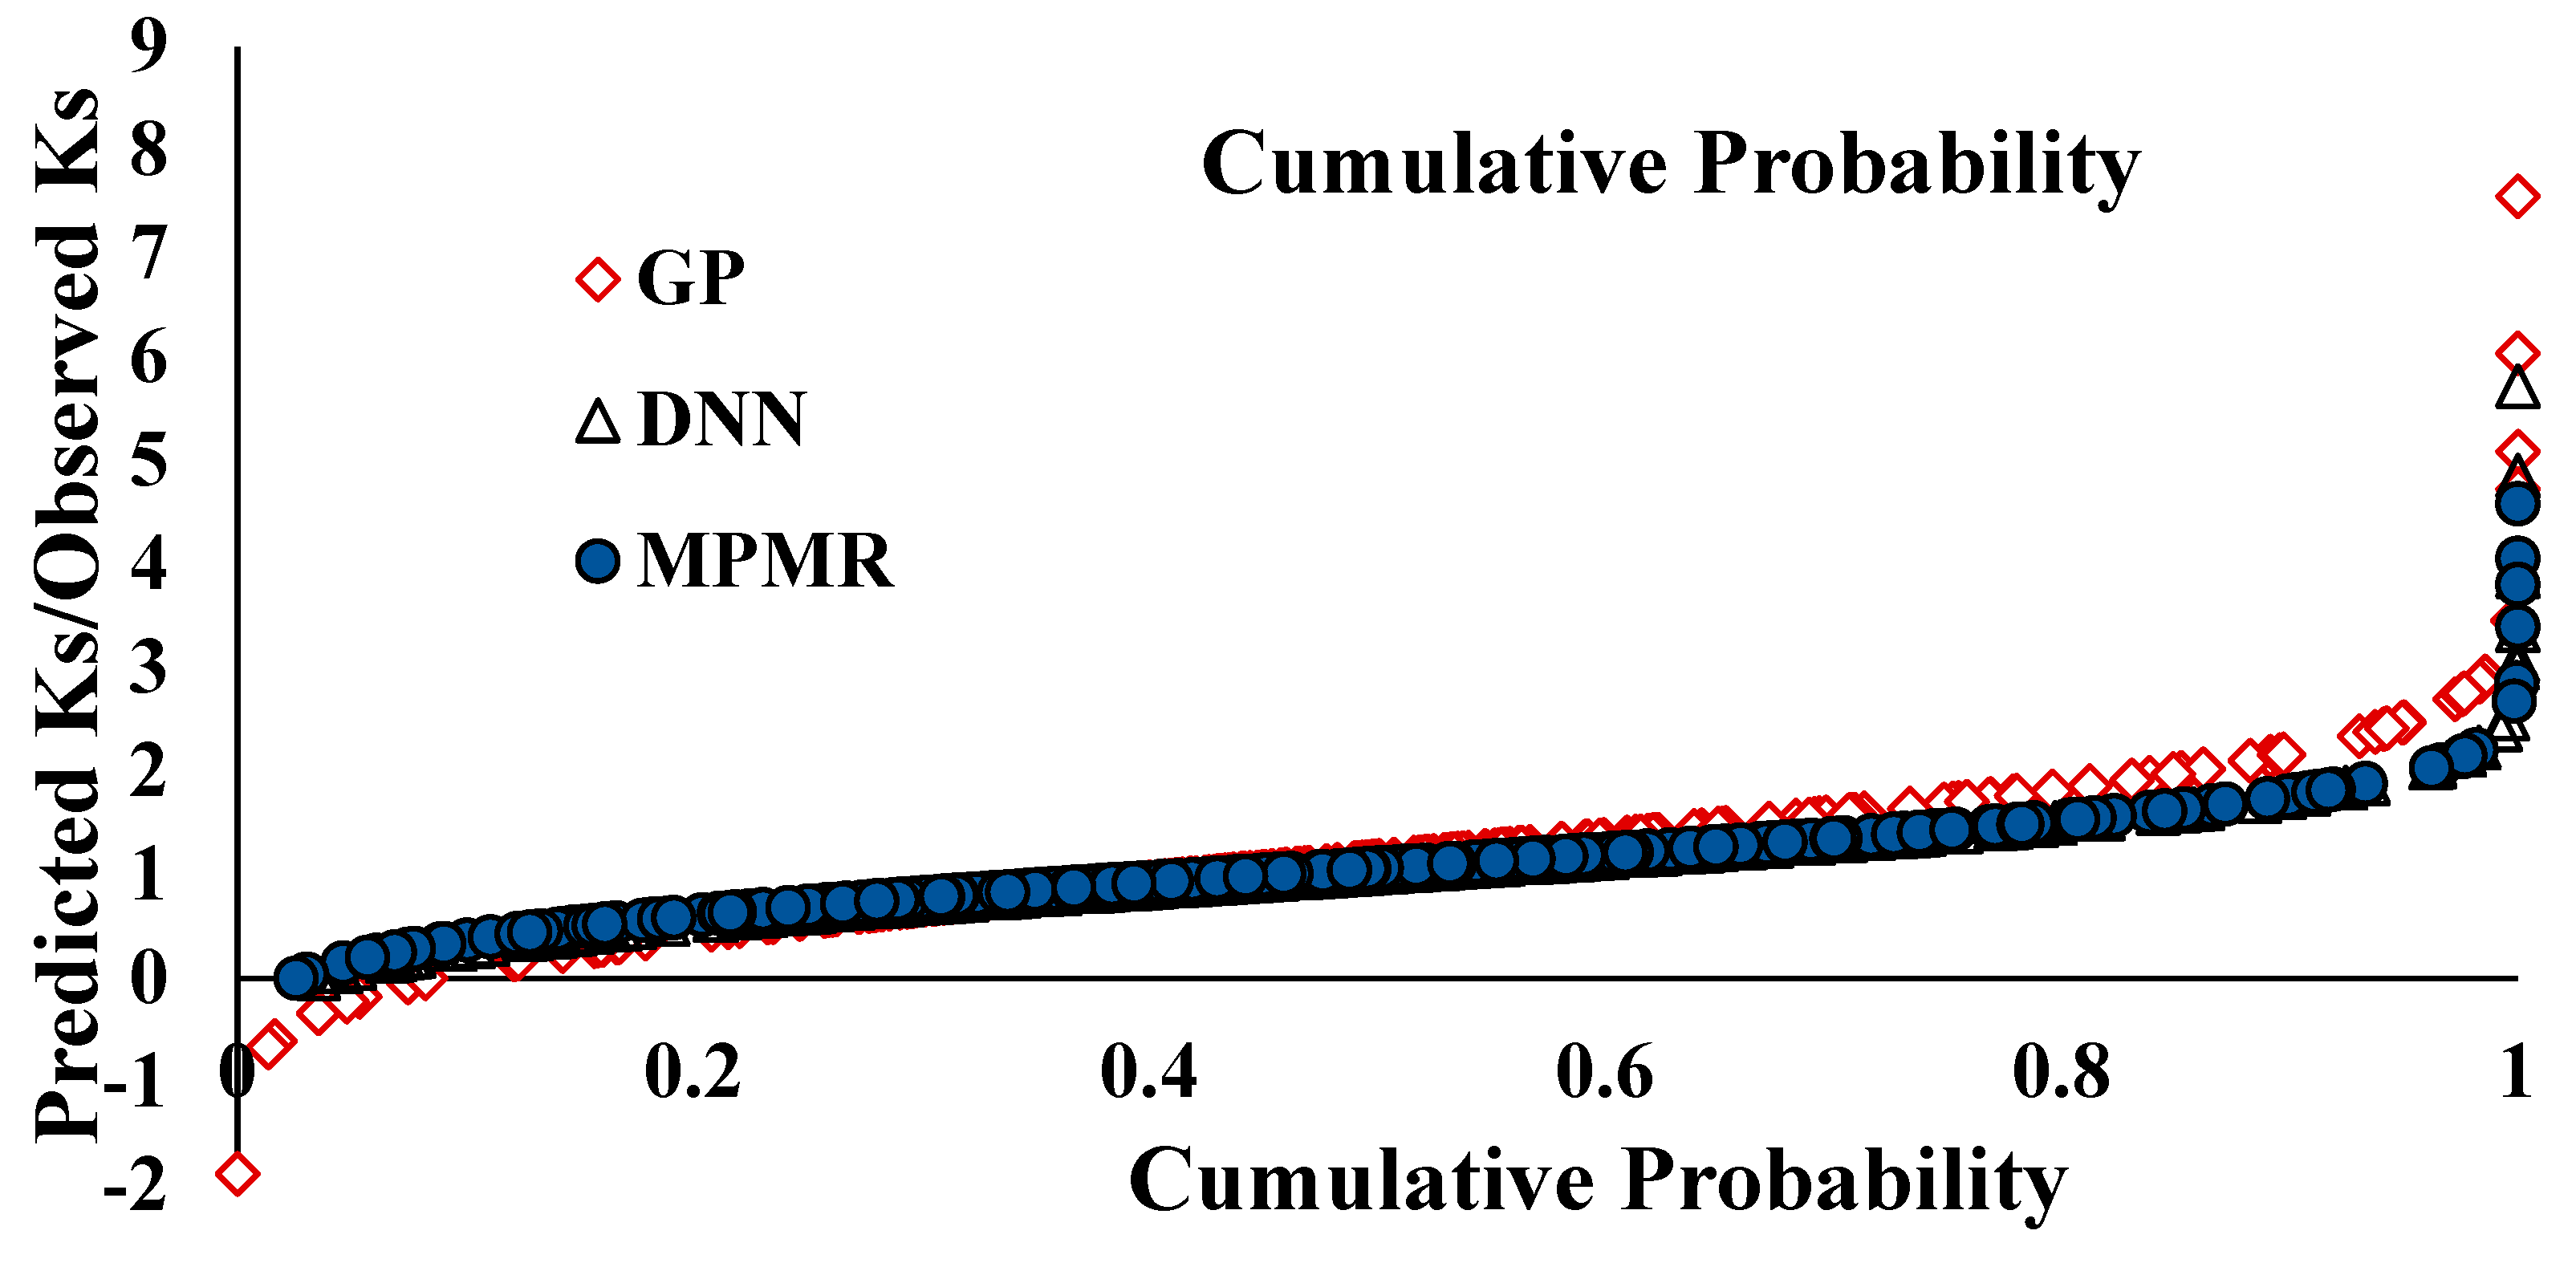
4. Results and Discussion

The performance of the developed machine learning models is discussed in this section. In order to attain the best performance of the developed models, various tuning parameters have been modified by the hit-and-run approach. The following Table 4 depicts the different tuning parameters for the respective machine learning models.
The above Table 4 depicts various respective tuning parameters for the adopted models to extract the best potential for the adopted dataset. The GP model has many regulators compared to the other MPMR and DNN models. The potency of the MPMR model depends on σ and ε. Similarly, the DNN model also has varied parameters. All the above-mentioned parameters were obtained by hit and trial approaches. The adopted machine learning models proclaimed their best optimized outcome from the above specified tuning variables. The potential of the developed models can be assessed using the correlation coefficient (R) value. The ideal value of R is unity, and it can be determined by using the following Equation (14).
R = i = 1 n ( U i U i ¯ ) ( L i L i ¯ ) i = 1 n ( U i U i ¯ ) 2 i = 1 n ( L i L i ¯ ) 2
where Li = predicted; Ui = observed; Lm = mean of predicted; Um = mean of actual; n is the total number of datasets
The R value of GP is 0.943 for training and 0.944 for the testing dataset with 600 populations; 150 generations with a maximum 9 number of genes and various functions by the trial-and-error method in order to obtain the best-optimized equation for predicting the lateral confining coefficient of rectangular and square columns. The following is the equation generated by the GP model.
  K s = 2.268 ( b ) + 0.3329 ( h ) + 0.1053 ( r ) + 0.2276 ( E C F R P ) 0.1053 p s q r o o t ( e x p ( ( E C F R P ) ) 0.4354 s q u a r e ( s q u a r e ( ( E C F R P ) ) 0.2362 c o s ( e x p ( e x p ( c o s ( e x p ( b ) ) ) ) ) 1.62 p s q r o o t ( 0.1906 ( b ) ( E C F R P   ) ( F c o ) + 1.62 e x p ( c o s ( e x p ( b ) ) ) 0.3329 p s q r o o t ( h ) + 0.4354 ( h ) ( E C F R P   ) 0.2363 t w ( b r + E C F R P   ) + 0.0068 ( b ) c o s ( e x p ( t w ) p s q r o o t ( t w ) ) ( F c o b ( E C F R P   ) ) + 2.803 t w E C F R P   ( F c o ( r ) + p s q r o o t ( exp ( t w ) ) + 2.911 t w b ( E C F R P   ) 2 e x p ( c o s ( 3.359 ( F c o ) ) 0.1468 b + c o s ( r b ) 2 + 0.000521 t w exp ( t w ) ( F c o r ( E C F R P   ) ( c o s ( e x p ( E C F R P   ) ) b 2 ) 2.644
The potency of the MPMR model relies upon two tuning parameters, σ and ε, and the values 0.8 and 0.005 have been determined by random approach. At these values, the MPMR model delivered the best outcome, which was encouraging. The DNN model exhibits the better performance with 5 hidden layers and 20 hidden neurons at 1000 iterations, whereby the value of R = 0.898 for training and R = 0.844 for the testing dataset. The following Figure 10 and Figure 11 depict the training and testing performance of the developed GP, MPMR and DNN models.
The above Figure 10 and Figure 11 depict that the adopted models performed well for determining the Ks of CFRP-wrapped RC columns. Among the developed models, the R value of GP and MPMR models described encouraging performances compared to the DNN model. Other statistical computations have been utilized to justify the capability of the models for predicting the Ks of RC rectangular and square columns covered by CFRP. The following Table 5 conveys the different statistical calculations and their ideal values.
Based on the above Table 5, the statistical computation has been carried out and the respective computed values have been compared with the previous study [11].
The above Table 6 shows various statistical parameters and their values for the respective developed models. The R2 value of GP (0.89) is comparatively much better than the other developed MPMR and DNN models. However, the Fuzzy logic method is slightly better than the GP model, but the dataset for fuzzy logic was not parallel quantitatively. The MAE and RMSE of the developed GP, MPMR and DNN models were comparatively less than the Fuzzy logic model. Among the developed models in this study, the IA value is almost in the vicinity of the ideal value 1, which depicts the GP and MPMR models performed well for the prediction. The FV value of GP and DNN models is better, whereas the MPMR model displayed better performance by depicting the FA2 values. The value of CV and DW statistic conveys the better performance of the GP model when compared with other developed models in this study. The NMBE value of the training GP model conveys that it has the least error that is ignorable. However, the testing dataset value inferred that the model under predicted. Similar to the GP model, MPMR also has both ignorable error and under predicted values, but the DNN model did underprediction. Based on the computed statistical calculations, the rank analysis has been carried out and tabulated in the following Table 7 in order to determine the best model among the developed models. Since three models were utilized in this study, a maximum of 3 points was awarded to the best model and reduced to unity for the least performed model.
Table 7 conveys that the GP model secured more points than the other MPMR and DNN models. Thus, GP outperforms the other models. The cumulative and log normal distributions of the different models have been plotted between the ratios of predicted to the measured values and the cumulative and log normal distributions [89]. The following Figure 12 and Figure 13 depict that most of the values are in the range of 1, which expose the potential of the developed models.
Taylor diagram is one of the charts that express the comparison of variables from one or more datasets to one or more reference datasets. In our study, the reference is considered as 1, and if the value of the respective model is in the vicinity of 1, then it can be referred to as the best model. Taylor diagrams for the training and testing datasets are displayed in the upcoming Figure 14 and Figure 15. The GP and MPMR models are almost close to the reference in the training dataset, whereas the GP model exposed more precision in the training dataset compared with the other models.
All the above performance indices, statistical computations, rank analysis and Taylor diagrams represent that the developed GP and MPMR models exhibit better performances in forecasting the linear confinement coefficient of rectangular and square columns covered by carbon fiber reinforced polymer.

5. Conclusions

Carbon fiber reinforced polymer is one of the advanced composite materials with better pros, such as mild weight, high strength and non-corrodible properties. The usage of CFRP in the load-bearing component of a structure makes the building more reliable. In this research study, based on the literature data available from experiments, the prediction of lateral confinement coefficient (Ks) of CFRP-wrapped non-circular columns was computed through intelligent models, such as GP, MPMR and DNN. The dimensions and strength properties (width, length, total thickness of CFRP, corner radii, elastic young modulus of CFRP and the compressive strength of unconfined concrete) of the non-circular columns wrapped with CFRP were considered to accomplish the computation. When compared with the literature model, the corner radii were also considered as the input in this study. Based on the hit-and-trial approach, the tuning parameters were concluded, in which the models had higher precision and the least errors. When comparing the accuracy of the intelligent models, GP model performed better (R2 = 0.89) than the MPMR model (R2 = 0.885). The error comparison carried out also showed that the GP model (RMSE = 0.056 and NMBE = 0.001) outperformed the other models with fewer errors. A comparison of all the statistical parameters of the developed models and the models developed in the literature was also tabulated. The rank analysis was performed to find out which model had the greatest potential in predicting the Ks value of CFRP-wrapped columns. The Taylor diagram showed that the GP and MPMR models have good capability in forecasting this specific structural problem. The application of this knowledge-based model is more unpretentious than complex mathematical formulations used to determine the constitutive performance of CFRP-confined rectangular and square RC columns. These machine learning models demonstrated that complicated structural engineering issues can be resolved in a cost and time effective manner.

Author Contributions

Conceptualization, C.M.; Methodology, X.X. and J.J.; Software, P.S.; Formal analysis, G.M.A.; Investigation, O.I.K.; Data curation, C.M.; Writing – original draft, J.J.; Writing – review & editing, O.I.K. and G.M.A.; Supervision, P.S.; Funding acquisition, X.X. All authors have read and agreed to the published version of the manuscript.

Funding

This work is supported by the National Natural Science Foundation of China (No. 62172095) and the Natural Science Foundation of Fujian Province (Nos. 2020J01875 and 2022J01644).

Data Availability Statement

All data that support the findings of this study are available from the corresponding authors upon reasonable request. However, they are mentioned in the references.

Conflicts of Interest

The authors declare no conflict of interest.

References

  1. Mirmiran, A.; Samaan, M.; Cabrera, S.; Shahawy, M. Design, manufacture and testing of a new hybrid column. Constr. Build. Mater. 1998, 12, 39–49. [Google Scholar] [CrossRef]
  2. Saljoughian, A.; Mostofinejad, D. Axial-flexural interaction in square RC columns confined by intermittent CFRP wraps. Compos. Part B Eng. 2016, 89, 85–95. [Google Scholar] [CrossRef]
  3. Zeng, J.J.; Guo, Y.C.; Gao, W.Y.; Li, J.Z.; Xie, J.H. Behavior of partially and fully FRP-confined circularized square columns under axial compression. Constr. Build. Mater. 2017, 152, 319–332. [Google Scholar] [CrossRef]
  4. NadimiShahraki, K.; Reisi, M. Stress-strain based method for analysis and design of FRP wrapped reinforced concrete columns. Structures 2020, 28, 1818–1830. [Google Scholar] [CrossRef]
  5. Schnerch, D.; Dawood, M.; Rizkalla, S.; Sumner, E.; Stanford, K. Bond behavior of CFRP strengthened steel structures. Adv. Struct. Eng. 2006, 9, 805–817. [Google Scholar] [CrossRef]
  6. ACI Committee 440. Specification for Carbon and Glass Fiber-Reinforced Polymer bar Materials for Concrete Reinforcement; American Concrete Institute: Farmington Hills, MI, USA, 2008. [Google Scholar]
  7. Alsaad, A.; Hassan, G. Utilization of CFRP for strengthening RC columns in marine environment. Case Stud. Constr. Mater. 2017, 7, 30–35. [Google Scholar] [CrossRef]
  8. Yazdani, N.; Beneberu, E.; Mohiuddin, A.H. CFRP retrofit of concrete circular columns: Evaluation of design guidelines. Compos. Struct. 2018, 202, 458–464. [Google Scholar] [CrossRef]
  9. Xu, Y.; Liu, C.; Chai, L.; Luo, C. The effect of defect size on the integrity of CFRP-confined concrete column. Constr. Build. Mater. 2019, 200, 521–529. [Google Scholar] [CrossRef]
  10. Amran, Y.M.; Alyousef, R.; Alabduljabbar, H.; Alaskar, A.; Alrshoudi, F. Properties and water penetration of structural concrete wrapped with CFRP. Results Eng. 2020, 5, 100094. [Google Scholar] [CrossRef]
  11. Doran, B.; Yetilmezsoy, K.; Murtazaoglu, S. Application of fuzzy logic approach in predicting the lateral confinement coefficient for RC columns wrapped with CFRP. Eng. Struct. 2015, 88, 74–91. [Google Scholar] [CrossRef]
  12. Yetilmezsoy, K.; Sihag, P.; Kıyan, E.; Doran, B. A benchmark comparison and optimization of Gaussian process regression, support vector machines, and M5P tree model in approximation of the lateral confinement coefficient for CFRP-wrapped rectangular/square RC columns. Eng. Struct. 2021, 246, 113106. [Google Scholar] [CrossRef]
  13. Richart, F.E.; Brandtzæg, A.; Brown, R.L. A Study of the Failure of Concrete under Combined Compressive Stresses; University of Illinois at Urbana Champaign, College of Engineering, Engineering Experiment Station: Bozeman, MT, USA, 1928. [Google Scholar]
  14. Kent, D.C.; Park, R. Flexural members with confined concrete. J. Struct. Div. 1971, 97, 1969–1990. [Google Scholar] [CrossRef]
  15. Sheikh, S.A.; Uzumeri, S.M. Analytical model for concrete confinement in tied columns. J. Struct. Div. 1982, 108, 2703–2722. [Google Scholar] [CrossRef]
  16. Restrepol, J.I.; DeVino, B. Enhancement of the axial load carrying capacity of reinforced concrete columns by means of fiberglass-epoxy jackets. In Proceedings of the 2nd International Conference on Advanced Composite Materials in Bridges and Structures, Acmbs-II, Montreal, QC, Canada, 11–14 August 1996. [Google Scholar]
  17. Miyauchi, K.; Nishibayashi, S.; Inoue, S. Estimation of Strengthening Effects wi th Carbon Fiber Sheet for Concrete Column. In Proceedings of the Third International Symp Non-Metallic FRP Concr Struct Japan, Sapporo, Japan, 14–16 October 1997; Volume 224. [Google Scholar]
  18. Murugadoss, J.R.; Lee, B.J.; Bang, J.W.; Ganesh Prabhu, G.; Kim, Y.Y. Performance analysis of CFRP composite strips confined RC columns under axial compression. Adv. Mater. Sci. Eng. 2015, 2015, 170295. [Google Scholar] [CrossRef] [Green Version]
  19. Jin, L.; Chen, H.; Wang, Z.; Du, X. Size effect on axial compressive failure of CFRP-wrapped square concrete columns: Tests and simulations. Compos. Struct. 2020, 254, 112843. [Google Scholar] [CrossRef]
  20. Koza, J.R. Genetic Programming: On the Programming of Computers by Means of Natural Selection; MIT Press: Cambridge, MA, USA, 1992; Volume 1. [Google Scholar]
  21. Pinheiro, V.H.C.; Schirru, R. Genetic programming applied to the identification of accidents of a PWR nuclear power plant. Ann. Nucl. Energy 2019, 124, 335–341. [Google Scholar] [CrossRef]
  22. Qi, C.; Tang, X.; Dong, X.; Chen, Q.; Fourie, A.; Liu, E. Towards Intelligent Mining for Backfill: A genetic programming-based method for strength forecasting of cemented paste backfill. Miner. Eng. 2019, 133, 69–79. [Google Scholar] [CrossRef]
  23. El-Bosraty, A.H.; Ebid, A.M.; Fayed, A.L. Estimation of the undrained shear strength of east Port-Said clay using the genetic programming. Ain Shams Eng. J. 2020, 11, 961–969. [Google Scholar] [CrossRef]
  24. Cheng, Z.L.; Zhou, W.H.; Garg, A. Genetic programming model for estimating soil suction in shallow soil layers in the vicinity of a tree. Eng. Geol. 2020, 268, 105506. [Google Scholar] [CrossRef]
  25. Gondia, A.; Ezzeldin, M.; El-Dakhakhni, W. Mechanics-guided genetic programming expression for shear-strength prediction of squat reinforced concrete walls with boundary elements. J. Struct. Eng. 2020, 146, 04020223. [Google Scholar] [CrossRef]
  26. Sharif, M.R.; Zavareh, S.M.R.S.T. Numerical analysis of the shear strength of circular reinforced concrete columns subjected to cyclic lateral loads using linear genetic programming. Eng. Comput. 2020, 37, 2517–2537. [Google Scholar] [CrossRef]
  27. Onyelowe, K.C.; Ebid, A.M.; Onyia, M.E.; Nwobia, L.I. Predicting nanocomposite binder improved unsaturated soil UCS using genetic programming. Nanotechnol. Environ. Eng. 2021, 6, 1–12. [Google Scholar] [CrossRef]
  28. Ebid, A.M.; Nwobia, L.I.; Onyelowe, K.C.; Aneke, F.I. Predicting Nanobinder-Improved Unsaturated Soil Consistency Limits Using Genetic Programming and Artificial Neural Networks. Appl. Comput. Intell. Soft Comput. 2021, 2021, 5992628. [Google Scholar] [CrossRef]
  29. Strohmann, T.; Grudic, G.Z. A formulation for minimax probability machine regression. Adv. Neural Inf. Process. Syst. 2002, 15, 769–776. [Google Scholar]
  30. Deo, R.C.; Samui, P. Forecasting evaporative loss by least-square support-vector regression and evaluation with genetic programming, Gaussian process, and minimax probability machine regression: Case study of Brisbane City. J. Hydrol. Eng. 2017, 22, 05017003. [Google Scholar] [CrossRef]
  31. Gopinath, K.G.S.; Pal, S.; Tambe, P. Prediction of hardness and fracture toughness in Liquid-Phase-Sintered alumina system using Gaussian process regression and minimax probability machine regression. Mater. Today Proc. 2018, 5, 12223–12232. [Google Scholar] [CrossRef]
  32. Samui, P.; Kim, D.; Jagan, J.; Roy, S.S. Determination of uplift capacity of suction caisson using Gaussian process regression, minimax probability machine regression and extreme learning machine. Iran. J. Sci. Technol. Trans. Civ. Eng. 2019, 43, 651–657. [Google Scholar] [CrossRef]
  33. Kumar, S.; Rai, B.; Biswas, R.; Samui, P.; Kim, D. Prediction of rapid chloride permeability of self-compacting concrete using Multivariate Adaptive Regression Spline and Minimax Probability Machine Regression. J. Build. Eng. 2020, 32, 101490. [Google Scholar] [CrossRef]
  34. Canziani, A.; Paszke, A.; Culurciello, E. An analysis of deep neural network models for practical applications. arXiv 2016, arXiv:1605.07678. [Google Scholar]
  35. Liu, W.; Wang, Z.; Liu, X.; Zeng, N.; Liu, Y.; Alsaadi, F.E. A survey of deep neural network architectures and their applications. Neurocomputing 2017, 234, 11–26. [Google Scholar] [CrossRef]
  36. Bau, D.; Zhu, J.Y.; Strobelt, H.; Lapedriza, A.; Zhou, B.; Torralba, A. Understanding the role of individual units in a deep neural network. Proc. Natl. Acad. Sci. USA 2020, 117, 30071–30078. [Google Scholar] [CrossRef]
  37. Khan, A.I.; Shah, J.L.L.; Bhat, M.M. CoroNet: A deep neural network for detection and diagnosis of COVID-19 from chest x-ray images. Comput. Methods Programs Biomed. 2020, 196, 105581. [Google Scholar] [CrossRef]
  38. Tedjopurnomo, D.A.; Bao, Z.; Zheng, B.; Choudhury, F.; Qin, A.K. A survey on modern deep neural network for traffic prediction: Trends, methods and challenges. IEEE Trans. Knowl. Data Eng. 2020, 34, 1544–1561. [Google Scholar] [CrossRef]
  39. Nafees, A.; Amin, M.N.; Khan, K.; Nazir, K.; Ali, M.; Javed, M.F.; Fahid, A.; Musrat, M.A.; Vatin, N.I. Modeling of mechanical properties of silica fume-based green concrete using machine learning techniques. Polymers 2022, 14, 30. [Google Scholar] [CrossRef] [PubMed]
  40. Amin, M.N.; Iqbal, M.; Khan, K.; Qadir, M.G.; Shalabi, F.I.; Jamal, A. Ensemble tree-based approach towards flexural strength prediction of frp reinforced concrete beams. Polymers 2022, 14, 1303. [Google Scholar] [CrossRef] [PubMed]
  41. Khan, K.; Ahmad, W.; Amin, M.N.; Aslam, F.; Ahmad, A.; Al-Faiad, M.A. Comparison of prediction models based on machine learning for the compressive strength estimation of recycled aggregate concrete. Materials 2022, 15, 3430. [Google Scholar] [CrossRef] [PubMed]
  42. Khan, K.; Iqbal, M.; Salami, B.A.; Amin, M.N.; Ahamd, I.; Alabdullah, A.A.; Arab, A.M.A.; Jalal, F.E. Estimating Flexural Strength of FRP Reinforced Beam Using Artificial Neural Network and Random Forest Prediction Models. Polymers 2022, 14, 2270. [Google Scholar] [CrossRef]
  43. Kumar, P.; Samui, P. Design of an Energy Pile Based on CPT Data Using Soft Computing Techniques. Infrastructures 2022, 7, 169. [Google Scholar] [CrossRef]
  44. Samui, P.; Yesilyurt, S.N.; Dalkilic, H.Y.; Yaseen, Z.M.; Roy, S.S.; Kumar, S. Comparison of different optimized machine learning algorithms for daily river flow forecasting. Earth Sci. Inform. 2022, 1–16. [Google Scholar] [CrossRef]
  45. Onyelowe, K.C.; Jayabalan, J.; Ebid, A.M.; Samui, P.; Singh, R.P.; Soleymani, A.; Jahangir, H. Evaluation of the Compressive Strength of CFRP-Wrapped Circular Concrete Columns Using Artificial Intelligence Techniques. Designs 2022, 6, 112. [Google Scholar] [CrossRef]
  46. Singhal, S.; Jatana, N.; Subahi, A.F.; Gupta, C.; Khalaf, O.I.; Alotaibi, Y. Fault Coverage-Based Test Case Prioritization and Selection Using African Buffalo Optimization. Comput. Mater. Contin. 2023, 74, 6755–6774. [Google Scholar] [CrossRef]
  47. Rahman, H.; Tariq, J.; Masood, M.A.; Subahi, A.F.; Khalaf, O.I.; Alotaibi, Y. Multi-Tier Sentiment Analysis of Social Media Text Using Supervised Machine Learning. Comput. Mater. Contin. 2023, 74, 5527–5543. [Google Scholar] [CrossRef]
  48. Banumathy, D.; Khalaf, O.I.; Romero, C.A.T.; Indra, J.; Sharma, D.K. CAD of BCD from Thermal Mammogram Images Using Machine Learning. Intell. Autom. Soft Comput. 2022, 34, 667–685. [Google Scholar] [CrossRef]
  49. Srividhya, S.R.; Kavitha, C.; Lai, W.C.; Mani, V.; Khalaf, O.I. A Machine Learning Algorithm to Automate Vehicle Classification and License Plate Detection. Wirel. Commun. Mob. Comput. 2022, 2022, 9273233. [Google Scholar] [CrossRef]
  50. Banumathy, D.; Khalaf, O.I.; Tavera, R.C.A.; Raja, P.V.; Sharma, D.K. Breast calcifications and histopathological analysis on tumour detection by CNN. Comput. Syst. Sci. Eng. 2023, 44, 595–612. [Google Scholar] [CrossRef]
  51. Kandhro, I.A.; Uddin, M.; Hussain, S.; Chaudhery, T.J.; Shorfuzzaman, M.; Meshref, H.; Albalhaq, M.; Alsaqour, R.; Khalaf, O.I. Impact of Activation, Optimization, and Regularization Methods on the Facial Expression Model Using CNN. Comput. Intell. Neurosci. 2022, 2022, 3098604. [Google Scholar] [CrossRef]
  52. Subahi, A.F.; Khalaf, O.I.; Alotaibi, Y.; Natarajan, R.; Mahadev, N.; Ramesh, T. Modified Self-Adaptive Bayesian Algorithm for Smart Heart Disease Prediction in IoT System. Sustainability 2022, 14, 14208. [Google Scholar] [CrossRef]
  53. Palanisamy, S.; Hajjej, F.; Khalaf, O.I.; Abdulsahib, G.M. Discrete Fourier Transform with Denoise Model Based Least Square Wiener Channel Estimator for Channel Estimation in MIMO-OFDM. Entropy 2022, 24, 1601. [Google Scholar]
  54. Wu, Y.F.; Wang, L.M. Unified strength model for square and circular concrete columns confined by external jacket. J. Struct. Eng. 2009, 135, 253–261. [Google Scholar] [CrossRef]
  55. Smith, S.T.; Kim, S.J.; Zhang, H. Behavior and effectiveness of FRP wrap in the confinement of large concrete cylinders. J. Compos. Constr. 2010, 14, 573–582. [Google Scholar] [CrossRef]
  56. Wang, Z.; Wang, D.; Smith, S.T.; Lu, D. CFRP-confined square RC columns. I: Experimental investigation. J. Compos. Constr. 2012, 16, 150–160. [Google Scholar] [CrossRef]
  57. Vincent, T.; Ozbakkaloglu, T. Influence of overlap configuration on compressive behavior of CFRP-confined normal-and high-strength concrete. Mater. Struct. 2016, 49, 1245–1268. [Google Scholar] [CrossRef]
  58. Shan, B.; Gui, F.C.; Monti, G.; Xiao, Y. Effectiveness of CFRP confinement and compressive strength of square concrete columns. J. Compos. Constr. 2019, 23, 04019043. [Google Scholar] [CrossRef]
  59. Demers, M.; Neale, K.W. Strengthening of concrete columns with unidirectional composite sheets. Dev. Short Medium Span Bridge Eng. 1994, 895–905. [Google Scholar]
  60. Engineering, S.C. Axial Load Charact. Rectangular Columns Wrapped TYFO-S Jackets; Report; (No. 96/04); Hexcell Fyfe Inc.: Solana Beach, CA, USA, 1996. [Google Scholar]
  61. Rochette, P.; Labossiere, P. Axial testing of rectangular column models confined with composites. J. Compos. Constr. 2000, 4, 129–136. [Google Scholar] [CrossRef]
  62. Azarnejad, A.; Tadros, G.; Shrive, N.G.; McWhinnie, K. Column strengthening with CFRP wraps. In Proceedings of the Canadian Society of Civil Engineers Structural Conference, London, ON, Canada, 7–10 June 2000; pp. 7–10. [Google Scholar]
  63. Xiao, Y.; Wu, H. Compressive behavior of concrete confined by carbon fiber composite jackets. J. Mater. Civ. Eng. 2000, 12, 139–146. [Google Scholar] [CrossRef]
  64. Parvin, A.; Wang, W. Behavior of FRP jacketed concrete columns under eccentric loading. J. Compos. Constr. 2001, 5, 146–152. [Google Scholar] [CrossRef]
  65. Pessiki, S.; Harries, K.A.; Kestner, J.T.; Sause, R.; Ricles, J.M. Axial behavior of reinforced concrete columns confined with FRP jackets. J. Compos. Constr. 2001, 5, 237–245. [Google Scholar] [CrossRef]
  66. Suter, R.; Pinzelli, R. Confinement of concrete columns with FRP sheets. In Proceedings of the 5th International Conference on Fibre Reinforced Plastics for Reinforced Concrete Structures, Cambridge, UK, 16–18 July 2001; pp. 793–802. [Google Scholar]
  67. Shehata, I.A.; Carneiro, L.A.; Shehata, L.C. Strength of short concrete columns confined with CFRP sheets. Mater. Struct. 2002, 35, 50–58. [Google Scholar] [CrossRef]
  68. Lam, L.; Teng, J.G. Design-oriented stress-strain model for FRP-confined concrete in rectangular columns. J. Reinf. Plast. Compos. 2003, 22, 1149–1186. [Google Scholar] [CrossRef]
  69. Chaallal, O.; Hassan, M.; Shahawy, M. Confinement model for axially loaded short rectangular columns strengthened with fiber-reinforced polymer wrapping. Struct. J. 2003, 100, 215–221. [Google Scholar]
  70. Ilki, A.; Kumbasar, N. Compressive behaviour of carbon fibre composite jacketed concrete with circular and non-circular cross-sections. J. Earthq. Eng. 2003, 7, 381–406. [Google Scholar] [CrossRef]
  71. Masia, M.J.; Gale, T.N.; Shrive, N.G. Size effects in axially loaded square-section concrete prisms strengthened using carbon fibre reinforced polymer wrapping. Can. J. Civ. Eng. 2004, 31, 1–13. [Google Scholar] [CrossRef]
  72. Harajli, M.H. Axial stress–strain relationship for FRP confined circular and rectangular concrete columns. Cem. Concr. Compos. 2006, 28, 938–948. [Google Scholar] [CrossRef]
  73. Al-Salloum, Y.A. Influence of edge sharpness on the strength of square concrete columns confined with FRP composite laminates. Compos. Part B Eng. 2007, 38, 640–650. [Google Scholar] [CrossRef]
  74. Rousakis, T.C.; Karabinis, A.I.; Kiousis, P.D. FRP-confined concrete members: Axial compression experiments and plasticity modelling. Eng. Struct. 2007, 29, 1343–1353. [Google Scholar] [CrossRef]
  75. Ilki, A.; Peker, O.; Karamuk, E.; Demir, C.; Kumbasar, N. FRP retrofit of low and medium strength circular and rectangular reinforced concrete columns. J. Mater. Civ. Eng. 2008, 20, 169–188. [Google Scholar] [CrossRef]
  76. Wang, L.M.; Wu, Y.F. Effect of corner radius on the performance of CFRP-confined square concrete columns: Test. Eng. Struct. 2008, 30, 493–505. [Google Scholar] [CrossRef]
  77. Tao, Z.; Yu, Q.; Zhong, Y.Z. Compressive behavior of CFRP-confined rectangular concrete columns. Mag. Concr. Res. 2008, 60, 735–745. [Google Scholar] [CrossRef]
  78. Wu, Y.F.; Wei, Y.Y. Effect of cross-sectional aspect ratio on the strength of CFRP-confined rectangular concrete columns. Eng. Struct. 2010, 32, 32–45. [Google Scholar] [CrossRef]
  79. Abbasnia, R.; Ziaadiny, H. Behavior of concrete prisms confined with FRP composites under axial cyclic compression. Eng. Struct. 2010, 32, 648–655. [Google Scholar] [CrossRef]
  80. Abbasnia, R.; Hosseinpour, F.; Rostamian, M.; Ziaadiny, H. Cyclic and monotonic behavior of FRP confined concrete rectangular prisms with different aspect ratios. Constr. Build. Mater. 2013, 40, 118–125. [Google Scholar] [CrossRef]
  81. Ye, L.P.; Zhang, K.; Zhao, S.H.; Feng, P. Experimental study on seismic strengthening of RC columns with wrapped CFRP sheets. Constr. Build. Mater. 2003, 17, 499–506. [Google Scholar] [CrossRef]
  82. Dirikgil, T. Experimental investigation of the effects of concrete strength and axial load ratio on the performances of CFRP-wrapped and externally collared RC short columns. Eng. Struct. 2021, 230, 111647. [Google Scholar] [CrossRef]
  83. Dou, T.; Lopes, Y.K.; Rockett, P.; Hathway, E.A.; Saber, E. Model predictive control of non-domestic heating using genetic programming dynamic models. Appl. Soft Comput. 2020, 97, 106695. [Google Scholar] [CrossRef]
  84. Bertsimas, D.; Sethuraman, J. Moment problems and semidefinite optimization. In Handbook of Semidefinite Programming; Springer: Boston, MA, USA, 2000; pp. 469–509. [Google Scholar]
  85. Ceryan, N.; Samui, P. Application of soft computing methods in predicting uniaxial compressive strength of the volcanic rocks with different weathering degree. Arab. J. Geosci. 2020, 13, 1–18. [Google Scholar] [CrossRef]
  86. Hinton, G.E.; Salakhutdinov, R.R. Reducing the dimensionality of data with neural networks. Science 2006, 313, 504–507. [Google Scholar] [CrossRef] [Green Version]
  87. Zhong, S.; Hu, J.; Fan, X.; Yu, X.; Zhang, H. A deep neural network combined with molecular fingerprints (DNN-MF) to develop predictive models for hydroxyl radical rate constants of water contaminants. J. Hazard. Mater. 2020, 383, 121141. [Google Scholar] [CrossRef]
  88. Manjula, C.; Florence, L. Deep neural network-based hybrid approach for software defect prediction using software metrics. Clust. Comput. 2019, 22, 9847–9863. [Google Scholar] [CrossRef]
  89. Shen, L.; Muduli, K.; Barve, A. Developing a sustainable development framework in the context of mining industries: AHP approach. Res. Policy 2015, 46, 15–26. [Google Scholar] [CrossRef]
Figure 1. (a) RC columns fully and partially covered by CFRP (b) Load dispersion in fully- and partially-wrapped CFRP columns (c) Effective lateral confining stress provided by CFRP.
Symmetry 15 00545 g001
Figure 2. Heatmap of the correlation coefficient matrix for the dataset.
Symmetry 15 00545 g002
Figure 3. Scatterplot matrix of the input and output variables.
Symmetry 15 00545 g003
Figure 4. Typical methods and the adopted machine learning methods.
Symmetry 15 00545 g004
Figure 5. Example of a common GP tree for the expression Y = (−Z) + (0.5 × (−U(k)).
Symmetry 15 00545 g005
Figure 6. (a) Crossover operation (b) Mutation operation.
Symmetry 15 00545 g006
Figure 7. Decision hyperplane computed by MPMR.
Symmetry 15 00545 g007
Figure 8. Typical deep neural network structure.
Symmetry 15 00545 g008
Figure 9. Flowchart of the DNN model.
Symmetry 15 00545 g009
Figure 10. Training performance of the GP, MPMR and DNN models.
Symmetry 15 00545 g010
Figure 11. Testing performance of the GP, MPMR and DNN models.
Symmetry 15 00545 g011
Figure 12. Distribution chart of cumulative distributions vs. predicted/observed Ks.
Symmetry 15 00545 g012
Figure 13. Chart of log normal distributions vs. predicted/observed Ks.
Symmetry 15 00545 g013
Figure 14. Taylor diagram for training dataset.
Symmetry 15 00545 g014
Figure 15. Taylor diagram for testing dataset.
Symmetry 15 00545 g015
Table 1. Framed Ks equations from the literature.
ReferencesEquations of Ks
Ref. [13] K s = f cc f co = 1 + 4.1 f l f co
Ref. [14] K s = 1 + ρ s f yh f c
ρ s = A sh l s sb c d c
Ref. [15] K s = 1 + b c 2 140 P occ [ ( 1 mc i 2 5.5 b c 2 ) ( 1 s b c ) 2 ] ρ s f yh  
P occ = 0.85 f c ( A ck A st )  
K s = 1 + 6.7 f c ( f le ) 0.17 f le
Ref. [16] K s = 1 ( b 2 r c ) 2 + ( h 2 r c ) 2 3 bh ( 1 ρ s )
Ref. [17] f cc f ucon = 1 + k f lc f ucon
Ref. [11] K s = exp [ ( 7.16 × 10 4 ) ( b ) 0.0023 ( h ) + 0.493 ( t ) 0.0223 ( f co , ) + ( 2.42 × 10 6 ) ( E CFRP ) + 0.652 ]
Ref. [18] f lc = ρ FRP F FRP 2  
ρ frp = 8 t frp b frp D ( b frp + S frp )
Ref. [19] f l = 2 E f t f ne fe D  
D = b 2 + h 2
Table 2. Dataset comparison of the current study and earlier method [11].
Current StudyDoran et al. (2015) [11]
1No of Dataset293100
2Models
  • Genetic Programming
  • Minimax Probability Machine Regression
  • Deep Neural Network
Fuzzy Logic
3No of Inputs65
4Type of CFRP RC ColumnsRectangular and SquareRectangular
5Corner RadiiConsideredNot Considered
Table 3. Statistical summary of the adopted dataset.
b
(mm)
H
(mm)
r
(mm)
tw
(mm)
Efrp
(mm)
fco
(mm)
Ks
(mm)
Min2010850.05610,50010.830.94
Mean167.15277.0725.160.55187,852.9030.541.69
Std57.66149.7312.740.5087,680.1611.610.69
Max4571200603640,00055.364.79
skewness1.462.260.412.360.240.281.74
Kurtosis7.0511.712.7210.166.562.566.38
Table 4. Tuning parameters for the developed models.
GPMPMRDNN
Population size = 600
Number of generations = 150
Tournament size = 7
Max tree depth = 7
Functions: TIMES, MINUS, RDIVIDE, PSQROOT, SQUARE, COS, EXP
Max genes = 9
σ = 0.8
ε = 0.005
Number of Hidden layers = 5
Number of Neurons = 20
Epochs = 1000
Optimizer = ‘adam’
Loss = mean_squared_error
Table 5. Statistical assessments for the developed models.
Statistical ParametersDescriptionIdeal Condition
Coefficient of Determination,
R 2 = ( i = 1 n ( U i U m ) ( L i L m ) ) 2 i = 1 n ( U i U m ) 2   i = 1 n ( L i L m ) 2
Coefficient of determination calculates the constancy of collaboration between the actual and the predicted values.The ideal value must be near to unity.
Mean Absolute Error
M A E = 1 n i = 1 n | L i U i |
MAE enumerates the accuracy error of the predicted and actual data.MAE value should be 0. When the value of R overtures to 0.
Root Mean Square Error
R M S E = ( 1 n i = 1 n [ L i U i ] 2 ) 0.5
Analyze the measured value to the estimated value and calculate the square root of the mean residual error.RMSE has to be 0. When the value of R overtures to 1, the RMSE value will be near to 0, and vice versa.
Index of Agreement,
I A = 1 i = 1 n ( L i U i ) 2 i = 1 n ( | L i U m | + | U i U m | ) 2
Index was employed to analyze the precision of the measurable models in this investigation.The IA value should be 1 to enumerate the performance model.
Fractional Variance
F V = 2 ( σ u σ l ) / ( σ u + σ l )
FV emphases computed variance of actual and predicted data.FV ideal value must be 0.
Factor of Two (FA2)
0.5 F A 2 = 1 n i = 1 n ( U i L i ) 2
Indicates the range of the output results data between 0.5–2 as benchmark model accuracy.Based on the model performance, the range output result data should lie between 0.5–2.
Coefficient of Variation (%)
C V = R M S E U m 100
It symbolizes the ratio of the RMSE variance to the actual data variance.
It is exhibited in percentage.
The ideal value of CV should be 0. RMSE is also 0.
Durbin–Watson (DW) statistics,
D W = i = 2 n ( j i j i 1 ) 2 i = 1 n j i 2
where,   ( j i = U i L i )
It measures the predictive accuracy. To validate the predictive capability of the prediction models,The ideal value of DW must be close to 2.
Normalized Mean Bias Error (NMBE),
N M B E = 1 n i = 1   n ( L i U i ) 1 n i = 1 n U i 100
NMBE estimates the aptitude of the model to anticipate a value, which is staged away from the mean value. It is expressed in percentage.A positive NMBE reveals over-prediction, and a negative value depicts under-prediction
Where Li= predicted; Ui=observed; Lm = mean of predicted; Um= mean of actual; n is the total number of datasets.
Table 6. Comparison of statistical computations with the developed models.
Doran et al. (2015) [11] (Fuzzy Logic)
Overall
Training
GP
Testing
GP
Training
MPMR
Testing
MPMR
Training
DNN
Testing
DNN
Number of Dataset100220732207322073
R2 0.9190.890.890.8850.7120.8060.712
MAE0.1330.0410.0540.0410.0640.0360.070
RMSE0.1740.0560.0730.0570.0970.0760.117
IA0.9760.9700.9600.9690.9370.9470.883
FV0.1110.1160.3890.1230.0670.0710.499
FA20.9930.8361.1351.2371.2831.1841.454
CV(%)10.7430.77731.93331.18542.79441.42151.411
DW statistic1.5131.4531.0041.4910.9780.8420.877
NMBE (%)-0.001−9.5960.130−3.974−2.666−20.767
Table 7. Rank analysis based on statistical values.
Training (GP)Testing (GP)Training (MPMR)Testing (MPMR)Training (DNN)Testing (DNN)
R2332111
MAE132231
RMSE332211
IA133221
FV221331
FA2113321
CV (%)332211
DW statistic223111
NMBE (%)312211
Total Points19212018159
Overall Points403824
Disclaimer/Publisher’s Note: The statements, opinions and data contained in all publications are solely those of the individual author(s) and contributor(s) and not of MDPI and/or the editor(s). MDPI and/or the editor(s) disclaim responsibility for any injury to people or property resulting from any ideas, methods, instructions or products referred to in the content.

